
Alwin A. Hardenbol  ,
Hans Ole Ørka,
Terje Gobakken,
Joel Kostensalo
,
Hans Ole Ørka,
Terje Gobakken,
Joel Kostensalo
Optimising rare tree species detection for large-area mapping: a case study on European aspen (Populus tremula)
Hardenbol A. A., Ørka H. O., Gobakken T., Kostensalo J. (2026). Optimising rare tree species detection for large-area mapping: a case study on European aspen (Populus tremula). Silva Fennica vol. 60 no. 3 article id 26012. https://doi.org/10.14214/sf.26012
Highlights
- Balancing false discovery and false negative rates improves rare tree species detection
- Preferring volume- over count-based approaches makes ecological sense for rare tree species
- We detected 70% of aspen volume and classified this volume with 31% false discovery rate and 54% false negative rate
- Base rates of rare tree species have been overlooked in remote sensing literature.
Abstract
Some locally rare tree species – like European aspen (Populus tremula L.) – contribute disproportionately to forest biodiversity, making their accurate monitoring important for conservation. However, most remote sensing studies of rare tree species ignore their low prevalence/base rate, necessary for model transferability. We aimed to assess European aspen classification under realistic landscape prevalence and find methods to improve classification performance. Across 253 plots from field data in Våler, Norway we detected and segmented 5455 living trees, including 55 European aspens (ca. 1% prevalence), from high-density airborne laser scanning (ALS) data merged with multispectral aerial imagery. Individual segments were then classified as European aspen or non-aspen using random forest and synthetic minority oversampling (SMOTE). We evaluated classification based on tree counts and summed tree volumes. To underpin the importance of prevalence consideration and compare our results, we also re-analysed published Fennoscandian European aspen classification studies. Contrary to a perfect balance, we found an optimal SMOTE-ratio at ca. 0.07 (European aspen–non-aspen ratio). Our count-based classification achieved 32% (16–52) false discovery rate (FDR) and 73% (60–83) false negative rate (FNR), whereas volume-based classification achieved 31% (11–51) FDR and 54% (38–71) FNR. Re-analysed studies averaged 66% FDR and 33% FNR at a 1% prevalence. Our results demonstrate that rare tree species classification benefits from optimising majority–minority ratios and, given the ecological value of larger trees, volume-based approaches are warranted. Finally, we urge reporting landscape prevalence and adjust classification metrics to reflect these to enable transferability to real-world applications in rare tree species classification.
Keywords
Bayesian statistics;
biodiversity conservation;
base rate problem;
broadleaves;
individual tree map;
model transferability
-
Hardenbol,
Natural Resources Institute Finland (Luke), Natural Resources Unit, Yliopistokatu 6B, FI-80100 Joensuu, Finland
 https://orcid.org/0000-0002-0615-505X
E-mail
alwin.hardenbol@luke.fi
https://orcid.org/0000-0002-0615-505X
E-mail
alwin.hardenbol@luke.fi
-
Ørka,
Norwegian University of Life Sciences (NMBU), Faculty of Environmental Sciences and Natural Resource Management, P.O. Box 5003, NO-1432 Ås, Norway
https://orcid.org/0000-0002-7492-8608
E-mail
hans-ole.orka@nmbu.no
-
Gobakken,
Norwegian University of Life Sciences (NMBU), Faculty of Environmental Sciences and Natural Resource Management, P.O. Box 5003, NO-1432 Ås, Norway
https://orcid.org/0000-0001-5534-049X
E-mail
terje.gobakken@nmbu.no
-
Kostensalo,
Natural Resources Institute Finland (Luke), Natural Resources Unit, Yliopistokatu 6B, FI-80100 Joensuu, Finland
https://orcid.org/0000-0001-9883-1256
E-mail
joel.kostensalo@luke.fi
Received 11 February 2026 Accepted 21 September 2026 Published 2 October 2026
Views 3541
Available at https://doi.org/10.14214/sf.26012 | Download PDF

Supplementary Files
1 Introduction
Forests are considered essential for a wide array of species, with over half of known terrestrial species inhabiting forests (FAO 2024). The value of a forest for biodiversity is, however, inextricably linked to its tree species composition (Leidinger et al. 2021). Due to dependencies on particular tree species, biodiversity may benefit from a variety of tree species in the landscape (e.g. Emrich et al. 2025). However, as forests are typically dominated by just a few species, even in tree-species-rich rainforests (Draper et al. 2021), a high tree species diversity in the landscape will rely on the ample presence of comparatively uncommon, i.e. rare tree species (Cazzolla Gatti et al. 2022). Some of these rare tree species are further considered disproportionately important for biodiversity or ecosystem functioning (e.g. tropical trees like Pouteria maxima T.D. Penn.: Mouillot et al. 2013; Whitebark pine [Pinus albicaulis Engelm.]: Jenkins et al. 2022). Moreover, many rare tree species are becoming increasingly rare, as anthropogenic pressures increase (Guo et al. 2022; Boonman et al. 2024) and some previously common biodiversity-rich tree species could become rare (Mitchell et al. 2022). To preserve rare tree species, accurate monitoring is essential, particularly for those that function as keystone species (Mills et al. 1993), support vulnerable ecosystem functions, or face a risk of extinction. Conducting such monitoring over large areas is inherently a task that can benefit from remote sensing, assuming that their rarity is not a severe detriment to their detection.
European aspen (Populus tremula L.) in Fennoscandia is a relatively rare tree species, typically representing 1–3% of all trees in a landscape. European aspen is considered a keystone species due to its disproportionate effect on biodiversity (Esseen et al. 1997; Kouki et al. 2004). Many species that rely on European aspen are particularly dependent on large-sized, old, and mostly dead European aspens (Tikkanen et al. 2006), which do not often occur outside protected, old-growth forests. Even inside protected, old-growth forests, European aspen has been found to be in severe decline (Hardenbol et al. 2020), putting further stress on European aspen-dependent species. As a result, many European aspen-dependent species are nationally red-listed in Fennoscandia (Hyvärinen et al. 2019; SLU Artdatabanken 2020; Artsdatabanken 2021). The importance of European aspen for biodiversity and its decline in old-growth forests are fundamental reasons to monitor European aspen populations accurately.
Efforts to map European aspen from remotely sensed data have been undertaken with various types of data since the early 2000s and with increasing vigour in the 2020s. These data types include airborne laser scanning (ALS) data, multispectral and hyperspectral aerial imagery, and combinations of these data types (Säynäjoki et al. 2008; Kivinen et al. 2020; Hardenbol et al. 2021; Korpela et al. 2022; Toivonen et al. 2024). Full-waveform ALS, aerial imagery, and combinations of aerial imagery with ALS data have been portrayed as particularly effective at detecting European aspen, with F1-scores up to 97% (Hardenbol et al. 2021; Mäyrä et al. 2021; Korpela et al. 2022). These studies were conducted in a variety of forest types, including dense old-growth forests where European aspen detection is critical. The main classification hurdle described in practically all European aspen detection studies is the mix-up of European aspen with birches. This problem is, however, diminished at certain times of the growing season, particularly in spring (Hardenbol et al. 2021).
Mapping European aspen from remotely sensed data appears highly effective when evaluated under favourable sampling conditions. However, apart from Toivonen et al. (2024), previous studies have generally not accounted for the true landscape prevalence of European aspen in their evaluation designs. Reported European aspen proportions in evaluation data have reached up to 31% (Kuzmin et al. 2021), far exceeding observed landscape proportions, even within the respective study areas. Such prevalence inflation can lead to a base rate fallacy, whereby classification performance is misrepresented when a model is transferred to an area with a different prevalence of the target species without accounting for this difference. This is because some classification metrics depend on the prevalence of the target class: When a rare species such as European aspen is overrepresented in the evaluation data, false discovery rate (FDR; the probability that a detected individual does not belong to the target class) is underestimated and, correspondingly, user’s accuracy (UA) is overestimated when the model is applied to an area where aspen is less prevalent (Plevris 2025). In contrast, false negative rate (FNR; the probability that a true individual of the target class is missed) is not affected by class prevalence. For rare species, FDR and FNR are therefore particularly informative because they directly quantify the rates of false and missed detections, respectively.
The primary aim of this study was to determine whether European aspen can be classified with sufficient reliability for application in landscapes where it occurs at its naturally low prevalence. We further aimed to identify approaches that can improve the detection of this rare species, including addressing class imbalance, analysing all trees and canopy-reaching trees separately, and determining whether classification performance is better represented by tree counts or by tree volume. By re-evaluating previous European aspen classification studies at a realistic prevalence, we also aimed to determine how their reported performances translate to conditions in which European aspen is genuinely rare. This highlights the importance of prevalence consideration while also displaying how classification results of rare species can be properly compared across studies. Although European aspen provides the empirical case, these aims address a more general challenge in remote sensing-based classification of rare tree species: obtaining performance estimates that are informative for real-world applications.
2 Material and methods
2.1 Study area
Our study area was located in the Våler municipality in Østfold county, Norway, about 50 km southeast of Oslo (approximate centre coordinates: 59°31´N, 10°54´E [EPSG: 4326 – WGS 84]; Fig. 1). Our study area lies in the Boreonemoral zone (Moen and Lillethun 1998). The area is characterised by a gently undulating landscape dominated by forests and agricultural land. The ridges typically have shallow soils and low productivity, while the lower areas have more productive sites. The forest is actively managed for timber production by private forest owners. The dominant tree species in the study area are Norway spruce (Picea abies (L.) H. Karst.) and Scots pine (Pinus sylvestris L.). Silver birch (Betula pendula Roth) and downy birch (B. pubescens Ehrh.) are rather common, while less common species include European aspen, goat willow (Salix caprea L.), rowan (Sorbus aucuparia L.), and grey alder (Alnus incana (L.) Moench). This taxonomy is based on the database from the Missouri Botanical Garden (2026).
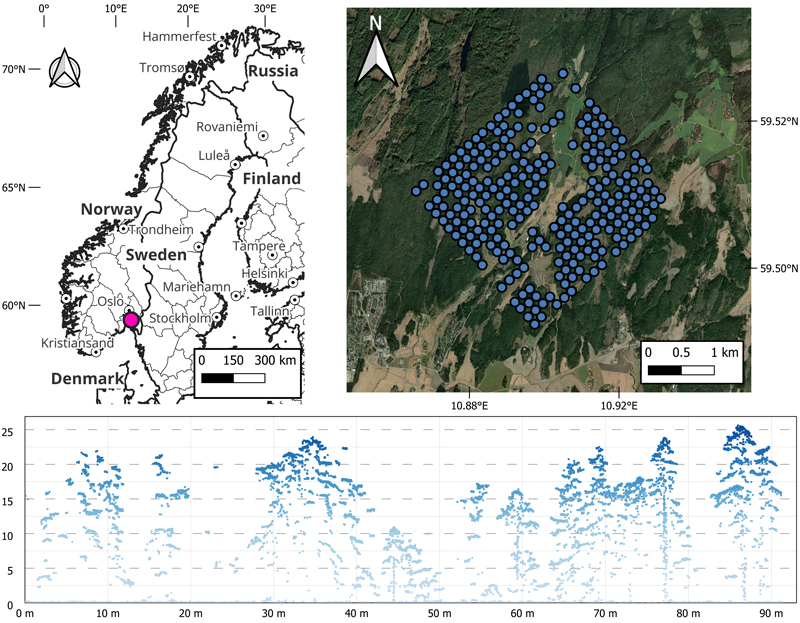
Fig. 1. The location of our study area in pink (Våler municipality) in Norway (top left; made with Natural Earth), a zoomed in view of the 253 plot locations in blue (top right; made with Esri World Imagery), and a circular cross-section of the point cloud obtained from near the perimeter of a single plot coloured by height (bottom; made with own data).
Based on data collected in 2022 from the Rygge – Huggenes weather station (59°24´N, 10°45´E; Norwegian Centre for Climate Services [2026]), the average air temperature of the coldest month was –3.5 °C in January and of the warmest month +17.1 °C in July. Annual precipitation was 782 mm, and the growing season lasted from 25 March to 14 November, accumulating 1721 degree days using a minimum threshold of 5 °C.
2.2 Field measurements
The field data comprised all standing trees (diameter at breast height [DBH] ≥ 4 cm) and their characteristics from 253 plots located within young and mature stands, i.e. with tree heights above 8–9 m. The plots, each covering a circular area of 400 m2, were in a fixed grid and the distance between plots was about 150 m. The field measurements were carried out during the summers of 2022 and 2023. The plots were positioned using a global navigation satellite system, with post-correction to achieve submeter precision. Because the plots were established during different inventory campaigns, the positioning procedures varied. Details for plots established in the original inventory are provided by Næsset (2002), whereas procedures for additional plots established in 2023 are described by Candelas Bielza et al. (2025). The tree characteristics measured were status (dead or living), tree species, DBH, and the position of each tree in the plot with compass direction and distance from the plot centre. Additionally, the heights of, on average, ten sample trees per plot were measured, selected with a probability proportional to stem basal area. These tree heights were measured with a Haglöf Vertex hypsometer. For the remaining trees, heights were predicted using height–DBH models by Vestjordet (1968) and Fitje and Vestjordet (1977), fitted for each plot separately. To improve the agreement between the heights and remotely sensed data, we adjusted the heights based on Näslund-curves (Näslund 1936) fitted to the entire dataset using non-linear regression with exponent 2 for Scots pine and broadleaves and 3 for Norway spruces. Of the final height, 40% was based on Näslund-curves and 60% on the plot-based estimates. This improved the height matching for the tallest trees considerably.
In total, 15 764 standing trees were inventoried: 1672 dead (not considered in this study) and 14 092 living trees. Among the living trees, we found 7990 Norway spruces, 4156 Scots pines, 2632 birches (combined silver and downy birch), 116 European aspens, 25 goat willows, and 348 other broadleaves (mainly rowans and grey alders). The spread of DBH and height values measured per species are shown in Fig. 2 (European aspen) and Supplementary file S1 (other tree species). Tree volumes were calculated using the R package TaperNOR (Hansen et al. 2023) in R, version 4.5.2 (R Core Team 2025) which has models for Scots pine, Norway spruce, and birches. The volumes of all other broadleaves, including European aspen, were calculated using the taper curves fitted for birches, as birches were the only broadleaved species with taxon-specific taper models. The resulting volume estimates for broadleaves other than birches should therefore be regarded as approximations and may be associated with a considerable margin of error, likely larger than the reported RMSE of 19.7% for birches.
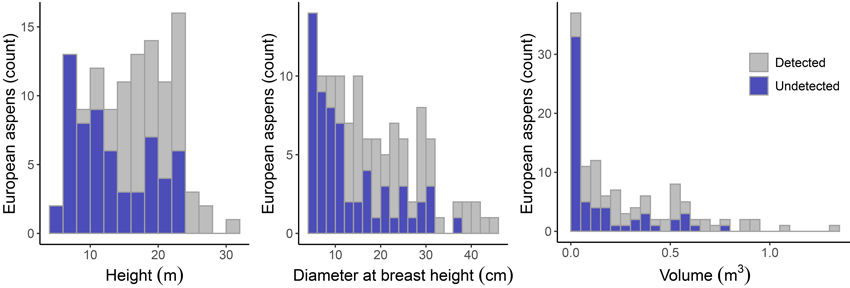
Fig. 2. The number of detected and undetected field-measured European aspens by height (left), diameter at breast height (centre), and volume (right) from our study area in Våler, Norway.
2.3 Remotely sensed data
Two remotely sensed datasets were used, both fully covering the study area: High-point-density ALS data with an average of ca. 250 points m−2 (ca. 145 points m−2 of first of many and single returns) and multispectral imagery with a ground sampling distance of 16.5 cm.
The ALS data were acquired with a fixed-wing Piper PA-31 Navajo and a dual channel RIEGL LMS-VQ-1560II-S laser scanner (RIEGL GmbH) on 8 July 2022 by Field Geospatial AS. Weather conditions during acquisition were generally favourable, with a mean air temperature of approximately 18 °C, no recorded precipitation on the acquisition day, and moderate winds (daily mean 4.3 m s⁻1, maximum hourly mean 7.7 m s⁻1, maximum gust 10.8 m s⁻1). Although 7.6 mm of precipitation was recorded on the preceding day, little precipitation occurred during the three days before that. The flying altitude was 940 m above ground level and data from 18 flight lines were collected with a side overlap of 81%. The half-scan angle was 29°, the swath width was 1053 m, and the pulse repetition frequency was 2000 kHz per channel. The multipulse mode was turned on. In this scanner, the divergence (1 e−2) of the laser beam (λ = 1064 nm) is 0.23 mrad, which leads to a footprint of about 0.19 m. This scanner records multiple returns (echoes) per pulse, which were later categorised as first of many, intermediate, last of many, and single returns.
High-resolution multispectral aerial imagery was collected on the same date and with the same aircraft as the ALS data but in a separate acquisition flying at an altitude of 3500 m above ground level. The images were collected with an UltraCam Osprey 4.1 camera (Vexcel Imaging GmbH) from three flight lines, two of which were parallel with a side overlap of 53% and a forward overlap of 80%, and the third perpendicular to the prior two. The system was equipped with a 49.75 mm focal length lens and a 8760 × 12 840-pixel (6.016 μm × 6.016 μm pixel size) sensor for colour images (red, green, blue, and near-infrared [NIR] bands) and a sensor for panchromatic images, the latter being unused in the current study. The images were not pan sharpened or orthorectified.
2.4 Processing of remotely sensed data
Applying photogrammetric principles described by Packalén et al. (2009), we added spectral information (red, green, blue, and NIR bands) from the unrectified multispectral imagery to the ALS-derived point cloud. This was done through collinearity equations with knowledge of camera locations and orientations at the time of exposure of each image and internal camera parameters. The per-channel digital number for each pixel was averaged across all images in which a 3D point was observed.
Ground hits were identified and classified from the collected ALS data using the progressive triangulated irregular network (TIN) of the TerraScan software (Terrasolid 2024). Heights above the created TIN surface were calculated for all echoes by subtracting the respective TIN heights from their height values. Subsequently, the ALS data were filtered for outliers and noise using the filter_noise-function with default parameters from the R package lidR (Roussel et al. 2020).
2.5 Individual tree detection and matching
Individual trees were segmented from ALS point clouds using instance segmentation with the deep-learning framework ForAINet (Xiang et al. 2024), using the TreeMix version of the model. While primarily fitted for mobile and terrestrial laser scanning data, the segmentation appeared to work without problems based on a visual inspection of the results. The stem was identified using the semantic segmentation of the algorithm. The location of the tree was calculated as the centre point of the stem hits. For some small trees no stem hits were found, and in these cases, the location of the tree was calculated as the centre point of all hits.
Trees were matched using a modified version of the algorithm described by Kostensalo et al. (2023). Pairwise horizontal (XY) and vertical (Z) distances were calculated between all individually detected and field-measured trees within each plot. Candidate matches were filtered and ranked according to distance- and match-quality criteria (Suppl. file S2). To enforce a one-to-one correspondence, the highest-ranked candidate was retained for each field-measured tree and subsequently for each individually detected tree. Thus, each field-measured tree could be matched to at most one individually detected tree and vice versa.
2.6 Feature engineering
Prior to calculating features, we assessed differences in intensity values between the laser scanner’s two channels. After confirming that the differences between them were small and not systematically biased, we applied linear scaling to harmonise both the mean and standard deviation of the second channel to those of the first.
We calculated a total of 98 spectral and ALS-derived tree- and plot-level features (Suppl. file S3). All tree-level features, except those from the “Return patterns” category, were calculated using only returns above two metres to avoid the effect of ground vegetation. The features were calculated using all returns, first of many and single returns, and later returns. Moreover, note that all height percentiles, mean heights, and minimum heights were normalised into relative values by dividing their values by the maximum height of the individual segments. This way the height distribution features retained the information related to crown shape but ensured that tree height did not have an effect in classification, which made the classification models more general (Ørka et al. 2009). The ForAINet framework provided some additional information on whether branches in the segments are dead or alive, from which we calculated some additional tree-level features. Prior to species classification, highly correlated features (Pearson’s r > 0.95) were removed using the findCorrelation-function from the R package caret (Kuhn 2008) to reduce multicollinearity among predictors.
2.7 Species classification
Due to the rarity of European aspen samples in our data, we artificially adjusted our data by applying the synthetic minority oversampling technique (SMOTE; Chawla et al. 2002) with the R package performanceEstimation (Torgo 2014). Rather than arbitrarily selecting the under- and oversampling values, we examined the effect of different values, giving us different ratios of European aspens to non-aspens. This was evaluated using a five-fold tree-level cross-validation with the R package ranger (Wright and Ziegler 2017) at default settings (Boehmke and Greenwell 2019), and the combination yielding the best overall classification performance was selected (Suppl. file S2).
Segments were subsequently classified into European aspens and non-aspens using hyperparameter-tuned random forest (five-fold plot-level cross-validated) and the selected optimum degree of under- and oversampling. To create the five folds, we calculated the European aspen volume in each plot. We then ordered the plots by European aspen volume and repeatedly assigned numbers to the plots in this order from one to five, corresponding to the folds. Hyperparameters were tuned to balance FDR and FNR by selecting the lowest value of FDR2 + FNR2, separately for each fold (Suppl. file S2).
We conducted the species classification twice, once for all trees and once for only canopy-reaching trees, which are defined as trees within four meters from the highest laser echo in each plot. Both classifications used the same optimum degree of under- and oversampling. Finally, we calculated several metrics (Table 1) based on both traditional counts of individual trees but also on the volumes of individual trees. Note that while support vector machines were also tested, random forest outperformed them in this case, consistent with its proven effectiveness for tree species classification (Taher et al. 2026).
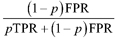
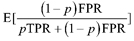
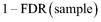
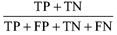
| Table 1. Definitions of the binary classification measures used in this work. The Bayesian estimate of FDRtree (base rate p) is defined using the expected value and estimated by the mean of the distribution obtained directly by simulating samples from the false discovery rate and true positive rate distributions. Note that Cohen’s Kappa is primarily included for illustrative purposes, although its use in low prevalence classification is discouraged (Foody 2020). | ||
| Primary metrics | Frequentist approach | Bayesian approach (Jeffreys prior) |
| FNRtree | ||
| FNRvolume | ||
| FPRtree | ||
| TPRtree | ||
| FDRtree (sample) | ||
| FDRvolume (sample) | ||
| FDRtree (base rate p) | ||
| Secondary metrics | ||
| F1-score | ||
| User’s accuracy | ||
| Producer’s accuracy | ||
| Overall accuracy | ||
| Cohen’s Kappa | ||
| Matthews correlation coefficient | ||
| FDR = False discovery rate, FN = False negative, FNR = False negative rate, FP = False positive, TN = True negative, TP = True positive, and TPR = True positive rate. | ||


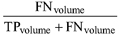


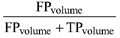




For both classifications, we also conducted variable-importance measures using impurity-based importance scores from the R package ranger to detect the 20 features with the largest role in species separation.
2.8 Estimation
We took a Bayesian approach (Gelman et al. 2013) to the estimation of classification performance. Our main interest lay in parameters related to binary classifications, namely FDR and FNR. We modelled these probabilities using the Beta distribution, which is a conjugate prior for the success probability in Bernoulli trials. Consequently, if the prior distribution is p(θ) = Beta(α,β), then the posterior distribution given the data y is:

where x is the number of successes and n the number of trials. For Bernoulli experiments, the Jeffreys prior, i.e. a non-informative prior distribution which is invariant under change of variables (Jeffreys 1946), is Beta(0.5,0.5), and the corresponding posterior distributions are of the form Beta(0.5 + x,0.5 + n – x). We denote the corresponding cumulative distribution by F(x;α,β).
In frequentist estimation, the 95% confidence interval (C.I.) can be estimated using, for example, the law of large numbers or straightforwardly by bootstrap sampling (Efron and Tibshirani 1994). In the Bayesian approach, an analogous quantity is the 95% posterior credible interval (Cr.I.) which can be calculated in several ways, but here we use the equal-tailed interval given by [F(0.025;α,β),F(0.975;α,β)]. A more typical Bayesian choice would be to use the 80% highest density interval, but we wished to keep a closer connection to frequentist approaches, as we will be re-analysing previous works which did not use a Bayesian approach.
The classification metrics appearing in this work are listed in Table 1. The Bayesian versions of the primary metrics have been calculated with Beta(0.5,0.5) as the prior distribution. For large samples, the Bayesian and frequentist definitions converge. For small samples, the behaviour is more reasonable: for example, given FP = 0and TP = 5, one would estimate FNRtree = 0% (frequentist), and the estimation of the 95% C.I. breaks down. However, with the Bayesian approach, the estimate is FNRtree = 8.3% with 95% Cr.I. [0.0%,37.9%], which reflects the fact that with a sample size of n = 5 we should be relatively unsure about the actual FNR in the population of interest.
For the volume-based approach, the detection probability depends non-trivially on species and volume, and thus we take a non-parametric approach here, opting to use non-parametric bootstrap for interval estimation (Efron and Tibshirani 1994). The secondary metrics are listed for completeness in the results section and are only reported in their usual frequentist form.
2.8.1 Breaking points, FDR, and FNR
In this work, we argue that for rare species detection the two most important metrics are FNR and FDR with an appropriate base rate. These metrics should be balanced to obtain reasonable marginal results, i.e. a representative number of the target species on average in large-area applications.
The base rate at which FDR exceeds 50% was considered the breaking point of the classifier. Below this threshold, a tree (or volume element) classified as the target species is more likely not to belong to the target species than to belong to it. Maps produced in environments where the target-species prevalence falls below this breaking point therefore arguably have insufficient local accuracy. Thus, either the test sample needs to be representative of the target application, or the effects of prevalence differences need to be accounted for using the prevalence-adjustment formulae given in Table 1.
2.9 Systematic literature review and re-analysis
We conducted a systematic literature review to identify peer-reviewed and grey literature studies in which tree species classification with European aspen as one of the classes was conducted in Fennoscandia. Searches were carried out in Web of Science, Google Scholar, and national databases for theses and reports. For these databases, we used the following string of keywords in English and in the relevant native languages: (“European aspen” OR “Populus tremula”) AND (“species classification” OR “species detection”) AND (“remote sensing” OR “lidar”) AND (“boreal” OR “Norway” OR “Finland” OR “Sweden” OR “Fennoscandia”).
Studies were included if they reported clear confusion matrices in which all numbers were reported. Moreover, the data had to have been collected in a proper forest and not an arboretum or urban area. Titles and abstracts were screened for relevance, followed by full-text reviews. Relevant data (comprising remotely sensed data, statistical methodology, study location, and relevant commentary) are presented in Suppl. file S4.
The selected literature was then re-analysed to assess how the produced confusion matrices would perform under the assumption of a 1% prevalence of European aspen in a forest, ignoring height or DBH limitations set by the authors. The FNR and FDR estimations and their posterior credible intervals were based on the Bayesian estimators listed in Table 1.
3 Results
3.1 Tree detection and matching
Of the 14 092 living trees recorded across 253 plots, 5455 were successfully matched to digitally detected trees (39%; 55 European aspens and 5400 other tree species). The detection probabilities by individual trees and by volume for the various species were, respectively: 35% and 64% for Norway spruce, 56% and 77% for Scots pine, 28% and 51% for birches, 47% and 70% for European aspen, 16% and 12% for goat willow, and 16% and 27% for other broadleaves. Despite the high-point-density ALS data which we employed, penetration of the canopy was insufficient to detect a large proportion of the understorey and smaller-sized trees (European aspen: Fig. 2, other tree species: Suppl. file S1). Meanwhile, we encountered 1079 commission error trees, originating mainly from boundary trees and split segments, which were excluded because they could not be reliably matched to field trees. When sub-setting all correctly detected trees to just canopy-reaching trees, we are left with 2007 trees (31 European aspens and 1976 other tree species).
3.2 Optimising European aspen classification
Applying SMOTE at different degrees of over- and undersampling resulted in clearly different classification results (Fig. 3). These results showcase that the degree to which the minority class is balanced against the majority class with SMOTE has considerable implications on classification accuracies. Working with the original unbalanced dataset (55 European aspens to 5400 other species) results in zero detection of European aspen, which warrants the use of SMOTE. To select the optimum degree of SMOTE, the results from random forest with five-fold tree-level cross-validation applied to different degrees of SMOTE were compared by evaluating the F1-score of European aspen, the user’s and producer’s accuracy of European aspen, Cohen’s kappa, and the overall accuracy of each classification. This resulted in an optimum of oversampling by 7 and undersampling by 17, providing a ratio of 0.07 European aspen to other species (440 European aspens to 6545 other species) or in the case of canopy-reaching trees, 248 European aspens to 3689 other species.
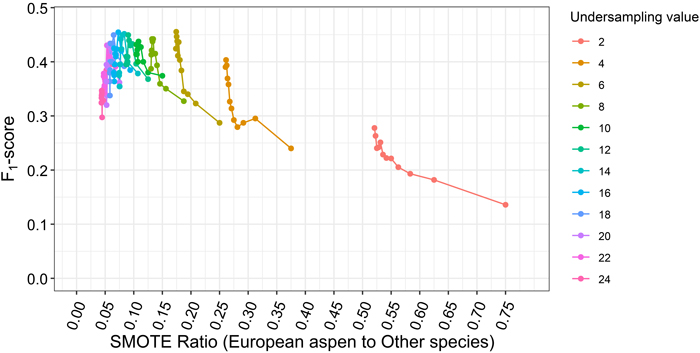
Fig. 3. The effect of different ratios of European aspen to other tree species from our study area in Våler, Norway resulting from synthetic minority oversampling technique (SMOTE) with various degrees of over- and undersampling on the F1-score of European aspens. The over- and undersampling values in this figure ranged from 2 to 24 in steps of 2 (following criteria from the R package performanceEstimation). Oversampling values go from 2 to 24 from right to left for each undersampling value.
In addition to our optimum degree of SMOTE, tuning the hyperparameters of random forest assisted in balancing FDR and FNR. With optimal values of SMOTE and the hyperparameters, our classification of all trees with five-fold plot-level cross-validation resulted in a 32% FDR and 73% FNR for European aspen when predicting individual trees (count-based) and an amended 31% FDR and 54% FNR for European aspen when predicting volumes of trees (volume-based; Table 2). In the count-based approach, the seven other tree species misclassified as European aspen were five birches, one other broadleaf, and one Norway spruce. Classifying only canopy-reaching trees, our classification improved to 21% FDR and 65% FNR (count-based) and 20% FDR and 55% FNR (volume-based). In the count-based approach, the three other tree species misclassified as European aspen were one birch, one other broadleaf, and one Norway spruce. Further standard metrics are shown in Table 3.
| Table 2. Tree-level confusion matrices from random forest with five-fold plot-level cross-validation for all segmented trees and only canopy-reaching trees (trees within four meters from the highest laser echo in each plot). We show count-based and volume-based results (in m3) with 95% posterior credible intervals in parentheses. Results from our study area in Våler, Norway. | |||||
| All trees (count-based) | |||||
| Predicted class | |||||
| European aspen | Other | Sum | FNR | ||
| Observed class | European aspen | 15 | 40 | 55 | 73% (60–83) |
| Other | 7 | 5393 | 5400 | ||
| Sum | 22 | 5433 | |||
| FDR | 32% (16–52) | ||||
| All trees (volume-based) | |||||
| Predicted class | |||||
| European aspen | Other | Sum | FNR | ||
| Observed class | European aspen | 9.5 | 11.1 | 20.6 | 54% (38–71) |
| Other | 4.3 | 1613.6 | 1617.9 | ||
| Sum | 13.8 | 1624.7 | |||
| FDR | 31% (11–51) | ||||
| Canopy-reaching trees (count-based) | |||||
| Predicted class | |||||
| European aspen | Other | Sum | FNR | ||
| Observed class | European aspen | 11 | 20 | 31 | 65% (47–79) |
| Other | 3 | 1973 | 1976 | ||
| Sum | 14 | 1993 | |||
| FDR | 21% (7–46) | ||||
| Canopy-reaching trees (volume-based) | |||||
| Predicted class | |||||
| European aspen | Other | Sum | FNR | ||
| Observed class | European aspen | 7.0 | 8.5 | 15.5 | 55% (35–75) |
| Other | 1.7 | 1048.2 | 1049.9 | ||
| Sum | 8.7 | 1056.7 | |||
| FDR | 20% (0–43) | ||||
| FDR = False discovery rate, FNR = False negative rate. | |||||
| Table 3. Several standard metrics shown from random forest with five-fold plot-level cross-validation for all segmented trees and only canopy-reaching trees (trees within four meters from the highest laser echo in each plot) with count-based and volume-based results from our study area in Våler, Norway. | ||||||
| F1-score European aspen | User’s accuracy European aspen | Producer’s accuracy European aspen | Overall accuracy | Cohen’s Kappa | Matthews correlation coefficient | |
| All trees (count-based) | 0.39 | 0.68 | 0.27 | 0.99 | 0.39 | 0.43 |
| All trees (volume-based) | 0.55 | 0.69 | 0.46 | 0.99 | 0.55 | 0.56 |
| Canopy-reaching trees (count-based) | 0.49 | 0.79 | 0.35 | 0.99 | 0.48 | 0.52 |
| Canopy-reaching trees (volume-based) | 0.58 | 0.80 | 0.45 | 0.99 | 0.57 | 0.60 |
From variable-importance measures (Fig. 4), it is apparent that both spectral and ALS-derived features are important for the classification of both all trees and canopy-reaching trees. Nevertheless, spectral features, particularly those describing the relationship between the NIR band and other bands, were among the highest-ranked variables. From ALS-derived features, both those related to intensity and those related to tree shape (e.g. Hull area proportion) are important.
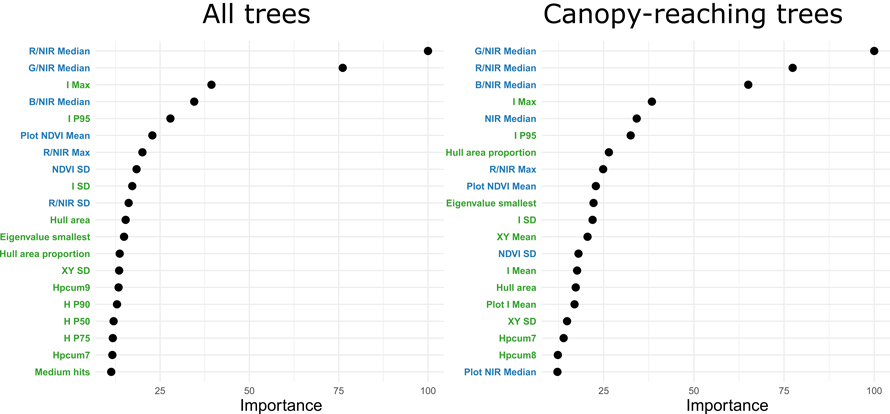
Fig. 4. Variable-importance measures for the 20 best features to separate European aspen from non-aspen species for all trees and only canopy-reaching trees from our study area in Våler, Norway. A green font colour represents ALS-derived features, while a blue font colour represents spectral features. Abbreviations: / = division of two image bands, R = Red, G = Green, B = Blue, NIR = near-infrared, NDVI = normalised difference vegetation index, I = intensity, H = height, P = percentile, SD = standard deviation, XY = XY-plane, f = first and only echoes, pcum = cumulative percentage of returns in the xth layer.
3.3 Re-analysis of tree-level European aspen classification
A total of ten studies were included in our re-analysis, seven of which have been published in scientific journals (Table 4). The remotely sensed data they examined included (full-waveform) ALS data, colour-infrared imagery, (high-resolution) multispectral imagery, and hyperspectral imagery, sometimes in combination (Suppl. file S4). Overall, assuming a base rate of 1%, it is evident that previous studies have struggled with European aspen classification, with either high FDR or high FNR to the benefit of the other, although two studies showed both high FDR and high FNR. Our results fit this pattern, with in our case, a low FDR at the expense of a high FNR, despite our attempt to balance these two. For landscape-level predictions, assuming European aspen base rates of 0.5, 1, and 2%, studies with high FDR overestimate European aspen prevalence with predictions being more accurate at higher base rates (Suppl. file S5). In contrast, studies with high FNR underestimate European aspen prevalence with predictions being more accurate at lower base rates. For local-level predictions, we identified the breaking points at which FDR exceeds 50% from all publications, meaning that a predicted European aspen is more likely to not be an actual European aspen. These breaking points, which ranged from 0.4–9.9%, define the minimum base rates at which the respective constructed models remain effective.
| Table 4. Re-analysis of ten previous publications on tree species classification from remotely sensed data in Fennoscandia where European aspen was included as a class. For comparison, our count-based results from this study are displayed in red but not included in the median and mean calculations. Assuming a 1% base rate (meaning that European aspen represents 1% of all tree species in an area), we display the false negative and false discovery rates (the latter being strongly affected by the selected base rate) of these publications and our results in this study with their 95% posterior credible intervals in parentheses. | ||||||
| Author(s) | N other | N European aspen | European aspen (%) | FNR | FDR (sample) | FDR (1% BR) |
| Erikson 2004 | 777 | 14 | 1.8% | 30% (10–55) | 38% | 52% (31–72) |
| Kulikova et al. 2007 | 34 | 14 | 29% | 17% (3–39) | 14% | 86% (59–96) |
| Ørka et al. 2007 | 203 | 21 | 9% | 75% (55–90) | 44% | 88% (70–97) |
| Viinikka et al. 2020 | 528 | 178 | 25% | 11% (7–16) | 8% | 73% (61–82) |
| Mäyrä et al. 2021 | 448 | 82 | 15% | 13% (6–21) | 6% | 56% (33–73) |
| Kuzmin et al. 2021 | 63 | 28 | 31% | 19% (7–35) | 15% | 88% (73–95) |
| Hardenbol et al. 2021 | 383 | 104 | 21% | 4% (1–9) | 3% | 45% (19–68) |
| Korpela et al. 2022 | 2405 | 167 | 6% | 23% (17–30) | 16% | 57% (47–66) |
| Bjørnbet 2024 | 431 | 48 | 10% | 62% (48–75) | 50% | 91% (86–95) |
| Toivonen et al. 2024 | 33 164 | 31 | 0.1% | 77% (61–89) | 80% | 28% (16–46) |
| Median | 439 | 39 | 8% | 21% | 16% | 65% |
| Mean | 3844 | 69 | 18% | 33% | 27% | 66% |
| This work (all trees) | 5400 | 55 | 1% | 72% (60–83) | 32% | 33% (16–52) |
| This work (canopy-reaching trees) | 1976 | 31 | 1.5% | 65% (47–79) | 21% | 32% (10–57) |
| ALS = Airborne laser scanning, BR = Base rate, CIR = Colour-infrared, FDR = False discovery rate, FNR = False negative rate, HS = Hyperspectral imagery, MS = Multispectral imagery, RS = Remote sensing. | ||||||
4 Discussion
There is a growing global interest in detecting rare tree species using remotely sensed data, primarily for biodiversity monitoring and conservation purposes (Cerrejón et al. 2021; Weinstein et al. 2023). However, accurately classifying rare species remains a widespread challenge (Piiroinen et al. 2018; Erfanifard et al. 2025; Kamińska et al. 2025). Studies typically face a trade-off between using representative samples, which include few individuals of the rare species in question, or applying targeted sampling, resulting in an overrepresentation of the rare species. With representative samples, the usually low sample size of rare tree species necessitates techniques like synthetic over- and undersampling (Toivonen et al. 2024) or tailored analytical approaches (Weinstein et al. 2023). If applying SMOTE, the exact degree of over- and undersampling should be carefully analysed as we show. Most frequently, targeted sampling is employed, as seen in all but one of the re-analysed studies on European aspen, with typically well-balanced tree species proportions (Viinikka et al. 2020; Hardenbol et al. 2021; Mäyrä et al. 2021; Korpela et al. 2022). Classification results from such targeted sampling may seem strong, but as we show in this study, the actual prevalence of rare tree species needs to be considered – particularly when the aim is to apply resulting models beyond their respective sampled datasets. Alternatively, base rate fallacies whereby rare tree species are overestimated will occur. In general, previous studies on European aspen detection have resulted in suboptimal classifiers where the balance between FDR and FNR has been ignored.
Accounting for actual base rates reveals that previous studies, in this case on European aspen, have often presented overly optimistic results. This highlights a limitation of confusion matrices, which can give the impression of better model performance than is warranted and are frequently interpreted at face value by readers (Plevris 2025). Beyond the issue of base rate neglect, confusion matrices typically overlook omission and commission errors, and rarely report confidence intervals or posterior credible intervals, complicating model performance comparisons between studies (Caelen 2017; Tötsch and Hoffmann 2021; Lovell et al. 2023). In the case of European aspen, many earlier studies should therefore be regarded primarily as feasibility assessments rather than demonstrations of readiness for large-area mapping. While our own results are not necessarily superior to those of previous studies on European aspen, we present them in a manner that allows their evaluation for large-area application by explicitly accounting for base rates and uncertainties in model performance. It should be noted, that with some studies like Kulikova et al. (2007) the sample sizes have been so small that even a perfect confusion matrix would not have guaranteed an FDR below 50% with 95% probability if the base rate is approximately 1%. It is not so much the small number of European aspens (n = 14) but the small number of non-aspens (n = 34) which is the issue here.
To map rare species over large areas, one should consider both tree- and landscape-level accuracy. For tree-level accuracy, the primary aim should be to get FDR as low as possible, while balancing it with FNR. If FDR exceeds 50%, then local accuracy breaks down, and trees classified as “the rare species X” are more likely to not be species X than to be species X. On the landscape level, with proper balancing of FDR and FNR, the results are, on average, unbiased. A higher FDR will result in too many detected trees of species X while a higher FNR in too few. Large sample sizes, especially of the dominant species, are needed to pin down the population FDR and FNR values to ensure this balance. Specifically for European aspen, we find that their accurate classification is suffering from either high FDR or FNR across this work and previous studies, which complicate real-world application. Considering the relatively low FDR, FNR, and breaking point values (Suppl. file S5), the most successful studies have utilised full-waveform ALS data (Korpela et al. 2022), ALS data plus hyperspectral imagery (Mäyrä et al. 2021), and multispectral drone imagery obtained in spring (Hardenbol et al. 2021), if we ignore manual species interpretation (Erikson 2004). As such, these studies do not severely over- or underestimate European aspen presence, although we would argue that further improvement is still necessary for real-world application.
To improve European aspen detection, we propose that, besides solely reporting count-based confusion matrices as all previous studies have done, studies should report volume-based confusion matrices that contain the summed volumes of individual trees rather than their summed counts in each part of the matrix. This change of focus may be ecologically prudent due to the importance of large European aspens for biodiversity (Kuusinen and Penttinen 1999; Tikkanen et al. 2006). The count-based results may also give overly pessimistic results, as smaller trees are generally much more difficult to classify. In recognition of this, previous studies have often limited their analyses to trees above a certain diameter (Toivonen et al. 2024) or canopy-reaching trees (Hardenbol et al. 2021). This, however, means that we are not capturing all European aspens, and the detection of smaller trees of 5–15 cm in DBH could be valuable in, for example, old-growth forests where we find a severe lack of recruitment (Hardenbol et al. 2020). This could possibly be resolved by using resampling methods as well as the different detection rates between tree species (Kostensalo et al. 2026). Additionally, data collection could consider the use of phenological phases that occur only temporarily every year (Hardenbol et al. 2021), possibly using bi-temporal data (Liang et al. 2025). Moreover, instead of attempting to map rare tree species, including European aspen, across large areas indiscriminately, the classification accuracy of rare tree species could benefit from stratified sampling and habitat suitability considerations in connection with breaking points and spectral mixing. Specifically, stratified sampling would pertain to stand types where the base rates of tree species, including those of rare species, varies considerably (Erfanifard et al. 2025). European aspen, for example, is typically rarer in Scots pine-dominated forests with dry soil types (Esseen et al. 1997). Between stand types, classification accuracy is expected to rise or fall due to the presence or absence of certain species. For European aspen, this could be due to variation in the number of birches, with which it is easily mixed (Hovi et al. 2017). Importantly, the usefulness of volume-based confusion matrices depends less on the absolute accuracy of individual tree volume estimates than on their ability to preserve relative differences in tree size; thus, moderate random or scaling errors are unlikely to affect interpretation, whereas strong size-dependent biases could reduce their informativeness.
For forest biodiversity estimation purposes, direct mapping of tree species from remotely sensed data remains a contentious approach due to our limited capabilities to separate multiple species (Fassnacht et al. 2016, 2024), especially in species-rich places (Feret and Asner 2013). If our interest lies purely in estimating tree species diversity in an area – as a measure of general forest biodiversity – then approaches based on, for example, the spectral variability (Fassnacht et al. 2022) or height variation (Torresani et al. 2020) hypotheses are likely preferred in many instances. However, the ability to directly map certain tree species as in this study remains important for species that are considered keystone species, support vulnerable ecosystem functions, or face a risk of extinction, among other things. With considerations for rare tree species mapping laid out in this study, we encourage further attempts at direct mapping of tree species, albeit with a vision towards real-world application. Resulting maps could then be used for a variety of purposes, such as population (health) monitoring, habitat suitability mapping, invasive species management, and protected area establishment.
Acknowledgements
We thank Borja García Pascual for his help with using ForAINet.
Data availability
The research data and computational codes used, albeit without the full point clouds and the actual coordinates (i.e. raw data), were uploaded to Zenodo: https://doi.org/10.5281/zenodo.22736953. No preregistration of either the study or the analysis plan took place.
Authors’ contributions
Alwin A. Hardenbol: Conceptualisation, Data curation, Formal analysis, Methodology, Validation, Visualisation, Writing – Original Draft, Writing – Review & Editing.
Hans Ole Ørka: Funding acquisition, Investigation, Project administration, Resources, Writing – Review & Editing.
Terje Gobakken: Funding acquisition, Investigation, Project administration, Resources, Writing – Review & Editing.
Joel Kostensalo: Conceptualisation, Data curation, Formal analysis, Funding acquisition, Methodology, Project administration, Supervision, Validation, Visualisation, Writing – Original Draft, Writing – Review & Editing.
Funding
This research was funded by the Research Council of Finland (Grant number 361209) and the Center for Research-based Innovation, SmartForest: Bringing Industry 4.0 to the Norwegian forest sector (NFR SFI project no. 309671, smartforest.no).
References
Artsdatabanken (2021) Norsk rødliste for arter 2021. [Norwegian red list of species 2021]. Artsdatabanken, Trondheim, Norway.
Bjørnbet JEV (2024) Identifisering og beskrivelse av livsløpstrær med flybåren laserskanning. [Identification and characterization of retention trees with airborne laser scanning]. Master’s thesis. Norwegian University of Life Sciences, Oslo, Norway. https://hdl.handle.net/11250/3148307.
Boehmke B, Greenwell BM (2019) Hands-on machine learning with R, 1st edition. Chapman and Hall/CRC, New York. https://doi.org/10.1201/9780367816377.
Boonman CCF, Serra-Diaz JM, Hoeks S, Guo W-Y, Enquist BJ, Maitner B, Malhi Y, Merow C, Buitenwerf R, Svenning J-C (2024) More than 17,000 tree species are at risk from rapid global change. Nat Commun 15, article id 166. https://doi.org/10.1038/s41467-023-44321-9.
Caelen O (2017) A Bayesian interpretation of the confusion matrix. Ann Math Artif Intell 81: 429–450. https://doi.org/10.1007/s10472-017-9564-8.
Candelas Bielza J, Noordermeer L, Næsset E, Gobakken T, Moan MÅ, Ørka HO (2025) Assessing the effects of uncertainty in remote sensing-based predictions of tree species composition and site index on net present value calculations. Forestry 99, article id cpaf057. https://doi.org/10.1093/forestry/cpaf057.
Cazzolla Gatti R, Reich PB, Gamarra JGP, Crowther T, Hui C, Morera A, Bastin J-F, de-Miguel S, Nabuurs G-J, Svenning J-C, Serra-Diaz JM, Merow C, Enquist B, Kamenetsky M, Lee J, Zhu J, Fang J, Jacobs DF, Pijanowski B, Banerjee A, Giaquinto RA, Alberti G, Almeyda Zambrano AM, Alvarez-Davila E, Araujo-Murakami A, Avitabile V, Aymard GA, Balazy R, Baraloto C, Barroso JG, Bastian ML, Birnbaum P, Bitariho R, Bogaert J, Bongers F, Bouriaud O, Brancalion PHS, Brearley FQ, Broadbent EN, Bussotti F, Castro Da Silva W, César RG, Češljar G, Chama Moscoso V, Chen HYH, Cienciala E, Clark CJ, Coomes DA, Dayanandan S, Decuyper M, Dee LE, Del Aguila Pasquel J, Derroire G, Djuikouo MNK, Van Do T, Dolezal J, Đorđević IĐ, Engel J, Fayle TM, Feldpausch TR, Fridman JK, Harris DJ, Hemp A, Hengeveld G, Herault B, Herold M, Ibanez T, Jagodzinski AM, Jaroszewicz B, Jeffery KJ, Johannsen VK, Jucker T, Kangur A, Karminov VN, Kartawinata K, Kennard DK, Kepfer-Rojas S, Keppel G, Khan ML, Khare PK, Kileen TJ, Kim HS, Korjus H, Kumar Amit, Kumar Ashwani, Laarmann D, Labrière N, Lang M, Lewis SL, Lukina N, Maitner BS, Malhi Y, Marshall AR, Martynenko OV, Monteagudo Mendoza AL, Ontikov PV, Ortiz-Malavasi E, Pallqui Camacho NC, Paquette A, Park M, Parthasarathy N, Peri PL, Petronelli P, Pfautsch S, Phillips OL, Picard N, Piotto D, Poorter L, Poulsen JR, Pretzsch H, Ramírez-Angulo H, Restrepo Correa Z, Rodeghiero M, Rojas Gonzáles RDP, Rolim SG, Rovero F, Rutishauser E, Saikia P, Salas-Eljatib C, Schepaschenko D, Scherer-Lorenzen M, Šebeň V, Silveira M, Slik F, Sonké B, Souza AF, Stereńczak KJ, Svoboda M, Taedoumg H, Tchebakova N, Terborgh J, Tikhonova E, Torres-Lezama A, van der Plas F, Vásquez R, Viana H, Vibrans AC, Vilanova E, Vos VA, Wang H-F, Westerlund B, White LJT, Wiser SK, Zawiła-Niedźwiecki T, Zemagho L, Zhu Z-X, Zo-Bi IC, Liang J (2022) The number of tree species on Earth. Proc Natl Acad Sci USA 119, article id e2115329119. https://doi.org/10.1073/pnas.2115329119.
Cerrejón C, Valeria O, Marchand P, Caners RT, Fenton NJ (2021) No place to hide: rare plant detection through remote sensing. Divers Distrib 27: 948–961. https://doi.org/10.1111/ddi.13244.
Chawla NV, Bowyer KW, Hall LO, Kegelmeyer WP (2002) SMOTE: synthetic minority over-sampling technique. J Artif Intell Res 16: 321–357. https://doi.org/10.1613/jair.953.
Draper FC, Costa FRC, Arellano G, Phillips OL, Duque A, Macía MJ, ter Steege H, Asner GP, Berenguer E, Schietti J, Socolar JB, de Souza FC, Dexter KG, Jørgensen PM, Tello JS, Magnusson WE, Baker TR, Castilho CV, Monteagudo-Mendoza A, Fine PVA, Ruokolainen K, Coronado ENH, Aymard G, Dávila N, Sáenz MS, Paredes MAR, Engel J, Fortunel C, Paine CET, Goret J-Y, Dourdain A, Petronelli P, Allie E, Andino JEG, Brienen RJW, Pérez LC, Manzatto ÂG, Zambrana NYP, Molino J-F, Sabatier D, Chave J, Fauset S, Villacorta RG, Réjou-Méchain M, Berry PE, Melgaço K, Feldpausch TR, Sandoval EV, Martinez RV, Mesones I, Junqueira AB, Roucoux KH, de Toledo JJ, Andrade AC, Camargo JL, del Aguila Pasquel J, Santana FD, Laurance WF, Laurance SG, Lovejoy TE, Comiskey JA, Galbraith DR, Kalamandeen M, Aguilar GEN, Arenas JV, Guerra CAA, Flores M, Llampazo GF, Montenegro LAT, Gomez RZ, Pansonato MP, Moscoso VC, Vleminckx J, Barrantes OJV, Duivenvoorden JF, de Sousa SA, Arroyo L, Perdiz RO, Cravo JS, Marimon BS, Junior BHM, Carvalho FA, Damasco G, Disney M, Vital MS, Diaz PRS, Vicentini A, Nascimento H, Higuchi N, van Andel T, Malhi Y, Ribeiro SC, Terborgh JW, Thomas RS, Dallmeier F, Prieto A, Hilário RR, Salomão RP, da Costa Silva R, Casas LF, Vieira ICG, Araujo-Murakami A, Arevalo FR, Ramírez-Angulo H, Torre EV, Peñuela MC, Killeen TJ, Pardo G, Jimenez-Rojas E, Castro W, Cabrera DG, Pipoly J, de Sousa TR, Silvera M, Vos V, Neill D, Vargas PN, Vela DM, Aragão LEOC, Umetsu RK, Sierra R, Wang O, Young KR, Prestes NCCS, Massi KG, Huaymacari JR, Gutierrez GAP, Aldana AM, Alexiades MN, Baccaro F, Céron C, Muelbert AE, Rios JMG, Lima AS, Lloyd JL, Pitman NCA, Gamarra LV, Oroche CJC, Fuentes AF, Palacios W, Patiño S, Torres-Lezama A, Baraloto C (2021) Amazon tree dominance across forest strata. Nat Ecol Evol 5: 757–767. https://doi.org/10.1038/s41559-021-01418-y.
Efron B, Tibshirani RJ (1994) An introduction to the bootstrap, 1st edition. Chapman and Hall/CRC, New York. https://doi.org/10.1201/9780429246593.
Emrich D, Kaufmann S, Hauck M (2025) Selecting dominant or rare tree species as habitat trees: consequences for epiphyte diversity in temperate mountain forests. Trees For People 20, article id 100807. https://doi.org/10.1016/j.tfp.2025.100807.
Erfanifard Y, Kraszewski B, Lisiewicz M, Mielcarek M, Czerepko J, Kuberski L, Stereńczak K (2025) A new lens on biodiversity assessment: the reliability of high-resolution remote sensing in investigating tree species diversity in old-growth forests. For Ecol Manage 595, article id 122987. https://doi.org/10.1016/j.foreco.2025.122987.
Erikson M (2004) Species classification of individually segmented tree crowns in high-resolution aerial images using radiometric and morphologic image measures. Remote Sens Environ 91: 469–477. https://doi.org/10.1016/j.rse.2004.04.006.
Esseen P-A, Ehnström B, Ericson L, Sjöberg K (1997) Boreal forests. Ecol Bull 46: 16–47.
FAO (2024) The State of the World’s Forests 2024. Forest-sector innovations towards a more sustainable future. FAO, Rome. ISBN 978-92-5-138867-9.
Fassnacht FE, Latifi H, Stereńczak K, Modzelewska A, Lefsky M, Waser LT, Straub C, Ghosh A (2016) Review of studies on tree species classification from remotely sensed data. Remote Sens Environ 186: 64–87. https://doi.org/10.1016/j.rse.2016.08.013.
Fassnacht FE, Müllerová J, Conti L, Malavasi M, Schmidtlein S (2022) About the link between biodiversity and spectral variation. Appl Veg Sci 25, article id e12643. https://doi.org/10.1111/avsc.12643.
Fassnacht FE, White JC, Wulder MA, Næsset E (2024) Remote sensing in forestry: current challenges, considerations and directions. Forestry 97: 11–37. https://doi.org/10.1093/forestry/cpad024.
Feret J-B, Asner GP (2013) Tree species discrimination in tropical forests using airborne imaging spectroscopy. IEEE Trans Geosci Remote Sens 51: 73–84. https://doi.org/10.1109/TGRS.2012.2199323.
Fitje A, Vestjordet E (1977) Stand height curves and new tariff tables for Norway spruce. Medd Norsk Inst Skogforsk 34: 23–68.
Foody GM (2020) Explaining the unsuitability of the kappa coefficient in the assessment and comparison of the accuracy of thematic maps obtained by image classification. Remote Sens Environ 239, article id 111630. https://doi.org/10.1016/j.rse.2019.111630.
Gelman A, Carlin JB, Stern HS, Dunson DB, Vehtari A, Rubin DB (2013) Bayesian data analysis, 3rd edition. Chapman and Hall/CRC, New York. https://doi.org/10.1201/b16018.
Guo W-Y, Serra-Diaz JM, Schrodt F, Eiserhardt WL, Maitner BS, Merow C, Violle C, Anand M, Belluau M, Bruun HH, Byun C, Catford JA, Cerabolini BEL, Chacón-Madrigal E, Ciccarelli D, Cornelissen JHC, Dang-Le AT, de Frutos A, Dias AS, Giroldo AB, Guo K, Gutiérrez AG, Hattingh W, He T, Hietz P, Hough-Snee N, Jansen S, Kattge J, Klein T, Komac B, Kraft NJB, Kramer K, Lavorel S, Lusk CH, Martin AR, Mencuccini M, Michaletz ST, Minden V, Mori AS, Niinemets Ü, Onoda Y, Peñuelas J, Pillar VD, Pisek J, Robroek BJM, Schamp B, Slot M, Sosinski ÊE, Soudzilovskaia NA, Thiffault N, van Bodegom P, van der Plas F, Wright IJ, Xu W-B, Zheng J, Enquist BJ, Svenning J-C (2022) High exposure of global tree diversity to human pressure. Proc Natl Acad Sci USA 119, article id e2026733119. https://doi.org/10.1073/pnas.2026733119.
Hansen E, Rahlf J, Astrup R, Gobakken T (2023) Taper, volume, and bark thickness models for spruce, pine, and birch in Norway. Scand J For Res 38: 413–428. https://doi.org/10.1080/02827581.2023.2243821.
Hardenbol AA, Junninen K, Kouki J (2020) A key tree species for forest biodiversity, European aspen (Populus tremula), is rapidly declining in boreal old-growth forest reserves. For Ecol Manage 462, article id 118009. https://doi.org/10.1016/j.foreco.2020.118009.
Hardenbol AA, Kuzmin A, Korhonen L, Korpelainen P, Kumpula T, Maltamo M, Kouki J (2021) Detection of aspen in conifer-dominated boreal forests with seasonal multispectral drone image point clouds. Silva Fenn 55, article id 10515. https://doi.org/10.14214/sf.10515.
Hovi A, Raitio P, Rautiainen M (2017) A spectral analysis of 25 boreal tree species. Silva Fenn 51, article id 7753. https://doi.org/10.14214/sf.7753.
Hyvärinen E, Juslén A, Kemppainen E, Uddström A, Liukko U-M (2019) Suomen lajien uhanalaisuus : Punainen kirja 2019. [The 2019 Red List of Finnish species]. Ympäristöministeriö and Suomen ympäristökeskus, Helsinki, Finland. http://hdl.handle.net/10138/299501.
Jeffreys H (1946) An invariant form for the prior probability in estimation problems. Proc R Soc London, Ser A 186: 453–461. https://doi.org/10.1098/rspa.1946.0056.
Jenkins MB, Schoettle AW, Wright JW, Anderson KA, Fortier J, Hoang L, Incashola Jr T, Keane RE, Krakowski J, LaFleur DM, Mellmann-Brown S, Meyer ED, Pete S, Renwick K, Sissons RA (2022) Restoring a forest keystone species: a plan for the restoration of whitebark pine (Pinus albicaulis Engelm.) in the crown of the continent ecosystem. For Ecol Manage 522, article id 120282. https://doi.org/10.1016/j.foreco.2022.120282.
Kamińska A, Lisiewicz M, Kraszewski B, Tkaczyk M, Stereńczak K, Wysocka-Fijorek E (2025) Assessing ash (Fraxinus excelsior L.) dieback dynamics in the Białowieża forest, Poland, using bi-temporal high-resolution remote sensing data. Forests 16, article id 506. https://doi.org/10.3390/f16030506.
Kivinen S, Koivisto E, Keski-Saari S, Poikolainen L, Tanhuanpää T, Kuzmin A, Viinikka A, Heikkinen RK, Pykälä J, Virkkala R, Vihervaara P, Kumpula T (2020) A keystone species, European aspen (Populus tremula L.), in boreal forests: ecological role, knowledge needs and mapping using remote sensing. For Ecol Manage 462, article id 118008. https://doi.org/10.1016/j.foreco.2020.118008.
Korpela I, Polvivaara A, Papunen S, Jaakkola L, Tienaho N, Uotila J, Puputti T, Flyktman A (2022) Airborne dual-wavelength waveform LiDAR improves species classification accuracy of boreal broadleaved and coniferous trees. Silva Fenn 56, article id 22007. https://doi.org/10.14214/sf.22007.
Kostensalo J, Mehtätalo L, Tuominen S, Packalen P, Myllymäki M (2023) Recreating structurally realistic tree maps with airborne laser scanning and ground measurements. Remote Sens Environ 298, article id 113782. https://doi.org/10.1016/j.rse.2023.113782.
Kostensalo J, Packalen P, Kuronen M, Mehtätalo L, Tuominen S, Myllymäki M (2026) Large-scale tree-level mapping of forest structure including species type with remote sensing data and ground measurements. Remote Sens Environ 334, article id 115223. https://doi.org/10.1016/j.rse.2025.115223.
Kouki J, Arnold K, Martikainen P (2004) Long-term persistence of aspen – a key host for many threatened species – is endangered in old-growth conservation areas in Finland. J Nat Conserv 12: 41–52. https://doi.org/10.1016/j.jnc.2003.08.002.
Kuhn M (2008) Building predictive models in R using the caret package. J Stat Softw 28: 1–26. https://doi.org/10.18637/jss.v028.i05.
Kulikova MS, Mani M, Srivastava A, Descombes X, Zerubia J (2007) Tree species classification using radiometry, texture and shape based features. Proceedings of the 15th European Signal Processing Conference, IEEE, Poznan, Poland, pp 1595–1599.
Kuusinen M, Penttinen A (1999) Spatial pattern of the threatened epiphytic bryophyte Neckera pennata at two scales in a fragmented boreal forest. Ecography 22: 729–735. https://doi.org/10.1111/j.1600-0587.1999.tb00522.x.
Kuzmin A, Korhonen L, Kivinen S, Hurskainen P, Korpelainen P, Tanhuanpää T, Maltamo M, Vihervaara P, Kumpula T (2021) Detection of European aspen (Populus tremula L.) based on an unmanned aerial vehicle approach in boreal forests. Remote Sens 13, article id 1723. https://doi.org/10.3390/rs13091723.
Leidinger J, Blaschke M, Ehrhardt M, Fischer A, Gossner MM, Jung K, Kienlein S, Kózak J, Michler B, Mosandl R, Seibold S, Wehner K, Weisser WW (2021) Shifting tree species composition affects biodiversity of multiple taxa in Central European forests. For Ecol Manage 498, article id 119552. https://doi.org/10.1016/j.foreco.2021.119552.
Liang X, Chen J, Gong W, Puttonen E, Wang Y (2025) Influence of data and methods on high-resolution imagery-based tree species recognition considering phenology: the case of temperate forests. Remote Sens Environ 323, article id 114654. https://doi.org/10.1016/j.rse.2025.114654.
Lovell D, Miller D, Capra J, Bradley AP (2023) Never mind the metrics—what about the uncertainty? Visualising binary confusion matrix metric distributions to put performance in perspective. In: Krause A, Brunskill E, Cho K, Engelhardt B, Sabato S, Scarlett J (eds) Proceedings of the 40th International Conference on Machine Learning Research, Honolulu, USA, 23–29 July 2023, pp 22702–22757. https://proceedings.mlr.press/v202/. Accessed 21 July 2025.
Mäyrä J, Keski-Saari S, Kivinen S, Tanhuanpää T, Hurskainen P, Kullberg P, Poikolainen L, Viinikka A, Tuominen S, Kumpula T, Vihervaara P (2021) Tree species classification from airborne hyperspectral and LiDAR data using 3D convolutional neural networks. Remote Sens Environ 256, article id 112322. https://doi.org/10.1016/j.rse.2021.112322.
Mills LS, Soulé ME, Doak DF (1993) The keystone-species concept in ecology and conservation. BioScience 43: 219–224. https://doi.org/10.2307/1312122.
Missouri Botanical Garden (2026) https://www.tropicos.org. Accessed 26 January 2026.
Mitchell RJ, Bellamy PE, Broome A, Ellis CJ, Hewison RL, Iason GR, Littlewood NA, Newey S, Pozsgai G, Ray D, Stockan JA, Stokes V, Taylor AFS (2022) Cumulative impact assessments of multiple host species loss from plant diseases show disproportionate reductions in associated biodiversity. J Ecol 110: 221–231. https://doi.org/10.1111/1365-2745.13798.
Moen A, Lillethun A (1998) Nasjonalatlas for Norge: Vegetasjon. [National Atlas of Norway: vegetation]. Statens kartverk.
Mouillot D, Bellwood DR, Baraloto C, Chave J, Galzin R, Harmelin-Vivien M, Kulbicki M, Lavergne S, Lavorel S, Mouquet N, Paine CET, Renaud J, Thuiller W (2013) Rare species support vulnerable functions in high-diversity ecosystems. PLoS Biol 11, article id e1001569. https://doi.org/10.1371/journal.pbio.1001569.
Næsset E (2002) Predicting forest stand characteristics with airborne scanning laser using a practical two-stage procedure and field data. Remote Sens Environ 80: 88–99. https://doi.org/10.1016/S0034-4257(01)00290-5.
Näslund M (1936) Skogsförsöksanstaltens gallringsförsök i tallskog. [The Forest Research Institute’s thinning experiment in a pine forest]. Medd Statens Skogsförsöksanst 29. https://res.slu.se/id/publ/124955.
Norwegian Centre for Climate Services (2026) https://seklima.met.no/observations/. Accessed 3 January 2026.
Ørka H, Næsset E, Bollandsås O (2007) Utilizing airborne laser intensity for tree species classification. ISPRS Archives XXXVI-3/W52. Proceedings of the ISPRS Workshop on Laser Scanning 2007 and SilviLaser 2007, Espoo, Finland, pp 300–304.
Ørka HO, Næsset E, Bollandsås OM (2009) Classifying species of individual trees by intensity and structure features derived from airborne laser scanner data. Remote Sens Environ 113: 1163–1174. https://doi.org/10.1016/j.rse.2009.02.002.
Packalén P, Suvanto A, Maltamo M (2009) A two stage method to estimate species-specific growing stock. Photogramm Eng Remote Sens 75: 1451–1460. https://doi.org/10.14358/PERS.75.12.1451.
Piiroinen R, Fassnacht FE, Heiskanen J, Maeda E, Mack B, Pellikka P (2018) Invasive tree species detection in the Eastern Arc Mountains biodiversity hotspot using one class classification. Remote Sens Environ 218: 119–131. https://doi.org/10.1016/j.rse.2018.09.018.
Plevris V (2025) Assessing uncertainty in image-based monitoring: addressing false positives, false negatives, and base rate bias in structural health evaluation. Stochastic Environ Res Risk Assess 39: 959–972. https://doi.org/10.1007/s00477-024-02898-7.
R Core Team (2025). R: a language and environment for statistical computing. R Foundation for Statistical Computing, Vienna, Austria. https://www.r-project.org.
Roussel J-R, Auty D, Coops NC, Tompalski P, Goodbody TRH, Meador AS, Bourdon J-F, de Boissieu F, Achim A (2020) lidR: an R package for analysis of airborne laser scanning (ALS) data. Remote Sens Environ 251, article id 112061. https://doi.org/10.1016/j.rse.2020.112061.
Säynäjoki R, Packalén P, Maltamo M, Vehmas M, Eerikäinen K (2008) Detection of aspens using high resolution aerial laser scanning data and digital aerial images. Sensors 8: 5037–5054. https://doi.org/10.3390/s8085037.
SLU Artdatabanken (2020) Rödlistade arter i Sverige 2020. [Red-listed species in Sweden 2020]. Swedish University of Agricultural Sciences, Uppsala, Sweden. https://res.slu.se/id/publ/143242.
Taher J, Hyyppä E, Hyyppä M, Salolahti K, Yu X, Matikainen L, Kukko A, Lehtomäki M, Kaartinen H, Thurachen S, Litkey P, Luoma V, Holopainen M, Kong G, Fan H, Rönnholm P, Vaaja M, Polvivaara A, Junttila S, Vastaranta M, Puliti S, Astrup R, Kostensalo J, Myllymäki M, Kulicki M, Stereńczak K, de Paula Pires R, Valbuena R, Carbonell-Rivera JP, Torralba J, Chen Y-C, Winiwarter L, Hollaus M, Mandlburger G, Takhtkeshha N, Remondino F, Lisiewicz M, Kraszewski B, Liang X, Chen J, Ahokas E, Karila K, Vezeteu E, Manninen P, Näsi R, Hyyti H, Pyykkönen S, Hu P, Hyyppä J (2026) Multispectral airborne laser scanning for tree species classification: a benchmark of machine learning and deep learning algorithms. ISPRS J Photogramm Remote Sens 233: 278–309. https://doi.org/10.1016/j.isprsjprs.2026.01.031.
Terrasolid (2024) TerraScan user guide. Ground. https://terrasolid.com/guides/tscan/crground.html. Accessed 20 May 2025.
Tikkanen O-P, Martikainen P, Hyvärinen E, Junninen K, Kouki J (2006) Red-listed boreal forest species of Finland: associations with forest structure, tree species, and decaying wood. Ann Zool Fenn 43: 373–383.
Toivonen J, Kangas A, Maltamo M, Kukkonen M, Packalen P (2024) Mapping large European aspen (Populus tremula L.) in Finland using airborne lidar and image data. Can J For Res 54: 762–773. https://doi.org/10.1139/cjfr-2023-0271.
Torgo L (2014) An infra-structure for performance estimation and experimental comparison of predictive models in R. arXiv preprint. https://doi.org/10.48550/arXiv.1412.0436.
Torresani M, Rocchini D, Sonnenschein R, Zebisch M, Hauffe HC, Heym M, Pretzsch H, Tonon G (2020) Height variation hypothesis: a new approach for estimating forest species diversity with CHM LiDAR data. Ecol Indic 117, article id 106520. https://doi.org/10.1016/j.ecolind.2020.106520.
Tötsch N, Hoffmann D (2021) Classifier uncertainty: evidence, potential impact, and probabilistic treatment. PeerJ Comput Sci 7, article id e398. https://doi.org/10.7717/peerj-cs.398.
Vestjordet E (1968) Volum av nyttbart virke hos gran og furu basert på relativ høyde og diameter i brysthøyde eller ved 2,5 m fra stubbeavskjær. [Merchantable volume of Norway spruce and Scots pine based on relative height and diameter at breast height or 2.5 m above stump level]. Medd Norske Skogforsøksvesen 25: 411–459.
Viinikka A, Hurskainen P, Keski-Saari S, Kivinen S, Tanhuanpää T, Mäyrä J, Poikolainen L, Vihervaara P, Kumpula T (2020) Detecting European aspen (Populus tremula L.) in boreal forests using airborne hyperspectral and airborne laser scanning data. Remote Sens 12, article id 2610. https://doi.org/10.3390/rs12162610.
Weinstein BG, Marconi S, Graves SJ, Zare A, Singh A, Bohlman SA, Magee L, Johnson DJ, Townsend PA, White EP (2023) Capturing long-tailed individual tree diversity using an airborne imaging and a multi-temporal hierarchical model. Remote Sens Ecol Conserv 9: 656–670. https://doi.org/10.1002/rse2.335.
Wright MN, Ziegler A (2017) ranger: a fast implementation of random forests for high dimensional data in C++ and R. J Stat Softw 77: 1–17. https://doi.org/10.18637/jss.v077.i01.
Xiang B, Wielgosz M, Kontogianni T, Peters T, Puliti S, Astrup R, Schindler K (2024) Automated forest inventory: analysis of high-density airborne LiDAR point clouds with 3D deep learning. Remote Sens Environ 305, article id 114078. https://doi.org/10.1016/j.rse.2024.114078.
Total of 74 references.

