Dominik Bayer  ,
Hans Pretzsch
,
Hans Pretzsch
Reactions to gap emergence: Norway spruce increases growth while European beech features horizontal space occupation – evidence by repeated 3D TLS measurements
Bayer D., Pretzsch H. (2017). Reactions to gap emergence: Norway spruce increases growth while European beech features horizontal space occupation – evidence by repeated 3D TLS measurements. Silva Fennica vol. 51 no. 5 article id 7748. https://doi.org/10.14214/sf.7748
Highlights
- Analysis of the closure dynamics of a Norway spruce, a European beech and a mixed forest gap by repeated TLS measurements
- Norway spruce allocated additional resources predominantly into DBH growth and displayed stronger resilience against mechanical crown damage
- European beech allocated resources towards space occupation and displayed higher crown plasticity
- Species mixture had no significant effect.
Abstract
The reach of different tree species’ crowns and the velocity of gap closure during the occupation of canopy gaps resulting from mortality and thinning during stand development determine species-specific competition and productivity within forest stands. However, classical dendrometric methods are rather inaccurate or even incapable of time- and cost-effectively measuring 3D tree structure, crown dynamics and space occupation non-destructively. Therefore, we applied terrestrial laser scanning (TLS) in order to measure the structural dynamics at tree and stand level from gap cutting in 2006 until 2012 in pure and mixed stands of Norway spruce (Picea abies [L.] Karst.) and European beech (Fagus sylvatica L.). In conclusion, our results suggest that Norway spruce invests newly available above-ground resources primarily into DBH as well as biomass growth and indicate a stronger resilience against loss of crown mass induced by mechanical damage. European beech showed a vastly different reaction, investing gains from additional above-ground resources primarily into faster occupation of canopy space. Whether our sample trees were located in pure or mixed groups around the gaps had no significant impact on their behavior during the years after gap cutting.
Keywords
Picea abies;
gap dynamics;
Fagus sylvatica;
crown expansion;
crown allometry;
TLS;
growing area competition;
growing space efficiency
-
Bayer,
Address Technical University of Munich (TUM), Chair for Forest Growth and Yield Science, Hans-Carl-von-Carlowitz-Platz 2, 85354, Freising, Germany
 http://orcid.org/0000-0002-2084-3019
E-mail
dominik.bayer@lrz.tu-muenchen.de
http://orcid.org/0000-0002-2084-3019
E-mail
dominik.bayer@lrz.tu-muenchen.de
- Pretzsch, Address Technical University of Munich (TUM), Chair for Forest Growth and Yield Science, Hans-Carl-von-Carlowitz-Platz 2, 85354, Freising, Germany E-mail hans.pretzsch@lrz.tu-muenchen.de
Received 8 June 2017 Accepted 9 October 2017 Published 17 October 2017
Views 137467
Available at https://doi.org/10.14214/sf.7748 | Download PDF

Abbreviations
The following abbreviations are used in this manuscript:
ADBH: Temporal allometric coefficient for the allocation ratio between crown diameter and DBH
AH: Temporal allometric coefficient for the allocation ratio between crown diameter and H
AB: Temporal allometric coefficient for the allocation ratio between crown diameter and B
DBH: Diameter at Breast Height (1.3 m)
CPA: Crown Projection Area
CPAG: Crown Projection Area Growth
D: Diameter of a hypothetical circle encompassing the same area as the respective sample tree’s CPA
GPA: Gap Projection Area
EOC: Efficiency of Space Occupation
EEX: Efficiency of Space Exploitation
EBI: Efficiency of Biomass Investment
H: Tree height
TLiDAR: Terrestrial Light Detection and Ranging (see also: TLS)
TLS: Terrestrial Laser Scanning
ML: Multi-Layering
RML: Relative Multi-Layering
1 Introduction
During the long lifetime of forest stands, various kinds of disturbances (e.g., tree mortality due to competition, storm damage, bark beetle attacks or thinning) repeatedly cause openings in the canopy and vacancies in the root space. In the past, these forest gaps were mainly of interest regarding the mosaic-cycle concept of natural unmanaged ecosystems (Mueller-Dombois 1991; Remmert 1991; Lertzman et al. 1996). However, in the ongoing transition from rather homogeneous monocultures to more heterogeneous mixed-species stands, silviculturally generated gaps play an essential role (Burschel and Huss 1997; Puettmann et al. 2012; Drössler et al. 2016).
Gaps are, for instance, cut into stands of middle or advanced age to initiate natural regeneration, to promote light demanding underplanting or to prepare the establishment of light demanding species as well as to enhance and promote structural and habitat diversity (Pretzsch et al. 2015). Silvicultural concepts such as selection cutting, femel coupe, or gap cutting, which result in opened canopies, gain currency. In addition, gaps often result from disturbances such as bark beetle attacks, wind throw, and snow-breakage. So, apart from the juvenile stand phase fully stocked, stands without gaps were standard in the past but have become rather an exception at present. This tendency towards gap rich stand structures has been strongly promoted by the concept of emulation of natural disturbance in forest management (Buddle et al. 2006; Kuuluvainen and Grenfell 2012). In most European forest ecosystems the natural dynamics would follow the mosaic-cycle dynamics with a gap phase caused by randomly distributed natural death of trees or tree groups. By anticipating their natural death and cutting them when still of merchantable value, forest management nowadays partly emulates the natural stand development regime (Kuuluvainen and Grenfell 2012).
Methods for measurement and quantification (Assmann 1970; Röhle and Huber 1985) as well as modelling (Pretzsch 1992; Pretzsch 2006) have been improved and refined in the past. However, although it is evident that the competition for canopy space and its associated resources is a major driver of forest dynamics (Purves et al. 2007), and forests are more and more dominated by gaps and border trees, knowledge of tree and stand dynamics at the border to gaps is still scarce. The main reason for this deficit is that the establishment, structure and dynamics of gaps and trees at gap borders are difficult to measure (van der Meer and Bongers 1996) by classical methods due to constraints of measuring the three-dimensional structure of tree crowns. Leaning and straightness of border trees, their branches and crown eccentricity for example, are hardly measurable by optical plummet or hypsometer but determine wood quality (Pretzsch and Rais 2016). Crown extension, layering, and transparency are difficult to access by hemispherical photography but important for understanding and modelling light conditions within the gap, velocity of gap closure, and growth resilience after gap cutting (Dieler and Pretzsch 2013; Seidel et al. 2015). Furthermore, the roughness of the canopy surface and the borderline of gaps is important to know as it can increase the susceptibility to wind-throw (Quine and Gardiner 2007), the habitat quality and species diversity (Goetz et al. 2010; Müller et al. 2012).
The progress of three-dimensional high-precision techniques for measurements within forest stands, such as terrestrial laser scanning (TLS) during the last decade however, makes these highly valuable, yet hard to determine parameters more and more accessible. Studies utilizing TLS have, especially during recent years, started to outgrow the stage of pure methodological (Bucksch et al. 2010; Côté et al. 2011; Hackenberg et al. 2015) development towards important contributions to the understanding of ecological questions. Bayer et al. 2013 for example was one of the first studies investigating relationships between the inner crown morphology as well as crown shape and the surrounding stand. Former studies used TLS-derived individual tree parameters to relate a tree’s shape (Seidel et al. 2011) or growth (Metz et al. 2013) to its surrounding stand. Other studies have for example dealt with TLS measurements in forest gaps and the impact of gaps on tree diameter increment and crown shape (Seidel et al. 2015; Seidel et al. 2016).
Our study analyzes forest gap border trees using repeated measurements to scrutinize their actual development over time. Based on repeated TLS measurements of the crown structure from 2006–2012 and additional longer term terrestrial measurement of annual growth rates of pure and mixed stands of Norway spruce (Picea abies [L.] Karst.) and European beech (Fagus sylvatica L.), we scrutinize (i) the species- and gap type specific effect of gap-emergence on the crown structure and allometric relations on tree level, (ii) the utilization of the newly available above-ground resources and (iii) the development of the crown cover in the gap area concerning space occupation and multi-layering.
2 Materials and methods
2.1 Study area
The analyzed gaps lie within the experimental plot FRE 813/1, located at the “Kranzberger Forst” near Freising in Southern Bavaria, Germany (48°42´N, 11°66´E). The study site is located 490 m above sea-level in the ecological region “Tertiäres Hügelland. Oberbayerisches Tertiärhüggelland” on a Luvisol, derived from loess over tertiary sediments. The long-term averages of annual air temperature range between 7 °C and 8 °C, accompanied by an annual precipitation of 750–850 mm (BayFORKLIM 1996). Norway spruce and European beech are the main tree species. There are occasional single members of other species present, however they do not contribute significantly to the overall stand structure and are not located in proximity to our sample trees. The sample trees themselves are members of a pure spruce and a beech group as well as a group composed of both species in mixture. During 2007, the average stand age was determined as 56 (spruce) and 66 years (beech). In order to create gaps, two trees have been harvested in the middle of the respective group before the first laser scan acquisition has been made in autumn 2006.
We defined and quantified the gap area of each gap as a polygon using the middle of the stem bases of the surrounding trees as vertices. This way, the areas are fixed over the different scan acquisition dates and take the specific shape of each gap into account. The resulting gap polygon areas cover 32.18 m2 (spruce), 54.77 m2 (beech) and 84.03 m2 (mixed).
2.2 Scan acquisition
The TLS scans were acquired during the leafless state of the sample trees in the years 2006, 2008, 2010 and 2012. Fixed, permanently installed reflectors facilitated the precise alignment of the repeated measurements’ point clouds. The Riegl LMS-Z360 laser scanning system was used in 2006 and 2008, while the newer, more advanced Riegl LMS-Z420i, was used for the later data acquisitions of 2010 and 2012. In order to cover the gaps, three scan positions arranged roughly in a triangle formation around the trees representing the respective gap have been set up for each measurement. Additionally, we set up a fourth scan position in the middle of each gap, in order to gain undisturbed and sharp data of the boundaries of the available free space. During each positioning of the scanner, we closely paid attention to ensure a field of view with as little occultation of the crowns as possible. The vertical and horizontal angular resolution was set to 0.06° in order to achieve a sensible trade-off between scan-time, risk of disturbances due to tree movement caused by wind and resolution.
Both systems work according to the time-of-flight principle. A short laser impulse is fired in a specified direction towards a target. Part of the light is reflected back to the scanner which measures the time between firing and the return of the laser impulse. The speed of light in air cair, adjusted by air temperature, pressure and moisture, in combination with the time of flight of the laser impulse results in the measurement distance dl = 0.5t × cair. Distance and direction yield the spherical coordinates of the target which are translated to Cartesian coordinates for further processing. The many consecutive measurements finally result in a three-dimensional image of the scanned region.
Due to the widening of the scan angles with increasing distance to the scanner, the measurement density drops with distance. Furthermore, the laser beam is normally not able to penetrate tree compartments in order to perform measurements behind obstacles. These two effects result in rather sparse measurement densities in the upper crown regions, especially if the crown parts near to the scanner are dense, like those of conifers (Hilker et al. 2010). In the case of this study however, these effects are less relevant because (i) for every gap measurement, one of the scanner positions lied in the middle of the respective gap and was therefore located closest to the crown regions of the most interest, namely the regions directed towards the gap middle and (ii) we used a distance measurement mode which is called last-pulse or last-target, gaining a higher proportion of returns from inner crown regions than by using the devices’ first-pulse modes.
2.3 Structure analysis
After the acquisition of our scans, the data of all scan positions and dates were referenced to each other. Then, the individual tree scans were manually extracted and exported using the scanner manufacturer’s software RiSCAN PRO. Further processing was done within the programming environments of Python and R.
In order to derive projected areas and volumes from our point clouds, we utilized two- and three-dimensional α-shapes. These α-shapes are generalizations of the convex hull of a point set based on Delaunay triangulation (Edelsbrunner et al. 1983; Edelsbrunner and Mücke 1994). Thereby, the so-called α-value is a parameter controlling the level of detail in which the calculated shape represents the point cloud. It can range from α→0, which yields the point cloud itself, to α→∞, yielding the convex hull of the point cloud.
The biggest issue in using α-shapes for the reconstruction of shapes from point sets is the choice of an appropriate α-value. Applying too large α-values leads to coarse hulls, which is not desirable since much of the detailed information in the original TLS point cloud is lost. However, too small values result in incomplete reconstructions of the original TLS data if the distance between measured points cannot be covered by the application radius of the α-shape. In our study, we determined α-values which yield solid, yet detailed α-shapes by calculating various α-shapes using a series of α-values ranging from very small (0.05 m) to relatively large (10 m). Real perimeters and surfaces show fractal-like properties, meaning that their measured values rise with smaller measurement units (Mandelbrot 1967). Therefore, in an ideal world with unlimited data resolution, the perimeter (2D) or the surface (3D) of an α-shape of the same point cloud must increase with decreasing α-value as long as the calculation yields robust results. For our data, this behavior held true until α = 0.25 m for 2D and α = 0.30 m for 3D calculations which are the values we used.
The crown projection areas CPAtot were calculated by projecting the respective point cloud onto the xy-plane. After the projection, the sum of all surfaces of the triangles generated by the involved Delauny triangulation determine the respective 2D α-shape’s surface area. Furthermore, we calculated the surface areas of subsets of each crown’s point cloud which represent the share of the crown projection lying in- (CPAin) and outside (CPAout) the defined gap polygon (Fig. 1, blue and green shaded areas). Analogously, the volumes of 3D α-shapes were computed by summation of their contained tetrahedrons’ volumes.
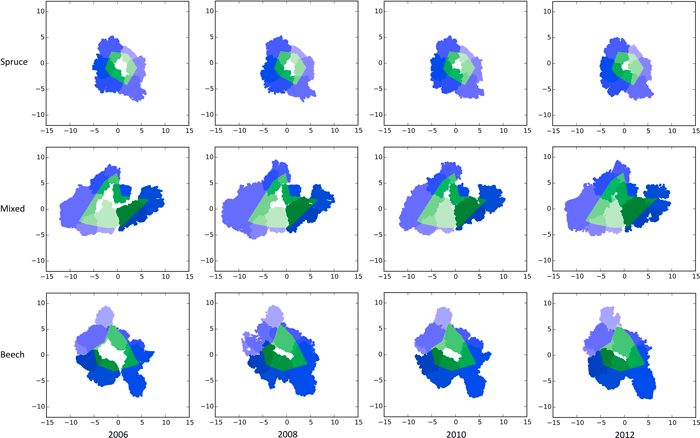
Fig. 1. Bird’s eye view of the TLS scans showing the crown closure from 2006–2012 in pure stands of Norway spruce (top row), a mixed stand of Norway spruce and European beech (middle row) and European beech (bottom row) after generating gaps (white centres) by thinning on the experimental plot FRE 813/1 in 2006. The green areas mark the portion of the crowns lying inside the gap polygon. Blue areas mark the crown regions outside the polygon borders. Different shades of green and blue are given to make the gap’s individual trees visible. View larger in new window/tab.
In order to determine the crown volumes, we cut the point clouds at the point where the crown commences and calculated the 3D α-shape volumes of the remaining points. To specify the vertical shape of a sample tree’s crown, its point cloud was horizontally sliced into compartments of 1m height. Each compartment was projected flat to the xy-plane. Then, its surface was derived from its 2D α-shape as described above. The height of the slice with the largest surface within the crown in relation to the overall crown height describes the vertical crown shape HCPA. Each of the described calculations were done for every sample tree and measurement in order to scrutinize the respective development over time.
To describe the gap’s impact on resource allocation, we also computed temporal allometric coefficients which describe the allocation ratio between crown diameter and DBH (ADBH, Eq. 1), crown diameter and height H (AH, Eq. 2) as well as crown diameter and biomass B (AB, Eq. 3)
![]()
![]()
![]()
whereby D is the diameter of a hypothetical circle encompassing the same area as the respective sample tree’s CPA to normalize crown diameter despite a crown’s natural irregularities. Biomasses used here and later have been estimated using the set of biomass functions provided by (Pretzsch et al. 2014).
The increase in total crown projection area (CPAtot) was scrutinized not only by computing the change of the CPAtot itself over time, but also by distinguishing between the crown parts in- and outside the defined gap polygon, so the relative CPA growth towards (CPAGin) and away from the gap area (CPAGout) could be determined (Eq. 4, Eq. 5).


In line with Matyssek et al. 2002 and the idea that growth can be conceived as a resource investment in order to occupy space, we quantified a sequence of cost/benefit relations. Thereby a measure of biomass efficiency in terms of space occupation is given by the efficiency of space occupation EOC (Eq. 6) which sets the CPA in relation to the existing biomass. Another descriptive parameter we used in this study is the efficiency of space exploitation EEX, quantifying the relation between biomass increase and projected crown area (Eq. 7) as well as the efficiency of biomass investment EBI which quantifies the relation between existing biomass and biomass growth GB (Eq. 8).
![]()
![]()
![]()
On gap level, we derived the total projection area for every gap GPA within its polygon borders, viewing the gap as a whole. By comparing the GPA with the sum of the individual tree crowns the gap is comprised of, we can derive the multi-layered area i.e. the area which is overshadowed by more than one crown (Eq. 9). Furthermore, for comparability we calculated gap closure values and multi-layering values relative to the respective gap sizes.
![]()
3 Results
Fig. 1 gives a bird’s eye view of the spruce, beech and mixed gap trees’ TLS point cloud representations of all four measurement dates. As expected, within all three groups, crown expansion, especially towards the newly emerged free space, is clearly visible.
3.1 Individual tree paramneters
During the observation period from 2006 to 2012, Norway spruce’s mean height increased from 28.3 m to 29.0 m and from 26.6 m to 27.6 m in case of European beech. The mean DBH of our sample spruces increased from 33.9 cm in 2006 to 37.1 cm in 2012, the mean DBH of beech grew from 25.6 cm to 26.7 cm over the same period (Table 1).
| Table 1. Individual tree parameters by species from 2006 to 2012. | ||||||||||
| Species | Year | N | DBH [cm] | SE | H [m] | SE | CPAtot [m2] | SE | HCPA [%] | SE |
| Norway spruce | 2006 | 10 | 33.9 | 2.04 | 28.3 | 0.52 | 14.3 | 1.49 | 54.2 | 0.03 |
| 2008 | 10 | 35.0 | 2.03 | 28.6 | 0.50 | 15.1 | 1.24 | 52.1 | 0.02 | |
| 2010 | 10 | 36.1 | 2.06 | 28.8 | 0.48 | 15.9 | 1.05 | 53.4 | 0.03 | |
| 2012 | 10 | 37.1 | 2.04 | 29.0 | 0.46 | 17.8 | 1.12 | 54.0 | 0.03 | |
| European beech | 2006 | 12 | 25.6 | 1.77 | 26.6 | 0.30 | 19.4 | 2.75 | 57.1 | 0.04 |
| 2008 | 12 | 26.1 | 1.80 | 27.0 | 0.30 | 26.3 | 4.12 | 59.0 | 0.05 | |
| 2010 | 12 | 26.4 | 1.82 | 27.3 | 0.31 | 22.0 | 3.22 | 60.1 | 0.04 | |
| 2012 | 12 | 26.7 | 1.83 | 27.6 | 0.31 | 24.4 | 3.62 | 58.3 | 0.04 | |
| N = number of trees, DBH = diameter at breast height, H = height, CPAtot = mean crown projection area derived from two-dimensional α-shapes (α = 0.25 m), HCPA = relative height within crown with maximum projection area, SE = standard error. | ||||||||||
While Norway spruce increased its α-shape derived mean crown projection area (CPAtot) from 14.3 m2 (2006) to 17.8 m2 (2012) in a steady fashion, European beech presents a jump during the observation period from 2006 (19.4 m2) to 2008 (26.3 m2) directly following the cutting and a retreat back to 22.0 m2, suggesting events leading to mechanical damage during the period from 2008 to 2010 (Fig. 2).
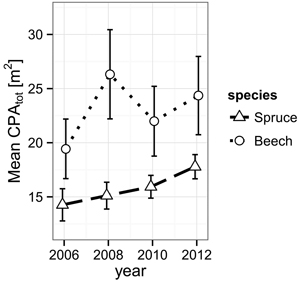
Fig. 2. Development of the mean crown projection area (CPA) derived from α-shapes (α = 0.25 m) of the individual trees’ TLS point clouds for both species from 2006 to 2012. The error bars mark the one-fold standard error.
The relative height of the maximum crown projection area (HCPA), describing the vertical crown shape averages to 53.4 % (spruce) and 58.6 % (beech) over all observation periods. However, no clear development trend can be observed.
Spruce’s growth in DBH during the period directly after the cut (2006–2008: 1.07 cm period–1) is significantly higher than in the period before (2004–2006: 0.74 cm period–1, p = 0.006) and stays at an increased level until 2012. Beech does not significantly react immediately in terms of DBH growth (0.44 cm period–1 before and 0.43 cm period–1 after cut), nor at a later point in our study.
The temporal allometric crown diameter parameters (Table 2), indicating the allocation bias of exploited resources, do not show distinct reactions in case of Norway spruce (Fig. 3). The ratio between crown diameter growth in relation to existing crown diameter and DBH growth in relation to existing DBH, ADBH (Eq. 1), changes from 1.39 in 2008 to 1.56 in 2012 with a minimum of 0.95 in 2010, exposing a slight bias towards CPA growth. AH being at an overall higher level and therefore suggesting an allocation bias towards CPA over height, rises from 4.40 in 2008 to 6.97 in 2012. The AB however, being below 1.0 (0.67 in 2008, 0.47 in 2010, 0.77 in 2012) shows a substantial bias towards biomass production compared to lateral crown expansion. In contrast to Norway spruce with its rather steady parameters, European beech reacts significantly stronger to the emergence of the gaps. All three allometric parameters reach their maximum value in the observation period directly after gap emergence, displaying an immediate strong allocation bias towards lateral crown expansion over stem diameter, height and biomass growth in 2008 (ADBH: 11.02, AH: 12.60, AB: 3.74). On the other hand, European beech’s crowns prove to be less resilient against mechanical influences resulting in loss of crown size. Due to the substantial loss of crown projection area during the period from 2008 to 2010, the according values of ADBH (–7.48), AH (–10.19), and AB (–2.74) are negative. Finally, in 2012 the allocation reaches more stable levels at an ADBH of 4.18, AH of 2.14 and an AB of –1.54.
| Table 2. Allometric parameters. | |||||||
| Species | Year | ADBH | SE | AH | SE | AB | SE |
| Norway spruce | 2008 | 1.39 | 1.01 | 4.40 | 5.52 | 0.67 | 0.51 |
| 2010 | 0.95 | 0.66 | 4.74 | 2.84 | 0.47 | 0.32 | |
| 2012 | 1.56 | 0.44 | 6.97 | 2.64 | 0.77 | 0.22 | |
| European beech | 2008 | 11.02 | 3.75 | 12.60 | 1.95 | 3.74 | 0.99 |
| 2010 | –7.48 | 2.51 | –10.19 | 3.75 | –2.74 | 0.93 | |
| 2012 | 4.18 | 1.10 | 2.14 | 2.96 | –1.54 | 3.06 | |
| ADBH = allocation ratio between crown diameter and DBH, AH = between crown diameter and height, AB = crown diameter and biomass, SE = standard error. | |||||||
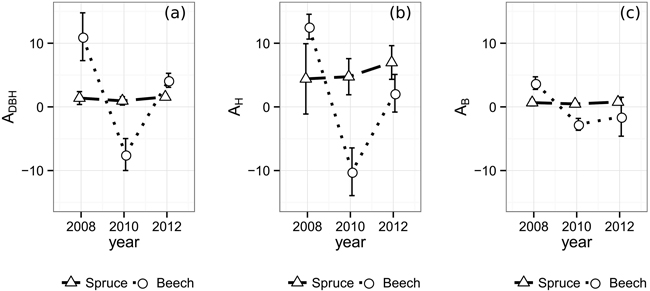
Fig. 3. Allometric relations and one-fold standard error bars over time between (a) crown diameter and DBH, (b) crown diameter and tree height (c) and crown diameter and biomass. In order to take different crown shapes into account, the crown diameter was substituted by the diameter of a hypothetical circle encompassing the same area as its respective tree’s two-dimensional α-shape (α = 0.25 m).
3.2 Space utilization
The projected area growth CPAGin of spruce’s crown sections from 2006 to 2008 within the defined gap borders was 0.07 m2 m–2, successively rising to 0.11 m2 m–2 (2010) and 0.26 m2 m–2 in 2012 (Fig. 4). While a trend could be assumed from the data, it is not significant (2008 and 2012, p = 0.064). European beech shows a totally different behavior. The period immediately after the gap cutting features quite a strong boost of 1.24 m2 m–2 in CPAGin. In the following period, the space occupation is even negative (–0.12 m2 m–2) and reaches 0.06 m2 m–2 in the final observation period. The initial value was significantly higher than both other observations (p2010 = 0.005, p2012 = 0.011).
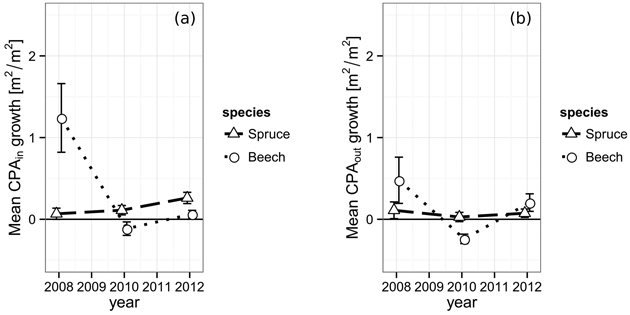
Fig. 4. (a) Increase of the crown projection area by species within the gap polygon, i.e. towards the gap center and (b) increase of the crown projection by species area outside of the gap polygon, towards competing neighbors from 2006 to 2012. The vertical bars indicate the one-fold standard error.
The projected area growth CPAGout of the crown sections lying outside the defined gap borders does not react as strong to the newly created gaps. Spruce starts with 0.11 m2 m–2 in the first period, shows 0.03 m2 m–2 in the second and finally reaches 0.07 m2 m–2 in the last period, which is significantly less than its corresponding CPAGin (0.26 m2 m–2, p = 0.045). The development of European beech’s CPAGout behaves quite similar to its CPAGin. However, the initial growth boost of the first period is less pronounced outside the inner gap borders resulting in a CPAGout of only 0.48 m2 m–2. Furthermore, the CPAGout of the second period is even more negative (–0.24 m2 m–2) than its corresponding CPAGin, indicating either a better resistance against mechanical crown damage, a lower actual projected area growth compensating for the damage or a combination of both.
The efficiency of space occupation of spruce (EOC2006 = 11.0 m2 m–3, EOC2008 = 10.8 m2 m–3, EOC2010 = 10.8 m2 m–3, EOC2012 = 11.4 m2 m–3) is significantly lower than beech’s corresponding value over all periods. (EOC2006 = 27.1 m2 m–3, EOC2008 = 36.4 m2 m–3, EOC2010 = 29.4 m2 m–3, EOC2012 = 28.7 m2 m–3, p2006 = 0.010, p2008 = 0.011, p2010 = 0.022, p2012 < 0.001). While the EOC of spruce seems to be unaffected by the gap’s appearance, beech features a rather strong increase after the first observation period, followed by a decrease back to approximately the original level in the following years (Fig. 5).
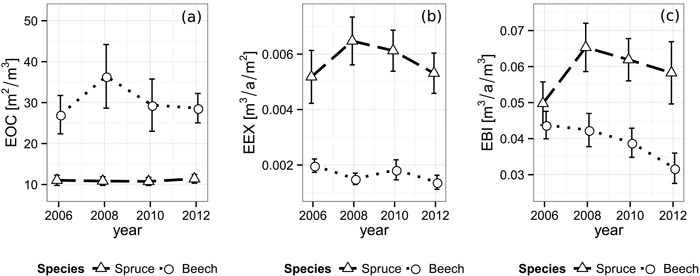
Fig. 5. Development of (a) efficiency of space occupation (EOC), (b) efficiency of space exploitation (EEX) and (c) efficiency of biomass investment (EBI) for each species from 2006 until 2012. Vertical bars indicate the one-fold standard error.
Norway spruce shows a significantly higher efficiency of space exploitation than beech during all periods (all p-values ≤ 0.002), starting at 5.18×10⁻³ m3 a–1 m–2 (Fig. 5). In contrast to the EOC, spruce’s EEX rises to its peak of 6.48×10⁻³ m3 a–1 m–2 during the period right after the cutting and from there on decreases back to approximately the original level over the following periods. The EEX development of beech seems to feature no significant direction with values alternating around 1.67×10⁻³ m3 a–1 m–2 decreasing immediately after the gap creation, then rising and decreasing again in the following periods.
Consequently, while the efficiency of biomass investment starts at a similar level in 2006 (EBI spruce: 4.98×10⁻² m3 a–1 m–3, EBI beech: 4.38×10⁻² m3 a–1 m–3), spruce shows significantly higher values than beech with a maximum of 6.53×10⁻² m3 a–1 m–3 immediately after the cut and in the following periods (p2008 = 0.009, p2010 = 0.003, p2012 = 0.008, Fig. 5). Beech, in contrast, features a steadily decreasing EBI trend, starting at 4.38×10⁻² m3 a–1 m–3 and reaching a significantly lower value of 3.18×10⁻² m3 a–1 m–3 (p = 0.046) at the end of our observation. An overview of the space utilization results is given in Table 3.
| Table 3. Space utilization parameters by species from 2006 to 2012. View in new window/tab. |
3.3 Whole-gap development
The α-shape derived gap areas of all three gaps closed during the course of our observation (Fig. 6, Table 4). The pure spruce gap, starting with a single-layer gap projection area (GPA) of 22.6 m2, increased its GPA steadily up to 27.0 m2 in 2012. By definition, the maximum GPA is given by the gap polygon area (Apoly, pure spruce = 32.2 m2), meaning at the end of our observation 84.0% of the available, single layered space was occupied (70.2% at the beginning). The larger European beech gap (Apoly, pure beech = 54.8 m2) grew its initial GPA of 32.0 m2 in 2006 to 49.1 m2 in 2012, translating to a relative single-layer closure development from 59% up to 90% at the end of the observation. The mixed-species gap (Apoly, mixed = 84.0 m2), similarly to the pure spruce gap, features a steady GPA growth, encompassing values from 61.6 m2 (2006) to 76.4 m2 (2012). Accordingly, the mixed-species relative single-layer area during the whole time-span grew from 73.3% to 90.9%.
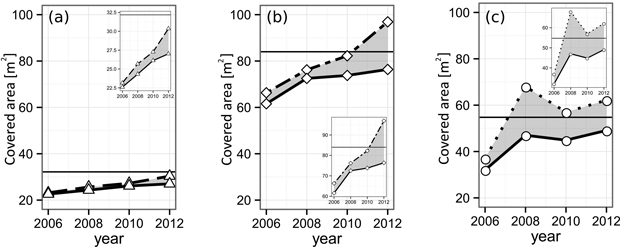
Fig. 6. Layering development of the analyzed (a) spruce, (b) mixed and (c) beech gaps from 2006 until 2012. The solid lines indicate the area of the leaf-cover as a whole. The dashed lines show the sum of all individual tree CPAs forming the respective gap. The difference (gray area) indicates crown overlap, i.e. multi-layering. The black horizontal lines mark the area of the gap polygon, i.e. the highest possible area of the single-layered cover. View larger in new window/tab.
| Table 4. Descriptive data of the gap-level development from 2006–2012. | |||||||
| Gap | Year | Apoly [m2] | GPA [m2] | Rel. closed | ∑CPAin [m2] | ML [m2] | RML |
| Norway spruce | 2006 | 32.2 | 22.6 | 0.70 | 23.15 | 0.55 | 0.02 |
| 2008 | 32.2 | 24.3 | 0.76 | 25.68 | 1.36 | 0.06 | |
| 2010 | 32.2 | 26.1 | 0.81 | 27.27 | 1.15 | 0.04 | |
| 2012 | 32.2 | 27.0 | 0.84 | 30.35 | 3.33 | 0.12 | |
| European beech | 2006 | 54.8 | 32.0 | 0.59 | 36.97 | 4.93 | 0.15 |
| 2008 | 54.8 | 47.0 | 0.86 | 68.02 | 21.00 | 0.44 | |
| 2010 | 54.8 | 44.9 | 0.82 | 56.00 | 12.10 | 0.27 | |
| 2012 | 54.8 | 49.1 | 0.90 | 62.16 | 13.06 | 0.27 | |
| Mixed | 2006 | 84.0 | 61.6 | 0.73 | 66.31 | 4.75 | 0.08 |
| 2008 | 84.0 | 72.5 | 0.86 | 76.19 | 3.68 | 0.05 | |
| 2010 | 84.0 | 73.8 | 0.88 | 82.24 | 8.46 | 0.11 | |
| 2012 | 84.0 | 76.4 | 0.91 | 96.91 | 20.54 | 0.27 | |
| Apoly = area of gap polygon, GPA = gap projection area, ∑CPAin = sum of all crown sections reaching into the gap polygon, ML = multi-layered area, RML = ML in relation to GPA. | |||||||
The multi-layering area ML of all three gaps increased. However, it is less distinct in the case of the pure spruce gap, reaching its maximum relative ML (RML) of 12.3% in 2012. The pure beech as well as the mixed-species gap both reached a RML of 27.0% until the end of the study. Yet, the European beech gap features a higher level during the middle of the observation period (beech: 21.0% and 12.1% vs mixed: 3.7% and 8.5%).
4 Discussion
One of the more intriguing results of our study is that the type of gap (mixed or pure) had no significant impact on the observed reactions of both species. The mechanisms of intra- and inter-specific competition are important drivers within the feedback loop of stand structure and functioning (Hari 1985; Pretzsch 2009), and in former studies have shown a significant impact on crown shape, size and inner structure (Bayer et al. 2013). It is likely that in our case, the sheer abundance of free above-ground resources overshadowed mixing effects between the two species until most of the gap space was occupied. Our results however, show marked differences in the behavior of the two studied species independent of the type of gap (mixed vs pure). In fact, both species display rather opposing reactions.
4.1 Lateral expansion and interlocking
Spruce’s DBH growth immediately increases within the first period after gap emergence, then stays at high level with slight downtrend. Significant shifts in the allocation of exploited resources during the study could not be observed (Fig. 3). We observed that the efficiency of space occupation does not significantly change during the observation period, while the efficiencies of space exploitation and biomass investment rise during the first two years after gap emergence. This strongly suggests that spruce utilized the additionally available above-ground resources primarily for increased DBH growth without significant morphological adaptations to the altered environment. Norway spruce’s crowns feature rather slow but steady lateral expansion, seemingly almost unaffected by gap emergence. The expected asymmetry of lateral growth (towards gap vs the rest of the stand), while existent (Fig. 4), develops only slowly over time so that it is only significant during the last period. This was not unexpected, since conifers tend to feature low growth towards light (Muth and Bazzaz 2002). Seidel et al. 2016 found similar results comparing Douglas-fir (Pseudotsuga menziesii (Mirb.) Franco) growing at the border to gaps and under normal spacing, where significant differences in lateral crown extension between both groups could not be observed and the major differences lied in lower crown base height as well as a lower height of maximum crown projection of the gap trees. Both significant changes in crown basal height as well the maximum height could not be observed in our study. This however is likely a result of the shorter timespan from 2006 until 2012 in comparison to Seidel et al. 2016 as well as the smaller gap sizes involved and, as a consequence thereof, rather fast closure of our gaps.
For European beech in contrast to spruce, during the first two years after gap emergence, we observed fast lateral crown expansion followed by a sharp decrease in crown size. Unfortunately, the decrease could, based on our data, not be attributed to a particular event with certainty. It seems likely however, that the observed lateral crown retreat was caused by one or several weather events, especially storms which resulted in mechanical damage. Another conceivable cause for the observed crown retreat could, as a result of the rapid initial crown expansion and the resulting increase in competition, be mechanical abrasion between crowns which may be one of the substantial drivers of above-ground competition (Franco 1986; Hajek et al. 2015). Even though the gaps are free space, their size allows contact of trees even on opposite sides of the gap given strong enough winds. The high plasticity of European beech and the resulting strong morphological reaction to the emergence of gaps is also reflected in the allocation ratios (Fig. 3) which show a strong bias towards lateral crown expansion during the first two years, whereby the expansion itself is biased towards the gap space. Also, beech’s efficiency of space occupation, while generally on a higher level than spruce, rises after gap cutting and then comes down to before-gap levels. The efficiency of space exploitation and biomass investment, are below the values of spruce and in the case of EEX show no clear trend over time and a downtrend in the case of EBI. Concluding the individual tree dynamics with the rapid closing observed in the whole gap development, European beech seems to strongly react to the new gap space, utilizing the new above-ground resources in favor of fast space occupation and its associated competitive effects, initially even to the cost of reduced DBH and biomass growth.
Multi-layering of crowns existed in all three gaps from the beginning and increased over time. Thereby, the gap comprised of pure spruce displayed the least tendency towards multi-layering, beech the highest and the mixed gap lied in between. This as well showed the much higher crown plasticity of European beech resulting in the development and the ability to maintain overlapping crowns (Pretzsch and Schütze 2005). All in all, our observations fit rather well in the context of former studies on allometry and growing space efficiency of spruce and beech (Pretzsch and Schütze 2005; Dieler and Pretzsch 2013; Bayer et al. 2013)
4.2 Ecological implications
In crowded plant communities larger individuals often claim a disproportionate share of contested resources and supress their less competitive neighbours, leading to size-asymmetric competition (Schwinning and Weiner 1998; Weiner and Damgaard 2006). In temperate forests, where light is often the primary limit to tree growth, the existence of taller trees with a higher potential for light interception often cause such size-asymmetric competition (Wichmann 2002).
Space serves as an important abstraction for above-ground resources, because the actual distribution and availability of resources within the canopy space, light for example, are hard to measure. Some authors argue that space may even be considered a resource itself (Grams and Lüttge 2011). Abundance, shape and size of gaps within the canopy therefore play a key role in the mechanisms of stand dynamics. The relevance of gaps, their emergence and dynamics for competition and stand development and productivity may be stressed by the following estimation. A 3% annual rate of tree loss due to mortality or thinning means a gap area of 300 m2 per hectare and year. Over a rotation period of 100 years, the transient gap area caused by this drop out process amounts to about 30 000 m2, i.e. 3.0 ha (Pretzsch 2014). Growing space is repeatedly contested by neighbouring trees, occupied, released due to mortality and thinning and recaptured by the most competitive individuals (Bauhus 2009).
After, when planted several thousand or, when naturally regenerated even millions of individual trees contributed to the process of competitive space capturing and recapturing, about 50 to 100 trees per ha are left within a mature stand. These ever-emerging gaps are occupied faster and more completely by species featuring high crown plasticity. Especially in more or less mono-layer stands this ongoing mortality and subsequent closure by crown extension causes a continuous opening up of the canopy.
Crown size and accordingly gap size increases with tree age, and as larger gaps need more time to be recaptured by neighbours and older trees’ lateral shoot growth is rather slow the crown re-coverage becomes more sluggish with increasing stand age. The ongoing gap dynamics is probably the main reason why even in un-thinned mono-layered pure stands 5–15% of the stand area remains uncovered by crowns (Wiedemann 1951). In temperate forests, where individual tree growth is mainly light limited, gaps are faster closed by crown extension above ground than by tree root extension below-ground (Bauhus 2009). Those species with higher crown plasticity can achieve more additional canopy space by faster and more extensive gap occupation equivalent with additional resource capture and competitive strength. Especially gaps caused abruptly by thinning favour those species with quick and wide extension capacity. Additional growing space due to mortality emerges more continuously and is gradually occupied by neighbours already in advance of tree death.
Among the most important factors for the competitive strength of a tree species are its capability of long-term adaptation, for example by genotypic variation and its ability to quickly acclimate to changing environments, which itself is dependent on genetic predisposition. In comparison to Norway spruce, European beech displays superior competitive strength under a majority of Central European site conditions. A key aspect of its success lies in its high crown plasticity and adaptability which is often demonstrated by variations of branch angles, ramification or differing branch curvature for example (Bayer et al. 2013).
4.3 Impacts of forest function and services
The competitive strength of European beech (Fischer 1995) in Central Europe’s natural forest systems is strongly driven by its ability to morphologically adapt to its surroundings (Dieler and Pretzsch 2013; Bayer et al. 2013) and the fast occupation of available growing space it demonstrated in this study. Thereby, not only is beech able to secure space and its resources for itself but also to deny competitors access to the same resources and to hold back competitors from the understory (Pretzsch and Schütze 2009). Fast crown expansion and its associated faster and more complete exploitation of growing space may be favourable in concerning future growth and yield, however larger crowns have negative economic effects, namely on tree value, as well. Lower height of the crown base, knottiness, stem-bending and irregularities of tree-ring width for example, are often more prevalent in more complex stands (Macdonald et al. 2010; Pretzsch and Rais 2016).
The size and structure of crowns and gaps and their development over time also determine a major part of habitat formation. In fact, the plant community and its structure frequently define the majority of a habitat’s physical environment which plays a key role in the distribution and interaction of animal species (Lawton 1983; McCoy and Bell 1991). Plant species diversity or structural complexity are often positively correlated with animal species diversity (Tews et al. 2004). In contrast to trees growing within the stand interior under more regular spacing, trees growing at the border to gaps develop different crown shapes. Especially species featuring high crown plasticity are likely to, among other traits, develop more asymmetric crown shapes, longer branches and, given a big enough gap and time, lower crown base heights during the process of space occupation. The resulting variety provides a larger set of different habitat structures and may enable certain animal species, which would otherwise not be able, to inhabit a stand (North et al. 1999; Hinsley et al. 2009; Müller et al. 2012).
4.4 Methodological considerations
The application of two- and three-dimensional α-shapes of TLS point clouds facilitates the quantification of volume, surface and projection area of individual tree crowns as well as tree groups and gaps on a more detailed level than classical dendrometrical methods under reasonable efforts. To some extent, inhomogeneous point densities, occlusion and noise within the TLS data compromise the quality of raw point clouds within forest stands. The upper canopy regions are usually clearly more affected than the lower ones. Due to multiple scan positions per measurement including one at the gap center and the use of the respective device’s last-pulse mode, we minimized these issues. Three dimensional measurements, for example crown volume calculations, can still be affected. Two-dimensional data, in our case the projections of the originally three-dimensional point clouds onto the xy-plane are hardly compromised because higher crown parts are for the most part occluded by lower crown parts of the same tree and therefore still represented within the respective alpha shapes.
We used two different scanners. The older scanner (Riegl LMS-Z360) was used for the first two measurement dates (2006 and 2008). Its predecessor model (Riegl LMS-Z420i) was used for the later scans of 2010 and 2012. Both devices are high precision instruments. Potential differences in accuracy would be in the order of magnitude of millimeters (Table 1) and therefore should not have had any significant impact on our results. The biggest issue of a study relying so heavily on α-shapes is the choice of proper α-values. We optimized our choice of α by picking the smallest member of a series of alpha values which still yielded α-shapes in compliance with the expected behavior of the relationship between α-value, surface and volume. Thus recreating the most detailed representation of the respective individual tree.
Real TLS time-series and actual observations of structural development over several years are still very rare in forest research and cannot quickly be produced. Unfortunately, we had only three gaps under observation from the beginning, resulting in a rather small sample size. Future experiments are going to include a larger number of gaps as well as different sites, species and species combinations.
5 Conclusions
In compliance with former studies (Bayer et al. 2013; Seidel et al. 2016), we found terrestrial laser scanning to be a suitable tool to accurately measure, and as a consequence thereof, better understand forest structures. Gaps and their dynamics are a major factor in the manifestation of a stand’s light regime, competition and the architecture of individual trees. Thus, wood quality, growth, habitat and biodiversity among others are heavily influenced by gap dynamics.
The importance of forest gaps and their dynamics gain even more relevance as knowledge about the value of spatial variability of forest stands increases and forest management strategies more and more involve transitions towards more heterogeneous mixed-species stands where silviculturally generated gaps play a key role. Next to direct economic and ecological impacts, gap dynamics and especially the quickness of closure of gaps are a major concern in protective forest stands. Depending on the circumstances, hydrologic balance, soil protection and preservation, as well as mechanical stabilization within for example the scope of landslide prevention in montane regions, are often major elements of management plans. To enhance knowledge about gap dynamics and the process of a stand’s reestablishment of economical, ecological and protective functions after disturbances is therefore crucial for sound management decisions.
Analyzing a larger number of forest gaps encompassing a variety of stand structures and species compositions are subjects for further research. Thereby, the utilization of state of the art hardware such as the latest TLS devices as well as advancements and the development of more sophisticated data interpretation methodologies show great potential to yield more comprehensive insights and constitute a valuable contribution towards a more complete understanding of forest gaps and their dynamics.
Acknowledgements
Thanks to the Bavarian State Ministry for Nutrition, Agriculture and Forestry for permanent support of the project W 07 “Long-term experimental plots for forest growth and yield research”. We further wish to thank the German Science Foundation (Deutsche Forschungsgemeinschaft) for providing the funds for the project PR 292/12-1 “Tree and stand-level growth reactions on drought in mixed versus pure forests of Norway spruce and European beech”. Thanks are also due to the anonymous reviewers for their helpful criticism.
References
Assmann E. (1970). The principles of forest yield study. Pergamon Press, Oxford, New York.
Bauhus J. (2009). Rooting patterns of old-growth forests: is aboveground structural and functional diversity mirrored belowground? In: Wirth C., Gleixner G., Heimann M. (eds.). Old-growth forests: function, fate and value. Springer Berlin Heidelberg, Berlin, Heidelberg. p. 211–229. https://doi.org/10.1007/978-3-540-92706-8_10.
Bayer D., Seifert S., Pretzsch H. (2013). Structural crown properties of Norway spruce (Picea abies [L.] Karst.) and European beech (Fagus sylvatica [L.]) in mixed versus pure stands revealed by terrestrial laser scanning. Trees 27(4): 1035–1047. https://doi.org/10.1007/s00468-013-0854-4.
BayFORKLIM (1996). Klimaatlas Bayern. Fachbuchhandlung Kanzler, München, Germany.
Bucksch A., Lindenbergh R., Menenti M. (2010). SkelTre – Robust skeleton extraction from imperfect point clouds. Visual Computer 26(10): 1283–1300. https://doi.org/10.1007/s00371-010-0520-4.
Buddle C.M., Langor D.W., Pohl G.R., Spence J.R. (2006). Arthropod responses to harvesting and wildfire: implications for emulation of natural disturbance in forest management. Biological Conservation 128(3): 346–357. https://doi.org/10.1016/j.biocon.2005.10.002.
Burschel P., Huss J. (1997). Grundriss des Waldbaus. Parey, Berlin.
Côté J.-F., Fournier R.A., Egli R. (2011). An architectural model of trees to estimate forest structural attributes using terrestrial LiDAR. Environmental Modelling & Software 26(6): 761–777. https://doi.org/10.1016/j.envsoft.2010.12.008.
Dieler J., Pretzsch H. (2013). Morphological plasticity of European beech (Fagus sylvatica L.) in pure and mixed-species stands. Forest Ecology and Management 295: 97–108. https://doi.org/10.1016/j.foreco.2012.12.049.
Drössler L., Feldmann E., Glatthorn J, Annighöfer P., Kucbel S., Tabaku V. (2016). What happens after the gap? – Size distributions of patches with homogeneously sized trees in natural and managed beech forests in Europe. Open Journal of Forestry 6(3): 177–190. https://doi.org/10.4236/ojf.2016.63015.
Edelsbrunner H., Mücke E.P. (1994). Three-dimensional alpha shapes. ACM Transactions on Graphics 13(1): 43–72. https://doi.org/10.1145/174462.156635.
Edelsbrunner H., Kirkpatrick D.G., Seidel R. (1983). On the shape of a set of points in the plane. IEEE Transactions on Information Theory 29(4): 551–559. https://doi.org/10.1109/TIT.1983.1056714.
Fischer A. (1995). Forstliche Vegetationskunde. Pareys Studientexte 82. Blackwell Wissenschaft, Berlin, Wien.
Franco M. (1986). The influences of neighbours on the growth of modular organisms with an example from trees. Philosophical Transactions of the Royal Society B: Biological Sciences 313(1159): 209–225. https://doi.org/10.1098/rstb.1986.0034.
Goetz S.J., Steinberg D., Betts M.G., Holmes R.T., Doran P.J., Dubayah R., Hofton M. (2010). Lidar remote sensing variables predict breeding habitat of a Neotropical migrant bird. Ecology 91(6): 1569–1576. https://doi.org/10.1890/09-1670.1.
Grams T.E.E., Lüttge U. (2011). Space as a resource. In: Lüttge E.U., Beyschlag W., Büdel B., Francis D. (eds.). Progress in Botany 72. Springer Berlin Heidelberg, Berlin, Heidelberg. p. 349–370.
Hackenberg J., Spiecker H., Calders K., Disney M., Raumonen P. (2015). SimpleTree – an efficient open source tool to build tree models from TLS clouds. Forests 6(11): 4245–4294. https://doi.org/10.3390/f6114245.
Hajek P., Seidel D., Leuschner C. (2015). Mechanical abrasion, and not competition for light, is the dominant canopy interaction in a temperate mixed forest. Forest Ecology and Management 348: 108–116. https://doi.org/10.1016/j.foreco.2015.03.019.
Hari P. (1985). Theoretical aspects of eco-physiological research. In: Tigerstedt P.M.A., Puttonen P., Koski V. (eds.). Crop physiology of forest trees. Helsinki Univercity Press, Helsinki. p. 21–30.
Hilker T., van Leeuwen M., Coops N., Wulder M.A., Newnham G.J., Jupp D.L.B., Culvenor D.S. (2010). Comparing canopy metrics derived from terrestrial and airborne laser scanning in a Douglas-fir dominated forest stand. Trees 24(5): 819–832. https://doi.org/10.1007/s00468-010-0452-7.
Hinsley S., Hill R., Fuller R., Rothery P. (2009). Bird species distributions across woodland canopy structure gradients. Community Ecology 10(1): 99–110. https://doi.org/10.1556/ComEc.10.2009.1.12.
Kuuluvainen T., Grenfell R. (2012). Natural disturbance emulation in boreal forest ecosystem management – theories, strategies, and a comparison with conventional even-aged management. Canadian Journal of Forest Research 42(7): 1185–1203. https://doi.org/10.1139/x2012-064.
Lawton J.H. (1983). Plant architecture and the diversity of phytophagous insects. Annual Review of Entomology 28: 23–39. https://doi.org/10.1146/annurev.en.28.010183.000323.
Lertzman K.P., Sutherland G.D., Inselberg A., Saunders S.C. (1996). Canopy gaps and the landscape mosaic in a coastal temperate rain forest. Ecology 77(4): 1254–1270. https://doi.org/10.2307/2265594.
Macdonald E., Gardiner B., Mason W. (2010). The effects of transformation of even-aged stands to continuous cover forestry on conifer log quality and wood properties in the UK. Forestry 83(1): 1–16. https://doi.org/10.1093/forestry/cpp023.
Mandelbrot B. (1967). How long is the coast of Britain? Statistical self-similarity and fractional dimension. Science 156(3775): 636–638. https://doi.org/10.1126/science.156.3775.636.
Matyssek R., Schnyder H., Elstner E.F., Munch J.C., Pretzsch H., Sandermann H. (2002). Growth and parasite defence in plants; the balance between resource sequestration and retention: in lieu of a guest editorial. Plant Biology 4(2): 133–136. https://doi.org/10.1055/s-2002-25742.
McCoy E.D., Bell S.S. (1991). Habitat structure: the evolution and diversification of a complex topic. In: Bell S.S., McCoy E.D., Mushinsky H.R. (eds.). Habitat structure: the physical arrangement of objects in space. Springer Netherlands, Dordrecht. p. 3–27. https://doi.org/10.1007/978-94-011-3076-9_1.
Metz J., Seidel D., Schall P., Scheffer D., Schulze E.-D., Ammera C. (2013). Crown modeling by terrestrial laser scanning as an approach to assess the effect of aboveground intra- and interspecific competition on tree growth. Forest Ecology and Management 310: 275–288. https://doi.org/10.1016/j.foreco.2013.08.014.
Mueller-Dombois D. (1991). The mosaic theory and the spatial dynamics of natural dieback and regeneration in Pacific forests. In: Remmert H. (ed.). The mosaic-cycle concept of ecosystems. Springer Berlin / Heidelberg. p. 46–60. https://doi.org/10.1007/978-3-642-75650-4_3.
Müller J., Mehr M., Bässler C., Fenton M.B., Hothorn T., Pretzsch H., Klemmt H.-J., Brandl R. (2012). Aggregative response in bats: prey abundance versus habitat. Oecologia 169(3): 673–684. https://doi.org/10.1007/s00442-011-2247-y.
Muth C.C., Bazzaz F.A. (2002). Tree canopy displacement at forest gap edges.Canadian Journal of Forest Research 32(2): 247–254. https://doi.org/10.1139/x01-196.
North M.P., Franklin J.F., Carey A.B., Forsman E.D., Hamer T. (1999). Forest stand structure of the northern spotted owl’s foraging habitat. Forest Science 45(4): 520–527.
Pretzsch H. (1992). Modellierung der Kronenkonkurrenz von Fichte und Buche in Rein- und Mischbeständen. AFJZ 163: 203–213.
Pretzsch H. (2009). Forest dynamics, growth and yield – from measurement to model. Springer, Berlin, Heidelberg.
Pretzsch H. (2006). Species-specific allometric scaling under self-thinning: evidence from long-term plots in forest stands. Oecologia 146(4): 572–583. https://doi.org/10.1007/s00442-005-0126-0.
Pretzsch H. (2014). Canopy space filling and tree crown morphology in mixed-species stands compared with monocultures. Forest Ecology and Management 327: 251–264. https://doi.org/10.1016/j.foreco.2014.04.027.
Pretzsch H., Schütze G. (2005). Crown allometry and growing space efficiency of Norway spruce (Picea abies [L.] Karst.) and European beech (Fagus sylvatica L.) in pure and mixed stands. Plant Biology 7: 628–639. https://doi.org/10.1055/s-2005-865965.
Pretzsch H., Schütze G. (2009). Transgressive overyielding in mixed compared with pure stands of Norway spruce and European beech in Central Europe: evidence on stand level and explanation on individual tree level. European Journal of Forest Research 128(2): 183–204. https://doi.org/10.1007/s10342-008-0215-9.
Pretzsch H., Rais A. (2016). Wood quality in complex forests versus even-aged monocultures: review and perspectives. Wood Science and Technology 50(4): 845–880. https://doi.org/10.1007/s00226-016-0827-z.
Pretzsch H., Block J., Dieler J., Gauer J., Göttlein A., Moshammer R., Schuck J., Weis W., Wunn U. (2014). Nährstoffentzüge durch die Holz- und Biomassenutzung in Wäldern. Teil 1: Schätzfunktionen für Biomasse und Nährelemente und ihre Anwendung in Szenariorechnungen. Allgemeine Forst- und Jagdzeitung 185(11/12): 261–285.
Pretzsch H., Biber P., Uhl E., Dauber E. (2015). Long-term stand dynamics of managed spruce-fir-beech mountain forests in Central Europe: structure, productivity and regeneration success. Forestry 88(4): 407–428. https://doi.org/10.1093/forestry/cpv013.
Puettmann K.J., Coates K.D., Messier C.C. (2012). A critique of silviculture: managing for complexity. Island Press.
Purves D.W., Lichstein J.W., Pacala S.W. (2007). Crown plasticity and competition for canopy space: a new spatially implicit model parameterized for 250 North American tree species. PLoS ONE 2(9): e870. https://doi.org/10.1371/journal.pone.0000870.
Quine C.P., Gardiner B.A. (2007). Understanding how the interaction of wind and trees results in wind- throw, stem breakage, and canopy gap formation. Elsevier, Amsterdam.
Remmert H. (1991). The mosaic-cycle concept of ecosystems – an overview. Springer, Berlin, Heidelberg. https://doi.org/10.1007/978-3-642-75650-4_1.
Röhle H., Huber W. (1985). Untersuchungen zur Methode der Ablotung von Kronenradien und der Berechnung von Kronengrundflächen. Forstarchiv 56: 238–243.
Schwinning S., Weiner J. (1998). Mechanisms determining the degree of size asymmetry in competition among plants. Oecologia 113(4): 447–455. https://doi.org/10.1007/s004420050397.
Seidel D., Leuschner C., Müller A., Krause B. (2011). Crown plasticity in mixed forests – quantifying asymmetry as a measure of competition using terrestrial laser scanning. Forest Ecology and Management 261(11): 2123–2132. https://doi.org/10.1016/j.foreco.2011.03.008.
Seidel D., Hoffmann N., Ehbrecht M., Juchheim J., Ammer C. (2015). How neighborhood affects tree diameter increment – new insights from terrestrial laser scanning and some methodical considerations. Forest Ecology and Management 336: 119–128. https://doi.org/10.1016/j.foreco.2014.10.020.
Seidel D., Ruzicka K.J., Puettmann K. (2016). Canopy gaps affect the shape of Douglas-fir crowns in the western Cascades, Oregon. Forest Ecology and Management 363: 31–38. https://doi.org/10.1016/j.foreco.2015.12.024.
Tews J., Brose U., Grimm V., Tielborger K., Wichmann M.C., Schwager M. (2004). Animal species diversity driven by habitat heterogeneity/diversity: the importance of keystone structures. Journal of Biogeography 31: 79–92. https://doi.org/10.1046/j.0305-0270.2003.00994.x.
van der Meer P.J., Bongers F. (1996). Formation and closure of canopy gaps in the rain forest at Nouragues, French Guiana. Vegetatio 126(2): 167–179. https://doi.org/10.1007/BF00045602.
Weiner J., Damgaard C. (2006). Size-asymmetric competition and size-asymmetric growth in a spatially explicit zone-of-influence model of plant competition. Ecological Research 21(5): 707–712. https://doi.org/10.1007/s11284-006-0178-6.
Wichmann L. (2002). Modelling the effects of competition between individual trees in forest stands. Royal Veterinary University Copenhagen.
Wiedemann E. (1951). Ertragskundliche und waldbauliche Grundlagen der Forstwirtschaft. JD Sauerländer’s Verlag, Frankfurt am Main.
Total of 56 references.
