Jori Uusitalo  ,
Jari Ala-Ilomäki,
Harri Lindeman,
Jenny Toivio,
Matti Siren
,
Jari Ala-Ilomäki,
Harri Lindeman,
Jenny Toivio,
Matti Siren
Modelling soil moisture – soil strength relationship of fine-grained upland forest soils
Uusitalo J., Ala-Ilomäki J., Lindeman H., Toivio J., Siren M. (2019). Modelling soil moisture – soil strength relationship of fine-grained upland forest soils. Silva Fennica vol. 53 no. 1 article id 10050. https://doi.org/10.14214/sf.10050
Highlights
- Penetration resistance (PR) is best predicted with moisture content (MC), bulk density and clay content
- In fully saturated silty or clayey soils PR range from 600 to 800 kPa
- The models can be linked with mobility models predicting rutting of forest machines.
Abstract
The strength of soil is known to be dependent on water content but the relationship is strongly affected by the type of soil. Accurate moisture content – soil strength models will provide forest managers with the improved ability to reduce soil disturbances and increase annual forest machine utilization rates. The aim of this study was to examine soil strength and how it is connected to the physical properties of fine-grained forest soils; and develop models that could be applied in practical forestry to make predictions on rutting induced by forest machines. Field studies were conducted on two separate forests in Southern Finland. The data consisted of parallel measurements of dry soil bulk density (BD), volumetric water content (VWC) and penetration resistance (PR). The model performance was logical, and the results were in harmony with earlier findings. The accuracy of the models created was tested with independent data. The models may be regarded rather trustworthy, since no significant bias was found. Mean absolute error of roughly 20% was found which may be regarded as acceptable taken into account the character of the penetrometer tool. The models can be linked with mobility models predicting either risks of rutting, compaction or rolling resistance.
Keywords
cone index;
penetration resistance;
shear strength;
soil bulk density;
VWC
-
Uusitalo,
Natural Resources Institute Finland (Luke), Production systems, Korkeakoulunkatu 7, FI-33720 Tampere, Finland
E-mail
jori.uusitalo@luke.fi
- Ala-Ilomäki, Natural Resources Institute Finland (Luke), Production systems Maarintie 6, FI-02150 Espoo, Finland E-mail jari.ala-ilomaki@luke.fi
- Lindeman, Natural Resources Institute Finland (Luke), Production systems, Korkeakoulunkatu 7, FI-33720 Tampere, Finland E-mail harri.lindeman@luke.fi
- Toivio, University of Helsinki, Department of Forest Sciences, P.O. Box 27, FI-00014 University of Helsinki, Finland E-mail toiviojenny@gmail.com
- Siren, Natural Resources Institute Finland (Luke), Production systems Maarintie 6, FI-02150 Espoo, Finland E-mail matti.siren@luke.fi
Received 28 September 2018 Accepted 8 March 2019 Published 15 March 2019
Views 93430
Available at https://doi.org/10.14214/sf.10050 | Download PDF

1 Introduction
The weight of forest machines has increased substantially over the past twenty years. Meanwhile, the negative impacts of climate change are becoming increasingly evident in many parts of the world. In Northern Europe the temperature is expected to rise much more than the global average, which will probably result in shallower snow cover and shorter periods of frozen soil in the forest (EEA 2013). Together with an expected rise in annual precipitation, higher temperatures will markedly increase the number of days when forest soils are prone to extreme rutting caused by machinery. This calls for improved understanding of the relationship between the moisture content and soil strength.
Upland forest soils in Finland and Scandinavia are usually covered by a 2–10 cm thick organic humus layer consisting of a mixture of living and decomposed plants (Wästerlund 1985; Westman 1990). Roughly 70 percent of tree and ground vegetation roots in thinning stands are found in the humus layer. In natural conditions the dry soil bulk density of the uppermost parts of the mineral soil, located under the humus layer, is rather low, 0.95–1.2 g cm–3, (Wästerlund 1989; Westman 1990). Mineral soils are generally divided into soil classes based on the proportion of soil particles falling into specified size classes. In Finland, roughly 20 percent of forest land is classified into clayey, silty or till soils with high proportion of fine particles (GTK 2018).
The strength of soil is known to be dependent on its water content but the relationship is strongly affected by the type of soil. In organic soils, e.g., in peatlands the relationship between the strength and moisture content has been shown. However, from the trafficability point of view, this relationship is of little value since also dry peat is relatively weak compared to inorganic soils (Uusitalo et al. 2013). In fine textured mineral soils, the strength is strongly affected by the moisture content. The finer the grain size distribution is, the stronger the influence of the moisture content is on the soil strength (Freitag 1987). In practice, however, silty soils are more prone to trafficability problems than clayey soils, because fat clay has remarkably low water permeability (Karafiat and Nowatzki 1978).
The strength of inorganic soil is most conveniently measured with a cone penetrometer. Cone penetrometer measured penetration resistance (PR) values are mainly utilized for two different purposes. First, the PR of the topsoil (generally first 10–20 cm) is generally utilized in predicting the rutting of vehicles passing over the soil. In forestry, rutting models are very useful in avoiding visual soil damage. Second, the PR can be used in indicating the degree of soil compaction which is very harmful for the future growth of crops and trees. The term PR is also widely known as cone index (CI) or Cone penetration resistance (CPR).
The consequences of compaction of agricultural fields have been studied widely (Ala-Kukku et al. 2003). Recently, compaction has been receiving increasing attention also in forestry. Compaction results in reduced porosity, which implies limitations in oxygen and water supply with negative consequences for soil productivity (Murphy et al. 2009; Ampoorter et al. 2010; Goutal et al. 2013; Cambi et al. 2015). Forest soils have been shown to recover more slowly than presumed previously (Labelle et al. 2011). Since ground pressure is known to correlate positively with soil compaction, many researchers have focused on analysing how well the choice of tyres or bogie tracks and tyre inflation pressure can lower soil compaction (Bygden et al. 2003; Eliasson 2005; Sakai et al. 2008).
In inorganic soils, PR is known to be controlled by the three main factors, which are moisture content, bulk density and clay content (Ayers and Perumpral 1982; Witney et al. 1984; Elbanna and Witney 1987; Canarache 1990; Smith et al. 1997; Dexter et al. 2007). Obviously, the proportion of organic substrate affects PR as well, but its role is thought to be more important as the clay content decreases (Smith et al. 1997). Due to the dominant role of moisture content affecting PR, many researchers have suggested specific correction factors (Busscher 1990; Busscher et al. 1997; Vaz et al. 2011) or tools for the simultaneous measurement of PR and moisture content (Vaz et al. 2001; Hummel et al. 2004; Miyamoto et al. 2012) to make the PR results more versatile. Of these numerous investigations, only a few have been carried out in forest soils. Since we were unsure how soil strength is controlled by moisture content and other relevant factors in boreal forests, we decided to arrange a new controlled study for this purpose. The aim of this study was to examine soil strength and how it is connected to physical soil properties in fine-grained forest soils; and develop models that could be applied in practical forestry to make predictions on rutting induced by forest machines.
2 Materials and methods
Field studies were conducted on two separate forest sites located in the municipalities of Jokioinen (60°49´N, 23°27´E in WGS84) and Vihti (60°24´N, 24°23´E in WGS84) in Southern Finland. The formulation of the study layout differed to some extent between the two test sites. Therefore the first data set from Jokioinen was utilized in modelling and the second data set from Vihti was set as the test data.
2.1 Modelling data
In Jokioinen study site three separate blocks from three different corners of the stand were selected as study areas. The blocks were located 300 to 500 m apart from each other. Block 1 was a mature stand of mixed Scots pine (Pinus sylvestris L.) and Norway spruce (Picea abies (L.) H. Karst.), block 2 was a mature stand consisting of a mixture of Norway spruce (P. abies) and Silver birch / Downy birch (Betula pendula Roth / Betula pubescens Ehrh.), and block 3 was a relatively young mixed spruce-pine-birch stand. Within each of these three blocks two separate crossing test lines were subjectively placed. The direction of the lines was adjusted to both follow contour lines smoothly and to enable the test line to fit inside an area that had homogenous features in terms of growing stock, vegetation and soil type. These test lines are hereafter called columns. The columns in block 1 were numbered 1 and 2. Columns 3 and 4 were located in block 2, and columns 5 and 6 in block 3. On each column four sample points were sited, either 20m (blocks 1 and 2) or 10m (block 3) apart from each other. As a result, each of these three test blocks comprised 8 sample points that were named with a 3-digit code, the first digit indicated the block, the second the column and the third the sample point (e.g. 123 = block 1, column 2, study point 3) (Fig. 1). The growing stock around each study point was inventoried by measuring the diameter at breast height (DBH) and the tree height inside a circular plot with a radius of either 9.77 m (blocks 1 and 2) or 5.64 m (block 3) from the middle point of the study point.
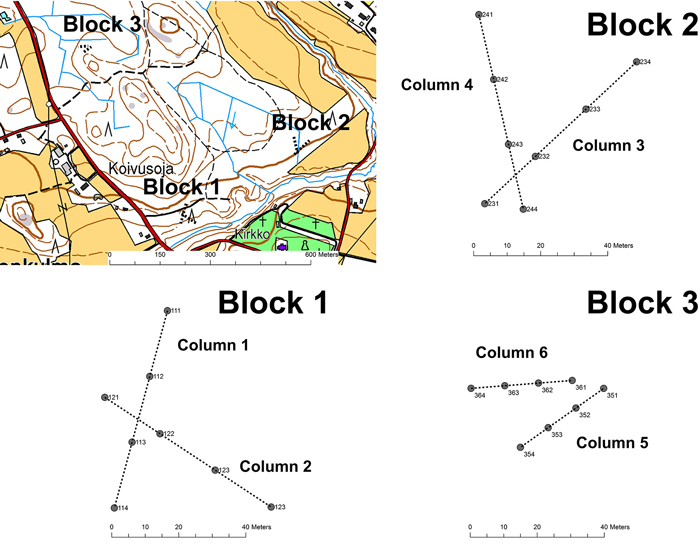
Fig. 1. Layout of the Block – Column -sample point design at the Jokioinen site (Blocks 1–3).
The soil strength and moisture content measurements were carried out on 8 separate occasions at the same sample plot, starting from 12th of August 2014, and ending on 2nd of October 2015. From each study plot a soil sample was extracted using a sampling tube with an inner diameter of 4.6 cm during the second measurement round. The extracted soil core was divided into three sections: the organic layer and two mineral soil subsamples 10 cm in length. The first mineral soil sample started from the top of the mineral soil (0–10 cm) and the second 10 cm below that (10–20 cm). The thickness of the organic layer was also measured. The mineral soil samples were sealed in a plastic bag and then delivered to the laboratory for further analysis.
On each measurement occasion each sample plot was measured for volumetric water content (VWC) and for penetration resistance (PR). Prior to these measurements organic topsoil (2…20 cm) was removed and the measurement started from the upmost point of the mineral soil layer. All repeated measurement points situated in close proximity (less than 1 m) to the point where the soil sample had been extracted. The volumetric water content (VWC) was measured with the FieldScout TDR 100 – soil moisture meter with two 7.5 cm long rods. The PR was measured with an Eijkelkamp Penetrologger 0615SA penetrometer consisting of a 60-degree 11.28 mm diameter (1 cm2) cone. The procedure follows the ASAEBE S313.3 standard with the exception that the original, which was meant principally for agricultural soil, recommends a 30-degree cone instead of a 60-degree cone. The mean of readings 0…10 cm and 0…15 cm from the surface (mineral soil only) are later denoted as PR010ms and PR015ms, respectively. The PR measurements were repeated 2 times. The final PR values are thus the means of these separate measurements. The mineral soil samples were analysed in the laboratory with standard laboratory procedures for bulk density, water content and grain size distribution. The mineral soil was divided into following size classes:
| Particle diameter, mm | ||
| Clay | –0.002 | |
| Fine silt (Fsi) | 0.002–0.006 | |
| Medium silt (Msi) | 0.006–0.020 | |
| Coarse silt (CSi) | 0.020–0.063 | |
| Fine sand (FSa) | 0.063–0.200 | |
| Medium sand (Msa) | 0.200–0.630 | |
| Coarse sand (Csa) | 0.63–2 | |
| Gravel | 2–6 | |
| Cobbles | 6– |
Prior to the particle size analysis, the content of the organic matter was determined using standard burning procedures. The TDR measurements were calibrated with soil samples extracted from the upper part of the mineral soil (0–10 cm). Hereafter, VWC in the test data refer to calibrated moisture content value of the first 10 cm in the mineral soil.
2.2 Test data
In Vihti, the soil strength and moisture content measurements were conducted in conjunction with a wheeling test (driving with forwarder), the main results of which will be reported elsewhere. The Vihti test site consisted of two separate blocks situated roughly 500 m apart. Both blocks, referred to hereafter as blocks 4 and 5, were comprised of Norway spruce dominated forest growing in fine-grained mineral soil. Block 4 was comprised of three columns (numbers 1–3), while block 5 had two columns (4–5). Each column contained three parallel sub-columns that comprised 4 consecutive study plots, 5 m in length and 5 m in width. Similarly to the Jokioinen test site, each study plot in Vihti was named with a 3-digit code, the first digit indicating the driving line (sub-column), the second the column, the third indicating the study plot (e.g. 321 = driving line (sub-column) 3, column 2, study plot 1) (Fig. 2). The DBH of all the trees in a sample plot were measured with a calliper. The height was measured for selected sample trees. Stand characteristics for each sample plot were calculated using the KPL software developed at the Finnish Forest Research Institute (Heinonen 1994). The average DBH, average length (H) and volume of the trees (V) were calculated for each plot.
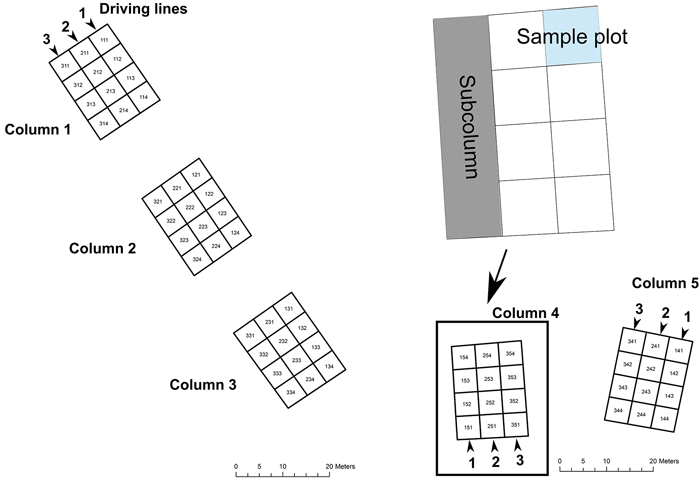
Fig. 2. Layout of the Block – Column – Sub-column -sample plot design at the Vihti site (Block 4 and 5).
The measurements of PR and soil sampling were carried out in conjunction with the wheeling test on three separate occasions in 2015: driving line 2 in early September, driving line 1 in November and driving line 3 (only columns 1–3) in December. Soil sampling and soil analyses were carried out similarly to the procedure carried out in Jokioinen study site. However, the PR measurements in Vihti differed from that of Jokionen. The organic topsoil was not removed. The mean of readings 0…15 cm and 0…20 cm from the surface (including organic topsoil and mineral soil) are later denoted as PR015 and PR020, respectively.
2.3 Statistical analyses
Modelling the relationship between the moisture content and PR of soil was executed using the IBM SPSS v.22 software following the MIXED-procedure and applying the restricted maximum likelihood (REML) estimation method. For repeated measurements, let k denote the measurement round and j sample point within bock i. It was assumed that the repeated measurements in the same point (ij) were correlated. The basic form of the mixed model predicting PR characteristics was:
![]()
where:
PR dependent variable for PR,
b0 constant,
b (row) vector of the (fixed) regression coefficients,
X (column) vector of the continuous and binary explanatory variables,
ui random term (variance) for block i,
vij random term (variance) for sample point j in block i,
yijk auto-regressive error term for repeated measurements ijk.
In order to account for correlation for repeated measurements of the same measurement point residual effect was modelled with first order auto-regressive AR(1) covariance structure meaning that successive measurements are more correlated, with correlation coefficient ρmeas and variance σ2meas. The fit of the models was compared by using the Akaike Information Criterion (AIC). It was noticed that the relationships between the dependent and the most important predictors are not linear. Therefore a transformation of the PR to the inverse of PR was made prior to analyses.
2.4 Testing of the accuracy of the models
In order to compare the model estimates created with the Jokioinen data with the Vihti test data, estimates for PR including both organic topsoil and mineral soil were created. For the topsoil a constant strength of 0.6 MPa and constant thickness of 5 cm was given. The new variables are as follows:
![]()
![]()
where PRest015 and PRest020 are the estimated values for the soil 0…15 cm and 0…20 cm from the surface (includes topsoil and the organic layer), respectively.
3 Results
The main stand characteristics of both sites are presented in Table 1 and the characteristics of the mineral soil samples for the blocks and columns are presented in Table 2. In the modelling data BD ranged from 0.91 to 1.33 g m–3 and in the test data from 0.88 to 1.26 g m–3. The organic content range was in the modelling data from 3.5 to 11.9% and in the test data from 8.0 to 9.7%. The thickness of humus layer varied in the modelling data from 2 to 12 cm, with a mean of 5.6 cm and in the test data from 3 to 11 cm, with a mean of 5.2 cm.
| Table 1. The main stand characteristics of the test sites. | |||||
| DBH | Height | Volume | |||
| Forest site | Block | Mean, cm | Mean, m | m3 ha–1 | |
| Modelling data | |||||
| Jokioinen | 1 | Pine | 28.3 | 25.9 | 178 |
| Spruce | 27.6 | 24.8 | 185 | ||
| Birch | 8.4 | 7.4 | 17 | ||
| Total | 27.8 | 25.1 | 391 | ||
| Jokioinen | 2 | Pine | 20.2 | 16.8 | 37 |
| Spruce | 22.6 | 21.1 | 193 | ||
| Birch | 24.6 | 22.1 | 112 | ||
| Total | 23.6 | 21.6 | 351 | ||
| Jokioinen | 3 | Pine | 12.4 | 13.1 | 59 |
| Spruce | 11.4 | 12.7 | 49 | ||
| Birch | 10.8 | 13.1 | 86 | ||
| Total | 11.4 | 13.2 | 195 | ||
| Test data | |||||
| Vihti | 4 | Pine | - | - | - |
| Spruce | 12.7 | 14.5 | 262 | ||
| Birch | - | - | - | ||
| Total | 12.7 | 14.5 | 262 | ||
| Vihti | 5 | Pine | - | - | - |
| Spruce | 15.8 | 15.4 | 220 | ||
| Birch | 17.6 | 16.0 | 108 | ||
| Total | 17.0 | 15.8 | 328 | ||
| Table 2. Mean (and standard deviation in parenthesis) of bulk density (BD), organic content (%), clay content (%) of the mineral soil samples and the thickness of humus layer (cm) in the modelling data set and test data set. N = Number of measurements. | ||||||
| Block | Column | BD g cm–3 | Organic content % | Clay % | Humus layer cm | N |
| Modelling data | ||||||
| 1 | 1.0 | 1.33 (0.07) | 3.5 (1.0) | 5.1 (1.6) | 4 | 4 |
| 2.0 | 1.18 (0.09) | 4.3 (0.8) | 6.5 (1.8) | 4 | 4 | |
| 2 | 3.0 | 0.97 (0.08) | 9.5 (1.3) | 34.6 (3.1) | 2 | 4 |
| 4.0 | 0.91 (0.24) | 11.9 (2.8) | 37.0 (8.3) | 3 | 4 | |
| 3 | 5.0 | 1.14 (0.20) | 7.9 (1.8) | 52.4 (5.5) | 8 | 4 |
| 6.0 | 1.32 (0.20) | 5.7 (2.0) | 43.4 (14.9) | 12 | 4 | |
| All | 1.14 (0.22) | 7.1 (3.4) | 29.8 (19.4) | 5.6 (4.1) | 24 | |
| Test data | ||||||
| 4 | 1.0 | 0.92 (0.13) | 9.7 (1.2) | 50.6 (3.8) | 4 | 12 |
| 2.0 | 0.88 (0.18) | 9.4 (1.2) | 51.3 (2.4) | 3 | 12 | |
| 3.0 | 0.99 (0.07) | 8.5 (0.8) | 44.1 (2.6) | 4 | 12 | |
| 5 | 4.0 | 1.13 (0.11) | 8.3 (2.0) | 22.5 (9.2) | 5 | 12 |
| 5.0 | 1.26 (0.15) | 8.0 (3.1) | 40.5 (13.1) | 11 | 12 | |
| All | 1.03 (0.2) | 8.4 (2.4) | 40.4 (15.3) | 5.2 (3.5) | 84 | |
The means, standard deviations, minimum and maximum values of the main PR variables and VWC in the modelling data by the blocks are presented in Table 3. The mean of the PR in the inorganic layer for the first 10 cm (PR010ms) varied between 0.8 to 1.5 MPa, the minimum and maximum values being 0.324 and 3.491 MPa, respectively. As expected, soil type has clear effect on the mean of VWC and on the variation of the VWC within the inspected time period. The VWC of the first 10 cm of the inorganic layer was from 14.6 to 50.9%, and the mean of all measurements was 30.4%. The variation of the VWC in regard to the day of the year (DOY) is depicted in Fig. 3.
| Table 3. Mean, standard deviation, minimum and maximum values for PR010ms, PR015ms and VWC by block in the Jokioinen data. | ||||
| Block | PR010ms MPa | PR015ms MPa | VWC % | |
| 1 | Mean | 0.848 | 0.956 | 22.8 |
| Std. Deviation | 0.262 | 0.299 | 5.7 | |
| Minimum | 0.470 | 0.542 | 14.6 | |
| Maximum | 1.542 | 1.640 | 40.0 | |
| 2 | Mean | 1.153 | 1.616 | 31.6 |
| Std. Deviation | 0.525 | 0.789 | 8.6 | |
| Minimum | 0.324 | 0.381 | 18.5 | |
| Maximum | 2.891 | 4.190 | 49.8 | |
| 3 | Mean | 1.536 | 1.746 | 36.9 |
| Std. Deviation | 0.593 | 0.617 | 7.5 | |
| Minimum | 0.536 | 0.733 | 19.2 | |
| Maximum | 3.491 | 3.294 | 50.9 | |
| Total | Mean | 1.179 | 1.439 | 30.4 |
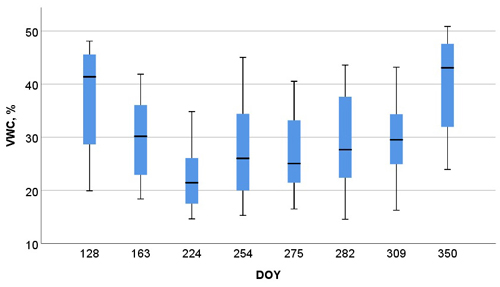
Fig. 3. Box-plot illustration of the VWC by day of the year (DOY). The bottom and top of the box are upper and lower quartiles, and the bolded black line indicates the median, lowest and highest point of the vector minimum and maximum values.
The mean on VWC in the test data is to somewhat higher than that of the modelling data (Table 4). The means of the PR between Tables 3 and 4 cannot be directly compared but the data sets seem have very logical relationship.
| Table 4. Mean, standard deviation, minimum and maximum values for PR010, PR015 and VWC by block in the Vihti data. | ||||
| Block | PR015 MPa | PR020 MPa | VWC % | |
| 4 | Mean | 1.072 | 1.249 | 33.6 |
| Std. Deviation | 0.365 | 0.436 | 8.0 | |
| Minimum | 0.572 | 0.670 | 18.4 | |
| Maximum | 2.296 | 2.588 | 45.3 | |
| 5 | Mean | 0.875 | 1.138 | 39.6 |
| Std. Deviation | 0.153 | 0.212 | 6.6 | |
| Minimum | 0.677 | 0.786 | 26.3 | |
| Maximum | 1.150 | 1.523 | 51.4 | |
| Total | Mean | 1.028 | 1.224 | 34.9 |
| Sampling was not possible in block 5 on the last testing occasion (December) | ||||
The most suitable models for predicting the PR for the first 10 cm and 15 cm of the inorganic soil layer are presented in Table 5 and 6. In both tables two versions of each model is given. Since the block chiefly determines soil properties, block effect as the random parameter tend to change permanent soil properties less significant predictors. As expected, the VWC is clearly the best predictor of PR and this relationship is not linear. The relationship is most efficiently modelled by converting the dependent variable PR to its inverse (InvPR010ms, InvPR015ms). Clay content was modelled as a three class categorical variable: class 1 (clay content < 10%), class 2 (clay content 10–30%) and class 3 (clay content > 30%). Roughly speaking the classification divided the soils into sands, silts and clays. The BD was also found to be an important predictor of PR but not as significant as the VWC.
| Table 5. Mixed regression models predicting PR of the first 10 cm (InvPR = Inverse of PR) of the inorganic soil. | ||||||||
| Model | Model 1 | Model 2 | Model 3 | Model 4 | ||||
| Dependent variable | InvPR010ms | InvPR010ms | InvPR010ms | InvPR010ms | ||||
| Parameter | Estimate (SE) | Sig. | Estimate (SE) | Sig. | Estimate (SE) | Sig. | Estimate (SE) | Sig. |
| Fixed | ||||||||
| Intercept | 0.165 (0.368) | .668 | 0.670 (0.282) | .022 | –0.314 (0.288) | .434 | –0.290 (0.135) | .034 |
| VWC | 0.0336 (0.00289) | .000 | 0.0325 (0.00292) | .000 | 0.0340 (0.00289) | .000 | 0.0333 (0.00292) | .000 |
| BD | –0.446 (0.272) | .114 | –0.912 (0.249) | .001 | - | - | ||
| Three clay classes | ||||||||
| Clay class 1 (<10%) | 0.885 (0.173) | .250 | 0.971 (0.122) | .000 | 0.795 (0.465) | .335 | 0.786 (0.142) | .000 |
| Clay class 2 (10–30%) | 0.340 (0.180) | .074 | 0.506 (0.198) | .019 | 0.179 (0.161) | .281 | 0.175 (0.235) | .464 |
| Clay class 3 (>30%) | 0 | 0 | 0 | 0 | ||||
| ui | 0.0080 (0.125) | .522 | - | 0.138 (0.203) | .678 | - | ||
| vij | 0.0279 (0.0136) | .041 | 0.0417 (0.0184) | .023 | 0.0335 (0.0149) | .024 | 0.0850 (0.0309) | .006 |
| σ2meas | 0.0908 (0.0105) | .000 | 0.0924 (0.0108) | .000 | 0.0897 (0.0103) | .000 | 0.0900 (0.0104) | .000 |
| ρmeas | 0.0267 (0.101) | .791 | 0.0378 (0.102) | .711 | 0.0211 (0.100) | .833 | 0.0280 (0.102) | .784 |
| AIC | 139.1 | 143.3 | 140.7 | 151.6 | ||||
| Table 6. Mixed regression models predicting PR of the first 15 cm (InvPR = Inverse of PR) of the inorganic soil. | ||||||||
| Model | Model 5 | Model 6 | Model 7 | Model 8 | ||||
| Dependent variable | InvPR015ms | InvPR015ms | InvPR015 | InvPR015 | ||||
| Parameter | Estimate (SE) | Sig. | Estimate (SE) | Sig. | Estimate (SE) | Sig. | Estimate (SE) | Sig. |
| Fixed | ||||||||
| Intercept | 0.276 (0.270) | .331 | 0.457 (0.259) | .052 | –0.242 (0.178) | .323 | –0.220 (0.106) | .040 |
| VWC | 0.0263 (0.00238) | .000 | 0.0259 (0.00237) | .000 | 0.0267 (0.00238) | .000 | 0.0261 (0.00239) | .000 |
| BD | –0.483 (0.228) | .049 | –0.643 (0.198) | 003 | - | - | ||
| Three clay classes | ||||||||
| Clay class 1 (<10%) | 0.852 (0.167) | .134 | 0.881 (0.0975) | .000 | 0.754 (0.270) | .213 | 0.746 (0.106) | .000 |
| Clay class 2 (10–30%) | 0.303 (0.160) | .072 | 0.360 (0.158) | .033 | 0.128 (0.146) | .392 | 0.126 (0.174) | .480 |
| Clay class 3 (>30%) | 0 | 0 | 0 | 0 | ||||
| ui | 0.0122 (0.0268) | .648 | - | 0.0431 (0.0678) | .636 | - | ||
| vij | 0.0237 (0.0110) | .031 | 0.0253 (0.0115) | .028 | 0.0287 (0.0123) | .019 | 0.0443 (0.0171) | .010 |
| σ2meas | 0.0594 (0.00716) | .000 | 0.0597 (0.0724) | .000 | 0.0588 (0.00705) | .000 | 0.0591 (0.00716) | .000 |
| ρmeas | 0.0929 (0.103) | .371 | 0.0971 (0.104) | .352 | 0.0902 (0.104) | .383 | 0.0978 (0.105) | .350 |
| AIC | 58.7 | 57.4 | 61.0 | 64.2 | ||||
In predicting the inverse PR for the first 10 cm (InvPR010ms), Model1 in Table 5 can be regarded as having the best fit in terms of AIC. In real life, the BD is very difficult to estimate and an exact definition of BD is prone to bias. For these reasons, the user may end up utilizing Model 3 instead of Model 1 despite its poorer fit.
Models 5 to 8 predicting the PR for the first 15 cm (InvPR015ms) are presented in Table 6 and are similar in structure to models 1 to 4 which are presented in Table 5. Generally speaking, the fit of the models for the first 15 cm (Table 6) is markedly better and the significances of the main predictors are stronger than the models for the first 10 cm (Table 5). Fig. 4 illustrates the modelled strength of the soil in relation to the VWC (with a constant BD of 0.9 g cm –3), and Fig. 5 shows the contribution of BD (with a constant clay class 3).
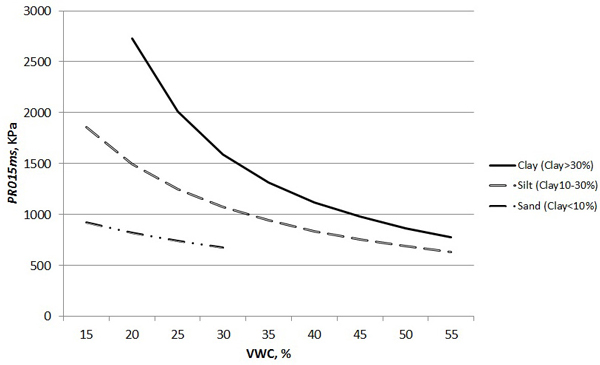
Fig. 4. The PR of the soil for the first 15 cm below the surface of the inorganic soil (model 5 from Table 6) by VWC and clay content (BD constant 0.9 g cm–3).
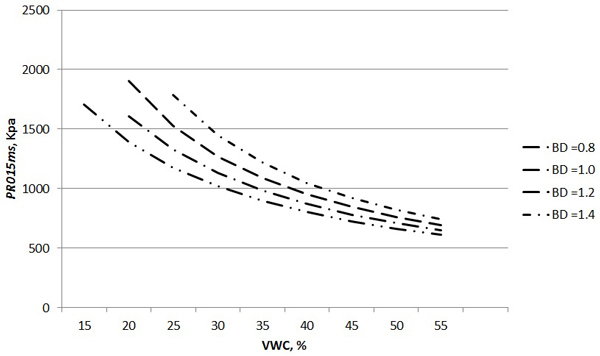
Fig. 5. The PR of the soil for the first 15 cm below the surface of the inorganic soil (model 5 from Table 6) by VWC and BD (Clay class 3).
The accuracy of the models is summarized in Table 7 and the residuals of the predicted values of PR of the first 20 cm versus the measured ones are illustrated in Fig. 6. No significant bias was found. The highest biased was found in the case when PR of the first 20 cm was predicted without information on BD. Mean absolute error of roughly 20% was found which may be regarded as acceptable taken into account the character of the penetrometer tool.
| Table 7. Accuracy of the PR models in terms of bias and mean absolute error (MAE). Error is a result of the predicted value subtracted with the measured value. | ||||||||
| Variable | Models utilized | Predictors | Bias | 95% confidence interval for Bias | MAE | |||
| kPa | % | kPa | kPa | % | ||||
| PR0est15 | Model 1 and Model 9 | Clay class (2 or 3), VWC and BD | –59 | –5.9 | –130 | 11 | 191 | 19.1 |
| PRest015 | Model 3 and Model 5 | Clay class (2 or 3) and VWC | –0.1 | –0.01 | –88 | 88 | 220 | 22.0 |
| PRest020 | Model 5 and Model 10 | Clay class (2 or 3), VWC and BD | 11 | 1.0 | –70 | 93 | 225 | 18.8 |
| PRest020 | Model 7 and Model 10 | Clay class (2 or 3) and VWC | 115 | 9.6 | –2 | 232 | 286 | 23.9 |
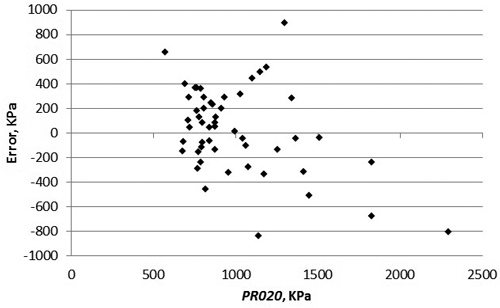
Fig. 6. Residuals of the predictions of the PR of first 20 cm above the ground surface constructed with models 5 and 10. Error is a result of the predicted value subtracted with the measured value.
4 Discussion and conclusions
A literature review showed that PR measurements have been carried out with many types of cones. For instance, Ayers and Perumpral (1982), Busscher (1990), Canarache (1990) and Smith et al. (1997) used different types of cone shapes in their tests. Our measurements followed the ASAEBE S313.3 standard with the exception that the standard recommends 30-degree cone instead of a 60-degree cone. We assume that in this kind of forest soil cone shape has rather minor affect. Our own comparisons with 30-degree cone and 60-degree cone justify us to believe so. Our results are also in line in terms of mean and deviation of PR with numerous previous papers (e.g. Ayers and Perumpral 1982; Busscher 1990; Canarache 1990 and Smith et al. 1997). It looks that 30-degree cone is very often used in till soils where soils are less hard whereas 60-degree cone is more often used in forest and geotechnical research fields. Future testing of the effect of the cone shape would make our findings more versatile. The Eijkelkamp penetrometer used in our tests was found to be trustworthy and produced very consisted results in fairly homogenous fine-grained soils. The measurements were performed on two test areas that were further dived into blocks, columns, sub-columns and sampling points. Since this study arrangement has a hierarchical structure, we utilized a mixed-modelling technique to construct widely applicable regression models. In our view, the technique chosen can be regarded as highly suitable for similar test arrangements.
Our results based on a large data set of 192 measurements confirm previous findings (Ayers and Perumpral 1982; Witney et al. 1984; Canarache 1990; Smith et al. 1997; Vaz et al. 2002; Dexter et al. 2007) that PR is controlled by moisture content, clay content and bulk density. Although the influence of organic content in mineral soil on PR has been shown earlier, at least with smaller clay contents (Smith et al. 1997), organic content was not found to be significant in our analyses. The main reason was that the organic content had rather a small variation. While bulk density is too laborious to measure in practice prior to forest operations, models including VWC as the main predictor (Model 3 from Table 5 and Model 7 from Table 6) can be regarded as the most appropriate for practical solutions. The accuracy of the models created was tested with independent data. The models may be regarded liable, since no significant bias was found. Mean absolute error was roughly 20%. This can be regarded as acceptable since the penetrometer tool measures only one single point in the ground and soil properties may possess significant amount of spatial variation even within a small area.
Saarilahti (2003) has proved that the first 15 cm below the surface is the most crucial part of the soil from trafficability point of view. In fully saturated silty and clayey soils, the PR of the first 15 cm can be as low as 600–800 kPa. This means that the strength of the soil is almost as weak the organic layer on top of the mineral soil, the thicknesses of which typically varies between 2–12 cm and the mean being roughly 5 cm. In dry, silty, and clayey soils the PR of the first 15 cm can increase up to 2–3 MPa. Our data showed a very steep increase in the PR 15 to 20 cm below the ground, especially in the study plots with high clay contents. This can be explained by lower levels of moisture content since clayey soils are poorly permeable to water. In homogenous sandy soils, the PR is typically 700–800 kPa and is mostly independent of the moisture content.
The mean values for the PR and outcomes of the models developed agree well with the earlier investigations carried out in forest soils (Smith et al. 1997; Anttila 1998; Eliasson 2005; Poršinsky et al. 2006; Sakai et al. 2008; Ampoorter et al. 2010). They all report the minimum values of forest soils to be in range of 600–800 kPa, with the mean values of typical forest soils ranging between 1000–1500 kPa. Our models seem also give similar values compared to investigations carried out on arable farms. The results confirm that strength of silty and clayey forests are similarly affected by moisture content to the earlier findings from agricultural fields and temperate zone forests.
Forest machines are today rather heavy and may cause significant soil deformations providing forest operations are not well planned. When the weight induced by the vehicle exceeds the bearing capacity of the soil, the soil begins to compact and re-mold. Significant outweigh of the soil bearing capacity leads to rutting, where soil particles are displaced in both vertical and horizontal direction. Both rutting and compaction are problematic to future forest growth. Successful timing of the operation is the key element in avoiding significant soil disturbances; moisture sensitive soils should be harvested during dry or frozen periods.
The models developed in this paper quantify the significance of soil water on the PR of forest soil. The models are valid on fine-grained (i.e. clayey and silty) and sandy soils. The models are not valid for medium-grained or coarse-grained moraine soils that are generally considered to have good bearing capacity. The models developed can be linked to mobility models predicting either risks of rutting or compaction, rolling resistance and thrust. A large summary of the models that can be applied together with the PR measurements is presented by Saarilahti (2003). Given that soil properties – soil strength (PR) relationship can be predicted with a methodology presented in this study, rut estimates may then be derived with empirical formulas describing interaction between soil and wheel. The WES methodology is based on empirically created, non-dimensional wheel numerics which relate the measured PR to the load carried out by tyre and main tyre dimensions (Saarilahti 2003). Vega-Nieva et al. (2009) applied the WES method with the formulas and empirical parameters suggested in the ECOWOOD project (Turnage 1984; Saarilahti 2003) and found out that they produce trustworthy results. Utilizing two different model structures to derive ruts based on soil properties work well both with peatlands as well as with most fine-grained and coarse-grained mineral soils. However, PR predicts rutting poorly in sandy soils. In sandy soils penetrometer penetrates easily to the soil, but in reality the strength of soil with mainly frictional properties increases when subjected to vehicular loading. While spatial hydrological modelling is taking significant steps forwards, the risk of soil damage in forest operations may be in the future managed by utilising modular moisture content – PR – rutting model structures , such as the one proposed by Vega-Nieva et al. (2009).
Acknowledgements
The field experiments were done under the research project “Enhancing timber harvesting on sensitive sites”, carried out at the Natural Resources Institute Finland. Modelling and writing was completed under the research project EFFORTE that receives funding from the Bio Based Industries Joint Undertaking under the European Union’s Horizon 2020 research and innovation program – grant agreement No 720712.
References
Alakukku L., Weisskopf P., Chamen W.C., Tijink F.G., van der Linden J., Pires S., Sommer C., Spoor G. (2003). Prevention strategies for field traffic-induced subsoil compaction: a review. Soil and Tillage Research 73(1–2): 145–160. https://doi.org/10.1016/S0167-1987(03)00107-7.
Ampoorter E., Van Nevel L., Hermy M., Verheyen K. (2010). Assessing the effects of initial soil characteristics, machine mass and traffic intensity on forest soil compaction. Forest Ecology and Management 260(10): 1664–1676. https://doi.org/10.1016/j.foreco.2010.08.002.
Anttila T. (1998). Metsämaan raiteistumisen ennustaminen WES-menetelmää käyttäen. University of Helsinki, Department of forest resource management. Publications 17. 53 p. ISBN 951-45-8025-7.
Ayers P.D., Perumpal J.V. (1982). Moisture and density effect on cone index. Transactions of the ASAE 25(5): 1169–1172. https://doi.org/10.13031/2013.33691.
Busscher W.J. (1990). Adjustment of flat-tipped penetrometer resistance data to a common water content. Transactions of the ASAE 33(2): 519–524. https://doi.org/10.13031/2013.31360.
Busscher W.J., Bauer P.J, Camp C.R., Sojka R.E. (1997). Correction of cone index for soil water content differences in a coastal plain soil. Soil and Tillage Research 43(3–4): 205–217. https://doi.org/10.1016/S0167-1987(97)00015-9.
Bygden G., Eliasson L., Wästelund I. (2003). Rut depth, soil compaction and rolling resistance when using bogie tracks. Journal of Terramechanics 40(3): 179–190. https://doi.org/10.1016/j.jterra.2003.12.001.
Cambi M., Certini G., Neri F., Marchi E. (2015). The impact of heavy traffic on forest soils: a review. Forest Ecology and Management 338: 124–138. https://doi.org/10.1016/j.foreco.2014.11.022.
Canarache A. (1990). PENETR – a generalized semi-empirical model estimating soil resistance to penetration. Soil and Tillage Research 16(1–2): 51–70. https://doi.org/10.1016/0167-1987(90)90021-5.
Dexter A.R., Czyz E.A., Gate O.P. (2007). A method for prediction of soil penetration resistance. Soil and Tillage Research 93(2): 412–419. https://doi.org/10.1016/j.still.2006.05.011.
EEA (2013). Adaptation in Europe – addressing risks and opportunities from climate change in the context of socio-economic developments. EEA Report No 3/2013, European Environment Agency, Copenhagen, Denmark.
Elbanna E.B., Witney B.D. (1987). Cone penetration resistance equation as a function of the clay ratio, soil moisture content and specific weight. Journal of Terramechanics 24(1): 41–56. https://doi.org/10.1016/0022-4898(87)90058-9.
Eliasson L. (2005). Effects of forwarder tire pressure on rut formation and soil compaction. Silva Fennica 39(4): 549–557. https://doi.org/10.14214/sf.366.
Freitag D.R. (1987). A proposed strength classification test for fine-grained soils. Journal of Terramechanics 24(1): 25–39. https://doi.org/10.1016/0022-4898(87)90057-7.
Goutal N., Keller T., Défossez P., Ranger J. (2013). Soil compaction due to heavy forest traffic: measurements and simulations using an analytical soil compaction model. Annals of Forest Science 70(5): 545–556. https://doi.org/10.1007/s13595-013-0276-x.
GTK (2018). Geological survey of Finland/Map services. http://en.gtk.fi/informationservices/map_services/.
Heinonen J. (1994). KPL - koealojen puu- ja puustotunnusten laskentaohjelman käyttöohje. The Finnish Forest Research Institute, Research Papers 504. 80 p. http://urn.fi/URN:ISBN:951-40-1369-7. [In Finnish with English summary].
Hummel J.W., Ahmad I.S., Newman S.C., Sudduth K.A., Drummon S.T. (2004). Transactions of the ASAE 47(3): 607–618. https://doi.org/10.13031/2013.16090.
Karafiath L.L., Nowatzki E.A. (1978). Soil mechanics for off-road vehicle engineering. Trans Tech Publications. Clausthal, Germany. ISBN 0-87849-020-5.
Labelle E.R., Jaeger D. (2011). Soil compaction caused by cut-to length forest operations and possible short-term natural rehabilitation of soil density. Soil Science Society of America Journal 75(6): 2314–2329. https://doi.org/10.2136/sssaj2011.0109.
Miyamoto T., Fukami K., Chikushi (2012). Simultaneous measurement of soil water and soil harness suing a modified time domain reflectometry probe and a conventional cone penetrometer. Soil Use and Management 28(2): 240–248. https://doi.org/10.1111/j.1475-2743.2012.00391.x.
Murphy G., Brownlie R., Kimberley M., Beets P. (2009). Impacts of forest harvesting related soil disturbance on end-of-rotations wood quality and quantity in a New Zealand Radiata pine forest. Silva Fennica 43(1): 147–160. https://doi.org/10.14214/sf.221.
Poršinsky T., Sraka M., Stankić I. (2006). Comparison of two approaches to soil strength classifications. Croatian Journal of Forest Engineering 27: 17–26.
Saarilahti M. (2003). Soil interaction model. In: Haarlaa R., Salo J., (eds.). ECOWOOD studies made at the University of Helsinki. University of Helsinki, Faculty of Agriculture and Forestry, Department of Forest Resource Management. Publications 31. http://ethesis.helsinki.fi/julkaisut/maa/mvaro/publications/31/.
Sakai H., Nordfjell T., Suadicani K., Talbot B., Bøllehuus E. (2008). Soil compaction on forest soils from different kinds of tires and tracks and the possibility of accurate estimate. Croatian Journal of Forest Engineering 29: 15–27.
Smith C.W., Johnston M.A., Lorentz S. (1997). The effect of soil compaction and soil physical properties on the mechanical resistance of South African forestry soils. Geoderma 78(1–2): 93–111. https://doi.org/10.1016/S0016-7061(97)00029-3.
Turnage G.W. (1984). Prediction of in-sand tire and wheeled vehicle drawbar performance. In: Proceedings of the 8th International ISTVS Conference, 6–10 July 1984, Cambridge, UK.
Uusitalo J., Ala-Ilomäki J. (2013). The significance of above-ground biomass, moisture content and mechanical properties of peat layer on the bearing capacity of ditched pine bogs. Silva Fennica 47(3) article 993. https://doi.org/10.14214/sf.993.
Uusitalo J., Salomäki M, Ala-Ilomäki J. (2015). Variation of the factors affecting soil bearing capacity of ditched pine bogs in Southern Finland. Scandinavian Journal of Forest Research 30(5): 429–439. https://doi.org/10.1080/02827581.2015.1012110.
Vaz C.M.P., Bassoi L.H., Hopmans J.W. (2001). Contribution of water content and bulk density to field soil penetration resistance as measured by a combined cone penetrometer – TDR probe. Soil and Tillage Research 60(1–2): 35–42. https://doi.org/10.1016/S0167-1987(01)00173-8.
Vaz C.M.P., Manieri J.M., de Maria I.C., Tuller M. (2011). Modelling and correction of soil penetration resistance for varying soil water content. Geoderma 166(1): 92–101. https://doi.org/10.1016/j.geoderma.2011.07.016.
Vega-Nieva D., Murphy P.N.C., Castonguay M., Ogilvie J., Arp P.A. (2009). A modular terrain model for daily variations in machine-specific forest soil trafficability. Canadian Journal of Soil Science 89(1): 93–109. https://doi.org/10.4141/CJSS06033.
Wästerlund I. (1985). Compaction of till soils and growth tests with Norway spruce and Scots pine. Forest Ecology and Management 11(3): 171–189. https://doi.org/10.1016/0378-1127(85)90025-8.
Wästerlund I. (1989). Strength components in the forest floor restricting maximum tolerable machine forces. Journal of Terramechanics 26(2): 177–182. https://doi.org/10.1016/0022-4898(89)90005-0.
Westman C.J. (1990). Metsämaan fysikaaliset ja fysikaalis-kemialliset ominaisuudet CT-OMaT kasvupaikkasarjassa. [Soil physical and physico-chemical properties of Finnish upland forest sites]. Silva Fennica 24(1): 41–158. https://doi.org/10.14214/sf.a15568. [In Finnish with English summary].
Witney B.D., Elbanna E.B., Erdat Oskui K. (1984). Tractor power selection with compaction constraints. Proceedings of the 8th ISTVS Conference, Cambridge, England, 6–10 August, 1984. II: 761–773.
Total of 36 references.
Send to email
