Tore Skrøppa  ,
Arne Steffenrem
,
Arne Steffenrem
Genetic variation in phenology and growth among and within Norway spruce populations from two altitudinal transects in Mid-Norway
Skrøppa T., Steffenrem A. (2019). Genetic variation in phenology and growth among and within Norway spruce populations from two altitudinal transects in Mid-Norway. Silva Fennica vol. 53 no. 1 article id 10076. https://doi.org/10.14214/sf.10076
Highlights
- Norway spruce populations distributed along each of two altitudinal transects showed strong clinal relationships between the annual mean temperatures of the sites of the populations and height and phenology traits in short term tests and height in field trials
- Large variation was present among families within populations for height and phenology traits and with a wider range within than among populations
- Correlation patterns among traits were different for provenances and families.
Abstract
Progenies from open pollinated cones collected in natural populations of Norway spruce (Picea abies (L.) Karst.) distributed along two altitudinal transects in Mid-Norway were tested in the nursery, in short term tests and in long-term field trials. The populations showed clinal variation related to the mean annual temperatures of the populations, with the earliest bud flush and cessation of shoot elongation and lowest height at age nine years for the high altitude populations. Within population variation was considerable as the narrow sense heritability for these traits was 0.67, 0.31 and 0.09 in one transect and 0.55, 0.18 and 0.14 in the other transect, respectively. Lammas shoots occurred in the short term trials with large variation in frequency between years. There was significant family variation for this trait, but also interactions between populations and year. The variance within populations was considerably larger in the populations from low altitude compared to the high-altitude populations. Significant genetic correlations between height and phenology traits and damage scores indicate that families flushing early and ceasing growth late were taller. Taller families also had higher frequencies of damages. Selection of the top 20% families for height growth in short term tests at age nine years gave a simulated gain of 11% increased height growth at age 18 years in long term trials at altitudes similar to those of origin of the populations. The gain was negative when high altitude populations were selected based on testing in the lowland.
Keywords
Picea abies;
adaptation;
tree breeding;
height;
clinal variation;
populations;
families;
bud flush
-
Skrøppa,
Norwegian Institute of Bioeconomy Research, P.O. Box 115, 1431 Ås, Norway
E-mail
tore.skroppa@nibio.no
- Steffenrem, E-mail as@nn.no
Received 20 November 2018 Accepted 8 March 2019 Published 14 March 2019
Views 168576
Available at https://doi.org/10.14214/sf.10076 | Download PDF

1 Introduction
Norway spruce (Picea abies (L.) Karst.) has its north-western distribution in the central and northern part of Norway, a region where the glacial and postglacial history of the species has been intensively debated based on evidences from palaeodata and from modern and ancient DNA (Giesecke and Bennett 2004; Latalowa and van der Knaap 2006; Kullman 2008; Parducci et al. 2012a, 2012b; Birks et al. 2012). Based on pollen data, Norway spruce established approximately 3000 years ago in the region (Giesecke and Bennet 2004; Latalowa and van der Knaap 2006), and based on pollen data and genetic data combined, Norway spruce in the region originate from a refugium located on the Russian plain (Tollefsrud et al. 2008). Recently, however, analyses of ancient DNA in lake sediments suggest that Norway spruce also was present in the Mid-Norway (Trøndelag County) already 10 300 year ago (Parducci et al. 2012 a). The genetic variation among and within the present Norway spruce populations in this region will be influenced by their evolutionary history and the adaptive processes that have taken place, in particular related to the northern climatic constraints. No studies have so far been made presenting the patterns of variation of phenotypic traits based on measurements in trials in the region.
During the last 30 years a number of studies have shown that Norway spruce in the boreal region can adjust its adaptive phenology by a rapid and most likely epigenetic mechanism, through a kind of a long-term memory of the climatic conditions during the seed maturation period (summarized in: Johnsen et al. 2009). Phenology and hardiness of progenies are influenced in a way such that seed production in a cold environment advances bud set and cold acclimation in the autumn as well as dehardening and flushing in the spring, whereas a warm reproductive environment delays the timing of these events. In a recent study, Solvin and Steffenrem (2019) have performed experiments with Norway spruce provenances from seed lots produced in years with different temperatures. They show that trees from warm seed years had later bud flush, bud set and growth cessation. It has been suggested that these effects contribute, together with directional selection, to the steep clinal variation observed in adaptive traits in Norway spruce (Johnsen and Skrøppa 2000; Skrøppa et al. 2007).
A few provenance studies have provided information about variation in quantitative traits in Norway spruce provenances from Mid-Norway in comparison with provenances from more southern Norwegian origins or from the wide natural range of the species. Norway spruce provenances from Mid-Norway were included in two international IUFRO trials and showed high mortality and inferior growth when they were planted at more southern latitudes (Langlet 1960; Fottland and Skrøppa 1989; Persson and Persson 1992). Two other studies were performed with a representative set of provenances from the north-western region, tested at sites in Mid- and North-Norway. These showed clinal variation related to provenance latitude and altitude for phenology and growth traits (Bergan 1994; Skrøppa and Steffenrem unpublished). Only one study (Dietrichson 1969) has characterized variability both among and within populations from Mid-Norway, based on four open-pollinated families from each of four populations, tested in southern Norway. It showed significant variation both within and among populations for phenology traits and height growth at the age of four years. In that limited material the variation within and among populations was lower than within and among 11 populations from southern Norway. Clinal variation in adaptive traits with latitude and altitude has been demonstrated in several studies with Norway spruce provenances from a wide latitudinal range in the Nordic countries (Dietrichson 1969; Krutzsch 1975; Dæhlen et al. 1995), and from altitudinal transects in Central Europe (Holzer 1993; Skrøppa and Magnussen 1993; Modrzynski 1995; Oleksyn et al. 1998). In Sweden, the clinal variation among provenances is stronger in the northern than in the southern part of the country (Danusevicius and Person 1998).
The objective of this study was to characterize the patterns of variation of phenology and growth traits among and within populations of Norway spruce along two altitudinal transects in Mid-Norway. Results are presented from three types of trials with the same materials: early tests in nurseries, short term trials on former agricultural land, and long term field trials. The study provides information about the relationships between traits measured at different ages for populations and families. Further objectives were to demonstrate the response in long term field trials when selection for height growth is made in the short term trials and to provide information about the potential gain from selection in these for the breeding programme for Norway spruce in Mid-Norway. It is the first study presenting variation among and within spruce populations from Mid-Norway from trials located in the region.
2 Materials and methods
2.1 Seed collection
In 1992, cones were collected in four natural Norway spruce populations in the southern part of Trøndelag County (Mid-Norway), close to latitude 63°N and between altitudes 300–630 m, and in eight populations in the northern part of Trøndelag, close to latitude 64°N and between altitudes 30–600 m (Fig. 1). The distance between the most remote populations was 78 km in the first and 146 km in the second collection. These two collections will be referred to as the southern and northern transect. The intention was to obtain seeds from 15 randomly chosen trees in each population. Some trees, however, in particular in populations close to the altitudinal tree limit, did not produce enough filled seeds for their offspring to be included in further trials. Only one family remained from the population at 600 m in the northern transect and this population was excluded from the study. The seed lots from each tree were kept separate to allow for characterization of variability among half-sib families within populations.
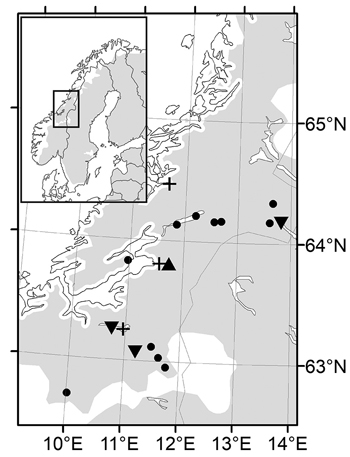
Fig. 1. Maps of the Nordic range of Norway spruce (left) and magnified Mid-Norway region with sampled populations (dots), nursery trial (triangles), short term trials (plus signs) and long term trials (turned triangles).
Daily mean temperatures for 1 × 1 km grid cells in Mid-Norway were obtained from the Norwegian Meteorological Institute (sharki.oslo.dnmi.no/) for long-term annual mean temperature for the reference period 1961–1990 and for the seed year 1992. Average temperature values for nearby grid cells with approximately same altitude as the actual populations where cones were collected were used to model temperature profiles for these sites, as described by Solvin and Steffenrem (2019). For the long-term temperatures, the annual means for the period 1961–1990 varied between 0.7 and 5.1 °C, and the mean temperatures for 1992 of the three months July, August and September, covering the seed maturation period, varied from 9.4 to 12.2 °C. The annual mean temperatures were closely related to the altitude in each transects, with Pearson correlations coefficients r = –0.77 in the southern and r=–0.96 in the northern transect.
2.2 Nursery trial
Filled seeds from 136 families from 11 populations were sown and germinated in multipot containers at Stiklestad Nursery (63°48´N, 11°33´E, altitude 45 m) in the last week of May 1995. The experimental design was four replicates (blocks), each with 41–42 sown seed per family plot. The cultivation followed standard nursery routines as regards watering and fertilization. Starting from August 17 the same year, each seedling in three replicates was visually examined for visible apical bud. This was done once a week until September 6. The accumulated percentage of seedlings with bud was calculated per plot for each of the four assessments.
2.3 Short term trials
Three short terms trials were planted on former cultivated fields in 1997 with the two-year-old seedlings (Fig. 1). One trial “Selbu” (63°15´N, 10°48´E, altitude 240 m) was established in the southern part of Trøndelag with the 55 families from the four populations in the southern transect. The 81 families from seven populations from the northern transect were planted at two sites, Stiklestad, the same site as the nursery, and Kvatninga (64°28´N, 11°39´E, altitude 15 m), both located in northern Trøndelag. The experimental design was randomized single tree plots with 30 replicates at 1m spacing at all sites.
Measurements were made of tree heights in the trials at ages 6 and 9 years. At the same time, each tree was scored for “stem damage”: occurrence of double stems, spike knots or other visible stem damage. The stage of terminal bud flush was scored according to the Krutzsch scale (Krutzsch 1973) at one occasion at the beginning of each of growing seasons six and eight. At Selbu and Stiklestad, the leader shoot length was measured at one date close to the termination of shoot elongation (June 30), and a second time after shoot growth cessation. The percentage of elongation attained at the first date will be used a measure of the timing of leader shoot growth cessation. Lammas shoots occurred at Stiklestad and Kvatninga, and assessments were made of such occurrence with more than 2 cm shoot extension on leader, at ages six, eight and nine years at Stiklestad and ages six and nine years at Kvatninga.
2.4 Field trials
From both transects, northern and southern, field trials were planted at three forest sites in Trøndelag County, between altitudes 240 and 400 m, the same year as the short term trials were established (Fig. 1). From families with sufficient number of vital seedlings, a sample of 2–4 seedlings was pooled to represent the population. Seedlings were planted in single tree plots with one tree from each population per replicate in 40 blocks at 2 m spacing. Thus, the population is the experimental unit, although family identity was kept for individual trees. Measurements of tree height and diameter were made 16 years after planting at age 18 years from seed, and assessments of double stems and spike knots were made at the same time.
2.5 Statistical analyses
To obtain more normal distributions and homogeneity of variances, transformations of some traits were made before analyses of variance were performed. The bud set percentage per plot and the shoot growth percentage of individual trees were transformed by the arcsine square root transformation. The scoring of bud flush (classes), lammas growth and damage (binary observations) were transformed to normal scores, within blocks and sites, by the Blom method (PROC RANK, SAS Institute 2003).
All statistical analyses were performed with procedures in SAS (SAS Institute 2003) using PROC GLM, PROC VARCOMP and PROC MIXED for analyses of variance and estimation of variance components. In the analyses of variance, populations were considered as fixed effects as they in each transect were sampled along altitudinal gradients at approximately the same latitude. Families were considered as random and it was assumed that there were similar levels of variance within each population.
Analyses of variance of traits measured in the nursery trial and the short term trial at Selbu (southern transect) were made based on the model 1:
![]()
here Yijk is the is the observed value for the family j from population i block k, µ is the grand mean, P is the fixed effect of population, F the random effect of family, B is the effect of block and E is the residual error. The random effects were assumed to be normal and independently distributed with expectation zero and variance components σ2F, σ2B and σ2E, respectively.
In the combined analyses of measurements from Stiklestad and Kvatninga (northern transect) a fixed effect of site (S), its fixed effect of the interaction with populations (SP) and random effect of interaction with families (SPF) were added. The block effect was then nested within site, and the analyses were based on the model 2:
![]()
The model for the analyses of the field trials (model 3) included sites, populations from both transects, site-by-population interactions and blocks nested within sites, in addition to the residual error:
![]()
Variance components were estimated for the random effects, and p-values of the appropriate F-tests are presented. The narrow sense heritability estimates of bud set and the traits at Selbu were estimated as h2 = 3σ2F/(σ2F + σ2E), assuming that the family variance component approximately equals one third of the additive genetic variance as open-pollinated progenies are more closely related than half-sibs (Squillace 1974). In the combined analyses of Stiklestad and Kvatninga, the site-by-family interaction was included in the denominator of the heritability estimate. Its standard error was calculated by the Taylor expansion for variances of ratios (Lynch and Walsh 1998) in SAS/IML. In the short term trials, genetic correlations between height, bud flush and shoot elongation and their standard errors were estimated by calculations made in SAS/IML based on the output from multivariate analyses in PROC MIXED (Holland 2006). Family breeding values were estimated and used to study “genetic” Pearson-correlations between bud set in the nursery and field data, and between traits that caused convergence problems (e.g. damages) in the multivariate analysis in PROC MIXED.
Pearson correlation coefficients were calculated between population means of traits measured in the short term trials and the long-term mean and 1992 mean of months July to September at each population locality, and also between traits and altitude and mean annual temperatures of the populations.
2.6 Estimation of potential gain from selection for height based on short term testing
In the national breeding strategy of Norway spruce, two breeding zones are defined for Mid-Norway; low altitude zone below 250 m altitude, and high altitude zone above 250 m altitude (Edvardsen et al. 2017). The families from the populations in Trøndelag were assumed to belong to three subsets of populations, below or above altitude 250 m, in the two breeding zones, containing the families from four, four and three populations, respectively. For each of these subsets the 20% tallest families were selected based on predicted BLUP family values for tree height at age nine years measured in the short term trials. Least square (LS) means of families were calculated from the measurements in the field tests, and the mean values of the trees from selected families were compared to the means of all families in the subset.
3 Results
3.1 Variation in bud set in both transects
The mean percentages of seedlings with visible terminal buds at the end of the first growth season were 7.4%, 67.8%, 99.0% and 100% at the four dates August 17th, 23rd, 31st and September 6th, respectively. The variation among the populations was largest for those from the northern transect which also have the widest range in altitude, from 20 to 500 m. The populations from the highest altitudes in the northern transect were the first to set bud, and those from low altitudes were the latest. A strong relationship was present between the bud set percentages and the mean annual temperature of the population sites with correlation coefficients r = –0.80 and r = –0.92 the southern and northern transect, respectively (Fig. 2). Significant variation among families was present within all populations, with a range on August 23rd from 27 to 81% in the population from 50 m altitude with the lowest mean value, and from 51 and 100% in the population from 400 m altitude with the highest mean, both populations from the northern transect. The estimate of the heritability based on plot means was 0.54 and 0.53 (Table 1), respectively.
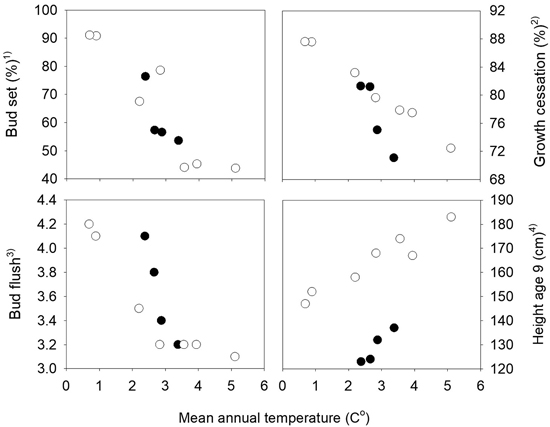
Fig. 2. Norway spruce populations from Mid-Norway. Relationships between the long-term annual mean temperatures at the population sites and population means of bud set, bud flush, growth cessation and height at age nine years. Black circles denote the southern and white circles the northern transect populations. 1) Bud set assessed in the common nursery trial at Stiklestad, 2) Growth cessation measured in the short term trials at Selbu and Stiklestad, 3) Bud flush assessed at Selbu and at Stiklestad and Kvatningen, 4) Height measured at Selbu and at Stiklestad and Kvatningen.
| Table 1. Norway spruce populations and families from Mid-Norway. Analyses of variance of transformed proportion of seedlings with apical bud measured in the nursery at August 23 in the nursery (Stiklestad). Shown are estimates of variance components, p-values and heritabilities at plot level (standard error in parentheses). | ||||
| Southern transect populations | Northern transect populations | |||
| Variance | p-value | Variance | p-value | |
| Populations | 0.013 | < 0.0001 | ||
| Families (populations) | 0.016 | 0.0003 | 0.015 | <0.001 |
| Blocks | 0.128 | <0.0001 | 0.032 | 0.001 |
| Populations × blocks | 0.004 | 0.028 | 0.009 | <0.0001 |
| Error | 0.037 | 0.031 | ||
| Heritability | 0.54 (0.17) | 0.53 (0.18) | ||
3.2 Variation in the short term trials
3.2.1 Populations from the southern transect tested at Selbu
At age nine years, the mortality was 21% at Selbu, and the mean height was 127 cm. Significant differences were present both among and within populations for height, the bud flushing scores and shoot growth cessation (Table 2). The trees from the populations from the lowest altitudes 300 and 400 m were the tallest; they had a latest bud flush in the spring and the latest cessation of leader growth (Fig. 3a). However, as the range of variation among families within populations was wide and there was overlap in the genetic variation among all populations for these traits (Fig. 3a). The estimate of heritability was as low as 0.09 for height at the age nine years, but was much higher for bud flush (h2 = 0.67) and shoot growth cessation (h2 = 0.32). For damage scores, the differences both among and within populations were small, and the heritability was low (Table 2). The frequency of lammas shoots was negligible in this trial.
| Table 2. Norway spruce populations and families from Mid-Norway. Analyses of variance of traits measured in the short term trial at Selbu. Shown are estimates of variance components for random effects, p-values from the F-test and heritabilities (standard error in parentheses). | ||||||||
| Height age 9 | Bud flush 1) age 8 | Growth cessation 2) age 9 | Damage age 9 | |||||
| Variance | p-value | Variance | p-value | Variance | p-value | Variance | p-value | |
| Populations | 0.0004 | 0.0017 | 0.0009 | 0.92 | ||||
| Families (populations) | 33.68 | <0.0001 | 0.18 | <0.0001 | 0.0028 | <0.0001 | 0.008 | 0.04 |
| Blocks | 298.60 | <0.0001 | 0.0013 | <0.0001 | ||||
| Error | 1086.105 | 0.64 | 0.0233 | 0.500 | ||||
| Heritability | 0.09 (0.04) | 0.67 (0.12) | 0.32 (0.09) | 0.05 (0.03) | ||||
| 1) Scored according to Krutzsch (1973). 2) Proportion of growth accomplished at June 30. | ||||||||
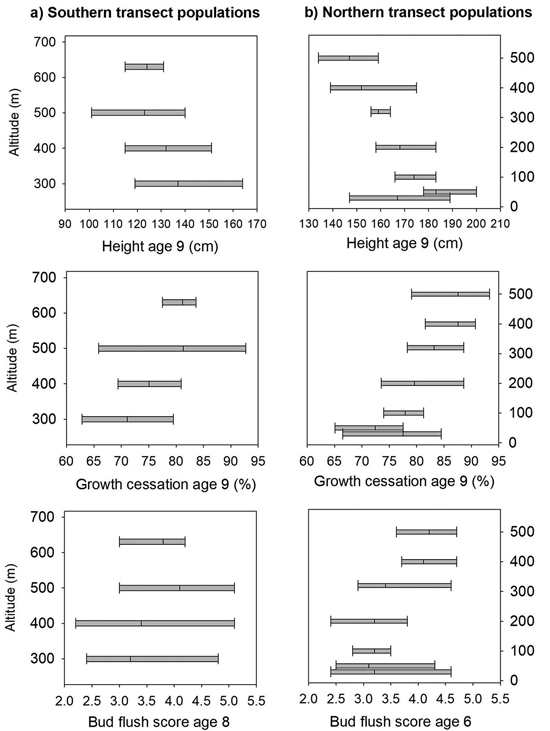
Fig. 3. Norway spruce populations and families from Mid-Norway. Means and range of variation shown for height, shoot growth cessation and bud flush score in the short term trials for the southern (a) and northern transect populations (b), ranked according to altitude.
Quite strong and positive genetic correlations were estimated between the timing of bud flush and growth cessation (Table 3). The last trait was negatively correlated to height, showing that the best growing families had the latest termination of shoot growth. A significant positive genetic correlation (Table 3) was present between damage and height, showing that the tallest families within each population tended to have a higher frequency of damaged trees. It is remarkable that no genetic relationships were present between bud set at the end of the first growth season and any of the traits measured in the short term test (Table 3).
| Table 3. Norway spruce families from Mid-Norway. Estimates of genetic correlations (with standard errors or p-values) for traits measured in the short term trial at Selbu. P-values are given when inferences are based on Pearson-correlations between BLU-predicted breeding values. | ||||
| Bud flush | Growth cessation 1) | Damage | Bud set 2) | |
| Height | 0.20 (0.23) | –0.46 (0.21) | 0.38 (p = 0.004) | –0.08 (ns) |
| Bud flush | 0.65 (0.12) | 0.18 (ns) | –0.05 (ns) | |
| Growth cessation | –0.10 (ns) | 0.03 (ns) | ||
| Damage | 0.07 (ns) | |||
| 1) Proportion of shoot growth accomplished at June 30. 2) Measured in the nursery (Stiklestad). | ||||
At the population level, strong relationships were present between height and the timing of bud flush and growth cessation with absolute values of correlation coefficients higher than 0.90 (not shown). These correlations were closely related to the relationships present between the annual mean temperature of the populations and height, growth cessation and bud flush, as shown in Fig. 3. The general pattern was that lower altitude populations with the highest mean temperatures were flushing and ceasing growth later, and grew taller. The correlation coefficients between the traits and the mean temperatures of the months July, August and September of the seed year 1992 were lower than those based on the mean annual mean temperatures.
3.2.2 Northern transect populations tested at Stiklestad and Kvatninga
The mortality was 30% at Stiklestad and 1% at Kvatninga at age nine years, and the mean heights at were 171 and 160 cm, respectively. Population means of height across the two sites ranged from 148 cm to 183 cm, and the trees from the lowland populations were on average taller than those from higher altitudes (Fig. 3b). In the analysis of variance, significant variation for height at age nine years was found both among populations and among families within populations (Table 4). Significant interactions were also present between populations and sites and between families and sites. The variance component of the last interaction was, however, one third of the size of the component between families. The estimate of heritability for height was 0.14.
| Table 4. Norway spruce populations and families from Mid-Norway. Analyses of variance of traits measured in the short term trials at Stiklestad and Kvatninga. Height, bud flush, lammas shoots and damage are from measurements/assessments at both sites, while growth cessation was measured only at Stiklestad. Shown are estimates of variance components for random effects, p-values from the F-test and heritabilities (standard error in parentheses). | ||||||||||
| Height age 9 | Bud flush 1) age 6 | Growth cessation 2) age 9 | Lammas shoots age 6 3) and 9 4) | Damage age 9 | ||||||
| Variance | p-value | Variance | p-value | Variance | p-value | Variance | p-value | Variance | p-value | |
| Sites | 0.004 | |||||||||
| Populations | <0.0001 | <0.0001 | 0.0001 | 0.16 | 0.48 | |||||
| Sites × populations | 0.02 | 0.48 | <0.0001 | 0.78 | ||||||
| Families (populations) | 60.06 | <0.0001 | 0.14 | <0.0001 | 0.0016 | 0.0003 | 0.030 | <0.0001 | 0.007 | 0.02 |
| Sites × families (populations) | 19.98 | <0.0001 | 0.0 | 0.001 | 0.32 | 0.001 | 0.37 | |||
| Replicates (site) | 117.86 | <0.0001 | 0.0005 | 0.008 | ||||||
| Error | 1250.81 | 0.63 | 0.0238 | 0.464 | 0.499 | |||||
| Heritability | 0.14 (0.04) | 0.55 (0.08) | 0.18 (0.07) | 0.18 (0.04) | 0.04 (0.02) | |||||
| 1) Scored according to Krutzsch (1973). 2) Proportion of shoot growth accomplished at June 30. 3) Assessed at Kvatninga. 4) Assessed at Stiklestad. | ||||||||||
The trees in the populations from altitudes 400 to 500 m and with the lowest mean annual temperatures had the earliest bud flush (Fig. 2) and significant variation was found (Table 4) both among populations and families, with no interactions with test sites present. The estimate of heritability of this trait was 0.55.
On the last day of June, the trees from the populations at high altitudes had nearly completed 90% of their shoot growth, whereas those from low altitude populations had completed nearly 75% of their annual growth (Fig. 3b). Highly significant variation was present both among populations and among families (Table 4), and the estimate of heritability was 0.18. Less, but still significant, variation was present among families for damage scores. The heritability for this trait was, however, low.
The percentages of trees with lammas shoots were 6.8, 18.1 and 22.8 at Stiklestad in 2000, 2002 and 2003, respectively. At Kvatninga, these figures were 25.2 and 5.6 in 2000 and 2003. The analysis of variance presented in Table 4 was based on the assessments in 2003 at Stiklestad and 2000 at Kvatninga. There was no significant variation among populations due to a strong interaction between sites and populations. In a separate analysis of the assessments at Stiklestad 2003, the variation among populations was highly significant (p < 0.0001) with a range of variation from 12 to 34%. Here the variation among families was in particular large, with a range of 11–52% and 18–64% among families in the two lowland populations (30 and 50 m), as well as the 400 m population (0 to 39%). The interaction between sites, years and populations is clearly seen in Fig. 4 as the two high altitude populations from 400 and 500 m perform differently, with high levels of lammas shoots at Kvatninga and lower levels at Stiklestad.
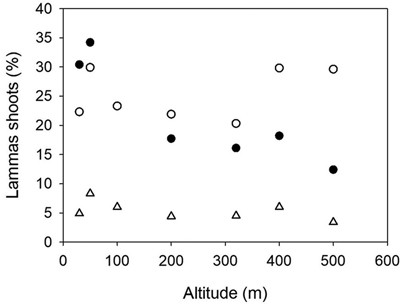
Fig. 4. Norway spruce populations from Mid-Norway. Relationship between the percentages of trees with lammas shoots at Kvatninga 2000 (white circles) and 2003 (triangles) and Stiklestad 2003 (black circles) and the altitude of the populations.
The northern transect populations originate from altitudes between 30 and 500 m above sea level and cover two zones in the breeding program of Norway spruce in this region (Edvardsen 2017). When analyses of variance were made for these two zones separately (0–250 m: four populations; and 250–500 m: three populations), the estimates of heritability were reduced for the high altitude zone. The largest changes were present for flushing, with estimates 0.57 and 0.36, while smaller changes occurred for height, with estimated values 0.15 and 0.13 for the two zones, respectably.
Positive genetic correlations of similar magnitude to that observed in the southern transect were present between the timing of flushing and shoot growth cessation (Table 5). A positive correlation was also found between flushing and height growth, and between lammas growth and flushing and height, and also between damage and height and flushing. Similar to the southern transect families, no significant genetic relationships were present between terminal bud set and the traits measured in the short term tests.
| Table 5. Norway spruce families from Mid-Norway. Estimates of genetic correlations (with standard errors or p-values) for traits measured in the short term trial at Stiklestad and Kvatninga and for bud set assessed in the nursery (Stiklestad). P-values are given when inference are based on Pearson-correlations between BLU-predicted breeding values. | |||||
| Bud flush | Growth cessation 1) | Lammas shoots | Damage | Bud set 2) | |
| Height | 0.58 (0.12) | –0.09 (0.22) | 0.32 (0.16) | 0.42 (p < 0.0001) | –0.24 (p = 0.04) |
| Bud flush | 0.62 (0.16) | 0.45 (0.12) | 0.43 (p < 0.0001) | –0.17 (ns) | |
| Growth cessation | 0.32 (0.26) | 0.29 (p = 0.01) | 0.17 (ns) | ||
| Lammas shoots | 0.27 (p = 0.01) | –0.08 (ns) | |||
| Damage | –0.05 (ns) | ||||
| 1) Proportion of shoot growth accomplished at June 30. 2) Measured in the nursery (Stiklestad). | |||||
The Pearson correlation coefficient at the population level between the timing of flushing and growth cessation was 0.92, and between height growth and flushing and growth cessation, –0.91 and –0.98, respectively.
The populations showed strong trends related to their mean annual temperatures for height, bud flush and growth cessation (Fig. 2) with absolute values of Pearson correlation coefficients between the population means in the range 0.92 to 0.99.
3.3 Variation in the field trials for both transects
The mean heights in the three field trials 16 years after planting were 281, 384 and 384 cm, and the mortality was 8, 12 and 23%. There were small differences among populations for mortality and the frequency of trees with spike knots and double leaders. In the analyses of variance of height and diameter across the three sites significant variation was present among the 11 populations for height (p = 0.01), but not for diameter (p = 0.13). No interactions were present between sites and populations. Strong clinal relationships were present between the population mean height and diameter and the annual mean temperatures of the populations, as shown in Fig. 5. The populations from the lower altitudes and with the highest mean temperatures were the tallest, except for one population from low altitude (30 m) and quite high mean annual temperature that had a low mean height and deviated from the trend. The populations from latitude 63°N had higher annual mean temperatures and were taller than those from the same altitudes at latitude 64°N.
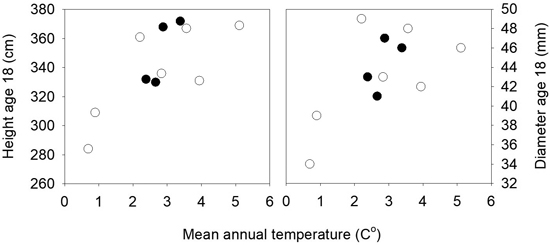
Fig. 5. Norway spruce populations from Mid-Norway. Mean heights and diameters of the populations at age 18 years from seed in three field trials plotted against the mean annual temperatures of the populations. Black circles denote the southern and white circles the northern transect populations.
3.4 Relationships between nursery, short term and field trials
At the population level, strong relationships were present between mean tree heights in the field trials and heights and the timing of the growth season in the short term trials, as well as for bud set, all with absolute values of the correlation coefficients higher than 0.80 (data not shown). This corresponds to the clinal variation observed in these traits relative to the mean temperatures of the populations. No such relationships were found between the traits measured at an early age and mortality or the frequency of double leaders or spike knots in the field trials.
3.5 Response to selection for height in the short term trials
For each of the three subsets of families, the mean performance in the field trials of the best 20% of families selected for height in the short term trials are presented in Table 6. For the four populations in the southern transect the mean of the selected families was 11% above the total mean of the trees from all families in these populations. The selected families from low altitude in the northern transect were on average 4% taller than all families, while there was a small negative effect of the selection in the high altitude populations. There were only small differences in mortality and damage between the two groups of families.
| Table 6. Norway spruce populations and families from Mid-Norway. Mean values across three field trials at age 18 year of selected and all families for each of three subset of populations. | ||||
| Subset of populations | Height cm | Diameter mm | Mortality % | Damage % |
| Southern transect populations > 250 m altitude | ||||
| Selected families | 390 | 49 | 11.5 | 29.4 |
| All families | 350 | 46 | 18.1 | 21.7 |
| Northern transect populations < 250 m altitude | ||||
| Selected families | 368 | 44 | 18.8 | 17.8 |
| All families | 353 | 43 | 16.4 | 23.8 |
| Northern transect populations > 250 m altitude | ||||
| Selected families | 313 | 37 | 13.1 | 28.3 |
| All families | 321 | 40 | 19.0 | 21.5 |
4 Discussion
4.1 Patterns of variation
The Norway spruce populations tested were sampled along two altitudinal transects approximately at latitudes 63°N and 64°N in Trøndelag. A striking result is the clinal relationships present between the mean annual temperatures of the populations in each of the two transects and height and phenology traits in the short term tests and height in the field test. This resembles the clinal variation patterns related to latitude and altitude found in earlier provenance studies with Norway spruce (Dietrichson 1969; Krutzsch 1975; Holzer 1993; Skrøppa and Magnussen 1993; Dæhlen et al. 1995; Modrzynski 1995; Oleksyn et al. 1998). The study also demonstrates that populations in the southern transect have better height growth than populations from the same altitude in the northern transect, and that this difference can correspond to a change in altitude from 100 to 300 m.
It has been assumed that long-term adaptation to the climatic conditions has played a major role for the observed clinal variation patterns found for phenology traits such as bud burst in the spring and growth cessation and bud set in the autumn (Eriksson et al. 2013). It may be advantageous for northern and high altitude populations to respond rapidly to high temperatures in the spring and likewise react to short night lengths and lower temperatures before the end of the summer for building up hardiness. However, there are other factors that may contribute to the patterns of variability found among populations. We have observed that trees in the low altitude populations flower earlier than those in the higher altitude populations due to higher spring temperatures in the lowland. Pollen exchange occurs between populations in the hilly landscape, and it is likely that the late flowering trees at the lower altitude will be pollinated by pollen from early flowering individuals from higher altitudes. At the same time there will be a positive assortative mating by flowering time within populations. Since both flowering time and the timing of bud flush are influences by temperature sums in spring, this fact can contribute to the variation observed in the last trait. It should generally counteract the clinal pattern of variation observed; see discussion in Soularue and Kremer (2012, 2014).
Another contributing factor to the observed clinal variation may be the epigenetic memory effect of temperature conditions during seed maturation that in particular influences phenology traits of Norway spruce seedlings and young trees (Johnsen et al. 2009). High temperatures during seed maturation imply delayed phenology and lower temperatures the opposite. Recent results from trials with Norway spruce provenances from seed lots collected in Mid-Norway in years with different climatic conditions confirm that such an epigenetic memory effect is an important component of the clinal patterns found in phenology traits (Solvin and Steffenrem 2019). In our study, high values were found for the correlation coefficients between such traits and both for the long term annual mean temperature and for the mean temperature during the seed maturation period for each population. It is therefore not possible with our data to separate between influences of long-term genetic adaptation to temperature conditions and epigenetic effects of temperatures the specific seed year. Due to the close relationship between phenology traits and early growth similar clinal variation patterns may be present for height and diameter growth. However, there may still be deviations from the general pattern among populations within the same altitudinal transect, most likely due to differences in local climatic conditions. Examples are the population at altitude 630 m in the southern transect in Trøndelag and that at altitude 30 m in the northern transect. Genetic variation among stands may also occur due to differences in long-term population history, such as inbreeding due to small population size. Quite large differences among stands within the same provenance were found by Dietrichson (1973) who tested Norway spruce families, stands and provenances from altitude 600–750 m in southern Norway.
Another important result is the large variation found among families within populations. It was significant for most traits and had a wider range than the variation among populations (Fig. 2). This agrees with earlier reports on within-population variability in Norway spruce in southern Norway (Dietrichson 1971, 1973; Skrøppa 1982, 1991). The variation among families within populations was in particular large for the timing of bud flush, which had its largest range of variation with two units on the Krutzsch scale, corresponding to eight to ten days, in the two lowland populations from the northern transect. In the two populations from 400 and 500 m altitude, the range of variation was half that size. This trait is evidently of high climatic adaptive value and with the strongest selection pressure at high altitudes. One reason for the reduced variability within populations at high altitudes may also be due to a reduced effective population size. This was demonstrated in the population from 600 m in the northern transect from which only one out of ten trees produced seeds with a sufficient number of seedlings to be included in the trials. Similar patterns of within-population variability in adaptive traits, with less variation among families in a northern than in three more southern Norway spruce populations in Sweden, was demonstrated by Ekberg et al. (1985). The range of variation among families in height growth was also reduced in the high altitude populations, but to a smaller extent than for the adaptive traits. These differences in genetic variability among populations for the timing of bud flush are also reflected in the differences in heritability estimates for the two altitude zones. Our estimates are comparable to those of Ekberg et al. (1985) who presented estimates at the family level. The families within low altitude populations from Nord-Trøndelag have similar or even larger range of variation than is present for the same traits within populations in southern Norway as demonstrated by Dietrichson (1969) and Skrøppa (1982).
The assessments of lammas shoots that were made in three years at Stiklestad and in two years at Kvatninga, showed large differences both between years, between sites and a strong interaction between populations and sites. The interaction could be an effect due to differences in age when the analysed assessments were made; six years at Kvatninga and nine years at Stiklestad. It could also be caused by different responses of populations to variation in soil and nutrient conditions or to temperature and precipitation, which clearly exists between the two sites. At the family level, no interactions were present.
4.2 Trait relationships
Quite strong correlations, positive or negative, were present at the population level between bud set, the timing of flushing and growth cessation and height. A number of studies have presented similar relationships for provenances, e. g. Skrøppa and Magnussen (1993), who discussed the interrelationships between traits that are triggered by the same environmental factors such as temperature and photoperiod and show the same clinal patterns of variation.
The correlations were quite different for the same traits for families within populations. Such differences in correlations at the provenance and family level have earlier been demonstrated and discussed by several authors, e.g. Ekberg et al. (1994), Skrøppa et al. (1999), Johnsen and Skrøppa (2000). A striking result is the lack of genetic relationship between terminal bud set at the end of the first growth season and other traits, similar to results found and discussed by Skrøppa (1991) and Johnsen and Skrøppa (2000). This result clearly shows that selection for higher frost hardiness based on the timing of terminal bud set of one year-old seedlings does not have the intentional effect for improvements of Norway spruce.
A quite high positive genetic correlation was found between the timing of flushing and height growth for the families from the northern transect. This is contrary to what has been found in progeny trials with this species in the southern part of the Nordic countries (Hannerz et al. 1999; Skrøppa and Steffenrem 2015), where negative correlations have been estimated. In the southern areas late spring frosts occur frequently and cause damage on trees from early flushing families and are detrimental for height growth. Such frost events did not occur on the test sites Stiklestad and Kvatninga, and this may explain these differences. Another reason might be that the limited growing seasons at these latitudes benefit earlier flushing families, as these might utilize the favourable growing conditions in June and July more effectively provided that they do not cease the leader elongation too early.
The relationships found between the frequency of lammas shoots and the phenology traits indicate that families that have an early growth start and early growth cessation are more prone to develop lammas shoots than those that have a later development. This corresponds to the results from progeny tests in southern Norway (Skrøppa and Steffenrem 2017). During the last years an increasing occurrence of lammas shoots has been reported in Norway spruce plantations on the most productive sites in the lowland area in the south-eastern part of Norway (Kvaalen et al. 2010; Granhus et al. 2018). If their occurrence increases, with development of multiple tops (forking) the following years, this may be a negative factor for the production of high quality timber. In these trials, the genetic correlation between the frequencies of lammas shoots and damage was significant, but moderate (r = 0.27).
4.3 Implications for tree breeding
The results from these trials support the division into two altitudinal breeding zones for Mid-Norway, below and above 250 m altitude (Edvardsen 2017). However, more results from on-going trials should give further information to the question of whether there is need for a breeding zone for the most northern area north of latitude 65°N.
The selection of families in the short term tests was efficient for the southern transect populations and worked partly for the low altitude populations in the northern transect, based on the results from the long term field trials. However, it did not produce any gain for the high altitude populations in the northern transect. This shows that the low altitude test sites at Stiklestad and Kvatninga are not appropriate for testing for high altitude localities. The higher gain for the southern compared with the more northern families may be due to the more appropriate altitude of the short term test (240 m) relative to the field trials all located at altitudes above 240 m and the transfer from low to higher altitudes. It stresses again the importance of choosing appropriate sites for progeny testing.
There are genetic correlations between phenology and growth that must be considered in a breeding program. As individuals with later growth cessation tend to be taller, there is a risk of unintentional changes in hardiness as selection for growth goes on for generations. Likewise, genetic correlations between height and damage show that selection for growth must be weighed against the frequency of damage.
Acknowledgements
The seed collections in 1992 were financially supported by the Norwegian Ministry of Agriculture and Food. The nursery and short term trials were established at Stiklestad and Kvatninga nurseries with support from staff from Skogplanter Midt-Norge and from Skogselskapet i Trøndelag. Measurements in the field trials, statistical analyses and the writing of the manuscript were done as part of the project “Klimatilpasset gran i Midt-Norge” that was financially supported by Allskog, Skogtiltaksfondet, Utviklingsfondet for skogbruket, Det norske Skogfrøverk and the European Union’s Horizon 2020 research and innovation programme under grant agreement No 773383 (B4EST). We would like to thank all the institutions for their support and several colleagues that have contributed, in particular Ragnar Sand, Øyvind Meland Edvardsen, Torstein Myhre and Hans Christian Brede.
References
Bergan J. (1994). Planter etter frø fra utvalgte granbestand (Picea abies (L.) Karst.) på forskjellige breddegrader plantet under ulik jord- og klimaforhold i Troms. [Plants of seed collected from a selection of spruce stands (Picea abies (L.) Karst.) at different latitudes planted under various soil and climatic conditions in Troms]. Reports of the Norwegian Forest Research Institute 5/94: 1–51.
Birks H.H., Giesecke T., Hewitt G.M., Tzesakis P.C., Bakke J., Birks H.J.B. (2012). Comment on “Glacial survival of boreal trees in northern Scandinavia”. Science 338: 742-a.
Dæhlen A.G., Johnsen Ø., Kohmann K. (1995). Autumn frost hardiness of young seedlings of Norway spruce from Norwegian provenances and seed orchards. Skogforsk Research Paper 1/95: 1–24. ISBN 82-7169-701-3. [In Norwegian with English summary].
Danusevicius D., Person B. (1998). Phenology of natural Swedish populations of Picea abies as compared with introduced seed sources. Forest Genetics 5: 211–220.
Dietrichson J. (1969). Growth rhythm and yield a related to provenance, progeny and environment. FAO IUFRO FO-FTB-69-2/3, 2nd World Consultation on Forest Tree Breeding, Washington 7–16 August 1969.
Dietrichson J. (1971). A summary of studies on genetic variation in forest trees grown in Scandinavia with special reference to the adaptation problem. Meddelelser fra Det norske skogforsøksvesen 29: 21–59.
Dietrichson J. (1973). Genetic variation among trees, stands, and provenances of Norway spruce in alpine southern Norway. IUFRO Norway spruce Working Party s2-2-11. Biri Norway. 11 p.
Edvardsen Ø.E., Steffenrem A., Johnskås O.R., Johnsen Ø., Myking T., Kvaalen H. (2017). Skogfrøverkets strategi for skogplanteforedling 2010–2040 (revidert 2017). Stiftelsen det norske Skogfrøverk. 22 p. [In Norwegian with English abstract].
Ekberg I., Eriksson G., Weng Y. (1985). Between and within-population variation in growth rhythm and plant height in four Picea abies populations. Studia Forestalia Suecica167: 1–14.
Ekberg I, Eriksson G, Namkoong G, Nilsson C, Norell L. (1994). Genetic correlations for growth rhythm and growth capacity at ages 3–8 years in provenance hybrids in Picea abies. Scandinavian Journal of Forest Research 9(1–4): 25–33. https://doi.org/10.1080/02827589409382809.
Eriksson G., Ekberg I., Clapham D. (2013). Genetics applied to forestry. An introduction. SLU, Uppsala, Sweden. 206 p. ISBN 978-91-576-9187-3.
Fottland H., Skrøppa T. (1989). The IUFRO 1964/68 provenance experiment with Norway spruce (Picea abies) in Norway. Variation in mortality and height growth. Reports of the Norwegian Forest Research Institute 43(1): 1–30.
Giesecke T., Bennett K.D. (2004). The Holocene spread of Picea abies (L.) Karst. in Fennoscandia and adjacent areas. Journal of Biogeography 31(9): 1523–1528. https://doi.org/10.1111/j.1365-2699.2004.01095.x.
Granhus A., Metslaid M., Kvaalen H., Søgaard G. (2018). Tree, stand and site characteristics affecting the occurrence of lammas growth and multiple tops in field-grown Norway spruce. New Forests. https://doi.org/10.1007/s11056-018-9664-2.
Hannerz M., Sonesson J., Ekberg I. (1999). Genetic correlations between growth and growth rhythm observed in a short-term test and performance in long-term field trials of Norway spruce. Canadian Journal of Forest Research 29(6): 768–778. https://doi.org/10.1139/x99-056.
Holland J.B. (2006). Estimating genotypic correlations and their standard errors using multivariate restricted maximum likelihood estimation with SAS Proc MIXED. Crop Science 46(2): 642–654. https://doi.org/10.2135/cropsci2005.0191.
Holzer K. (1993). The evolution of alpine Norway spruce during immigration into high altitudes and its consequences. Norway spruce provenances and breeding. Proceedings of IUFRO (S2.2-11) Symposium, Latvia, Riga. p. 68–78.
Johnsen, Ø; Skrøppa T. (2000). Provenances and families show different patterns of relationship between bud set and frost hardiness in Picea abies. Canadian Journal of Forest Research 30(12): 1858–1866. https://doi.org/10.1139/x00-113.
Johnsen Ø., Kvaalen H., Yakovlev I., Dæhlen O.G., Fossdal C.G., Skrøppa T. (2009). An embryonic memory from time of embryo development affects climatic adaptation in Norway spruce. In: Gupta L., Wiesniewski M., Tanio K. (eds.). Plant cold hardiness: from the laboratory to the field. CAB International. p. 99–107. https://doi.org/10.1079/9781845935139.0099.
Krutzsch P. (1973). Norway spruce development of buds. International Union of Forest Research Organizations, Vienna. Report IUFRO S2.02.11.
Krutzsch P. (1975). Die Pflantzschulergebnisse eines Inventirerende Fichetenherkunftsversuches (Picea abies Karst. and Picea obovata Ledeb.). Royal College of Forestry, Department of Forest Genetics. Research Notes 14/1975.
Kvaalen H., Søgaard G., Granhus A., Fløistad I.S., Hanssen K.H., Steffenrem A., Skrøppa T. (2010). Høstskudd og toppskader – et omfattende problem på god mark I lavlandet. Skogeieren 2010 (10): 18–19. [In Norwegian].
Kullmann L. (2008). Early postglacial appearance of tree species in northern Scandinavia: review and perspective. Quaternary Science Reviews 27(27–28): 2467–2472. https://doi.org/10.1016/j.quascirev.2008.09.004.
Langlet O. (1960). Mellaneuropeiska granprovenienser i svenskt skogsbruk. Kungl. Skogs- och Lantbruksakademiens Tidskrift 1960: 259–329. [In Swedish].
Latalowa M, van der Knaap W.O. (2006). Late quaternary expansion of Norway spruce Picea abies (L.) Karst. in Europe according to pollen data. Quaternary Science Reviews 25(21–22): 2780–2805. https://doi.org/10.1016/j.quascirev.2006.06.007.
Lynch M., Walsh B. (1998). Genetics and analysis of quantitative traits. Sinauer Associates, Inc. 980 p.
Oleksyn J., Modrzynski J., Tjoelker M.G., Zytkowiak R., Reich P.B., Karolewski P. (1998). Growth and physiology of Picea abies populations from elevational transects: common garden evidence of altitudinal ecotypes and cold adaptation. Functional Ecology 12(4): 573–590. https://doi.org/10.1046/j.1365-2435.1998.00236.x.
Modrzynski J. (1995). Altitudinal adaptation of Norway spruce (Picea abies (L.) Karst.) progenies indicates small role of introduced populations in the Karkonosze Mountains. Silvae Genetica 44(2–3): 70–75.
Parducci L., Jørgensen T., Tollefsrud M.M., Elverland E., Alm T., Fontana S.L., Bennett K.D., Haile J., Matetovici I., Suyama Y., Edwards M.E., Andersen K., Rasmussen M., Boessenkool S., Coissac E., Brochmann C., Taberlet P., Houmark-Nielsen M., Krog Larsen N., Orlando L., Gilbert M.T.P., Kjær K.H., Alsos I.G., Willerslev E. (2012a). Glacial survival of boreal trees in northern Scandinavia. Science 335(6072): 1083–1085. https://doi.org/10.1126/science.1216043.
Parducci L., Edwards M.E., Bennett K.D., Alm T., Elverland E., Tollefsrud M.M., Jørgensen T., Houmark-Nielsen M., Krog Larsen N., Kjær K.H., Fontana S.L., Alsos I.G., Willerslev E. (2012b). Response to Comment on “Glacial survival of boreal trees in northern Scandinavia”. Science 338: 742-b.
Persson B, Persson A. (1992). Survival, growth and quality of Norway spruce (Picea abies (L.) Karst.) provenances at three Swedish sites of the IUFRO 1964/68 Picea abies provenance experiment. Report 29. SLU, Sweden. 67 p.
SAS Institute (2003). SAS/STAT user’s guide, version 9. SAS Institute, Cary, N.C., USA.
Skrøppa T. (1982). Genetic variation in growth rhythm characteristics within and between natural populations of Norway spruce. A preliminary report. Silva Fennica 16(2): 160–167. https://doi.org/10.14214/sf.a15075.
Skrøppa T. (1991). Within population variation in autumn frost hardiness and its relationship to bud-set and height growth in Picea abies. Scandinavian Journal of Forest Research 6(1–4): 353–363. https://doi.org/10.1080/02827589109382673.
Skrøppa T., Magnussen S. (1993). Provenance variation in shoot growth components of Norway spruce. Silvae Genetica 42: 111–120.
Skrøppa T., Steffenrem A. (2015). Selection in a provenance trial of Norway spruce (Picea abies L. Karst.) produced a landrace with desirable properties. Scandinavian Journal of Forest Research 31(5): 439–449. https://doi.org/10.1080/02827581.2015.1081983.
Skrøppa T., Steffenrem A. (2017). Høstskudd og toppskader i genetiske forsøk med gran; variasjon og sammenhenger med vekst og vekstrytme. NIBIO Rapport 3/23/2017. 30 p. [In Norwegian with English abstract].
Skrøppa T., Hylen G., Dietrichson J. (1999). Relationships between wood density components and juvenile height growth and growth rhythm traits for Norway spruce provenances and families. Silvae Genetica 48(5): 235–239.
Skrøppa T., Kohmann J., Johnsen Ø., Steffenrem A., Edvardsen Ø.M. (2007). Field performance and early test results of offspring from two Norway spruce seed orchards containing clones transferred to warmer climates. Canadian Journal of Forest Research 37(3): 515–522. https://doi.org/10.1139/X06-253.
Solvin T.M., Steffenrem A. (2019). Modelling the epigenetic response of increased temperature during reproduction on Norway spruce phenology. Scandinavian Journal of Forest Research 34(2): 83–93. https://doi.org/10.1080/02827581.2018.1555278.
Soularue J.-P., Kremer A. (2012). Assortative mating and gene flow generate clinal phenological variation in trees. BMC Evolutionary Biology 12: 179. https://doi.org/10.1186/1471-2148-12-179.
Soularue J.-P., Kremer A. (2014). Evolutionary responses of tree phenology to the combined effects of assortative mating, gene flow and divergent selection. Heredity 113: 485–494. https://doi.org/10.1038/hdy.2014.51.
Squillace A.E. (1974). Average genetic correlations among offspring from open-pollinated forest trees. Silvae Genetica 23: 149–156.
Tollefsrud M.M., Kissling R., Gugerli F., Johnsen Ø., Skrøppa T., Cheddadi R., Van der Knapp O., Latalowa M., Terhürne-Berson R., Litt T., Geburek T., Brochmann C., Sperisen C. (2008). Genetic consequences of glacial survival and postglacial colonization in Norway spruce: combined analysis of mitochondrial DNA and fossil pollen. Molecular Ecology 17(18): 4134–4150. https://doi.org/10.1111/j.1365-294X.2008.03893.x.
Total of 43 references.
