Petri Forsström  ,
Jouni Peltoniemi,
Miina Rautiainen
,
Jouni Peltoniemi,
Miina Rautiainen
Seasonal dynamics of lingonberry and blueberry spectra
Forsström P., Peltoniemi J., Rautiainen M. (2019). Seasonal dynamics of lingonberry and blueberry spectra. Silva Fennica vol. 53 no. 2 article id 10150. https://doi.org/10.14214/sf.10150
Highlights
- Seasonal series of multiangular spectra for lingonberry (Vaccinium vitis-idaea L.) and blueberry (Vaccinium myrtillus L.)
- Decidous blueberry has strong seasonal pattern while temporal variations of evergreen lingonberry were linked to phenological stages of flowering and berrying
- Detection of flowers and berries from shrub spectra was possible
- Collected spectral data are openly available through SPECCHIO Spectral Information System.
Abstract
Accurate mapping of the spatial distribution of understory species from spectral images requires ground reference data which represent the prevailing phenological stage at the time of image acquisition. We measured the spectral bidirectional reflectance factors (BRFs, 350–2500 nm) at varying view angles for lingonberry (Vaccinium vitis-idaea L.) and blueberry (Vaccinium myrtillus L.) throughout the growing season of 2017 using Finnish Geospatial Research Institute’s FIGIFIGO field goniometer. Additionally, we measured spectra of leaves and berries of both species, and flowers of lingonberry. Both lingonberry and blueberry showed seasonality in visible and near-infrared spectral regions which was linked to occurrences of leaf growth, flowering, berrying, and leaf senescence. The seasonality of spectra differed between species due to different phenologies (evergreen vs. deciduous). Vegetation indices, normalized difference vegetation index (NDVI), moisture stress index (MSI), plant senescence reflectance index (PSRI), and red-edge inflection point (REIP2), showed characteristic seasonal trends. NDVI and PSRI were sensitive to the presence of flowers and berries of lingonberry, while with blueberry the effects were less evident. Off-nadir observations supported differentiating the dwarf shrub species from each other but showed little improvement for detection of flowers and berries. Lingonberry and blueberry can be identified by their spectral signatures if ground reference data are available over the entire growing season. The spectral data measured in this study are reposited in the publicly open SPECCHIO Spectral Information System.
Keywords
understory;
remote sensing;
boreal forest vegetation;
berries;
flowers;
goniometer;
FIGIFIGO
-
Forsström,
Aalto University, School of Engineering, Department of Built Environment, FI-00076 Aalto, Finland
 https://orcid.org/0000-0002-2357-2517
E-mail
petri.forsstrom@aalto.fi
https://orcid.org/0000-0002-2357-2517
E-mail
petri.forsstrom@aalto.fi
-
Peltoniemi,
Finnish Geospatial Research Institute (FGI), Department of Geodesy and Geodynamics, Geodeetinrinne 2, FI-02430 Masala, Finland
https://orcid.org/0000-0002-4701-128X
E-mail
jouni.peltoniemi@nls.fi
-
Rautiainen,
Aalto University, School of Engineering, Department of Built Environment, FI-00076 Aalto, Finland; Aalto University, Department of Electronics and Nanoengineering, FI-00076 Aalto, Finland
https://orcid.org/0000-0002-6568-3258
E-mail
miina.a.rautiainen@aalto.fi
Received 1 February 2019 Accepted 23 May 2019 Published 4 June 2019
Views 89860
Available at https://doi.org/10.14214/sf.10150 | Download PDF

1 Introduction
The fast expansion of available remote sensing data from air- and spaceborne platforms has increased the demand for high quality reference data measured at ground level. This is especially the case in remote sensing of boreal forests in which the strong seasonality of vegetation changes not only the amount of leaf area of trees but also the composition of understory plants, introducing periodic variation to the forest structure, and thus to reflectance (Miller et al. 1997; Nilson et al. 2008; Hallik et al. 2009; Kuusinen et al. 2012). Reference data in the form of reflectance spectra of understory vegetation (i.e., forest floor and shrub layer plants) can be measured by utilizing spectrometers in laboratory or in field conditions. In order to obtain information on how the seasonality of spectra is linked to prevailing phenological stages of leaf-growing, flowering, berrying, and senescence, the measurements need to be made over the entire growing season.
Boreal understory has been previously shown to have a significant contribution to the overall spectra of both coniferous and deciduous forests of different structures (Rautiainen and Stenberg 2005; Eriksson et al. 2006; Rautiainen et al. 2007; Rautiainen and Lukeš 2015). Including its contribution in reflectance models for predicting forest variables, such as the leaf area index (LAI) from satellite imagery, is important for ensuring representativeness of the results (Eriksson et al. 2006). Due to the laborious nature of collecting reference spectra by field measurements for large forest areas, promising results have been reported of algorithms that would enable direct retrieval of understory reflectance from multiangular airborne and satellite measurements (Pisek et al. 2010, 2016). However, in-situ remote sensing measurements remain the most reliable method if spectral characterization is desired for specific understory species or a composition of species.
Two common berry-bearing dwarf shrub species in boreal forests are lingonberry (Vaccinium vitis-idaea L.) and European blueberry (Vaccinium myrtillus L.). Lingonberry and blueberry have a wide distribution in forests of Nordic countries (Finland, Sweden, Norway), supporting both the popular recreational activity of berry picking, as well as exploitation of the yield by commercial operators (Lindhagen and Hörnsten 2000; Turtiainen et al. 2011). Berries of these species are highly valued for their known health benefits (Puupponen-Pimiä et al. 2005). For example, in Finland, of the estimated annual yields of lingonberries (257 million kg) and blueberries (183 million kg), only 5% to 10% are currently capitalized (Turtiainen et al. 2007). Remote sensing could provide means to increase the exploitation of wild berries by providing information on good berry picking areas in the forests through e.g. large scale mapping of flowering populations.
Lingonberry and blueberry reflectance spectra have also previously been investigated during peak growing season (Kuusk et al. 2004; Peltoniemi et al. 2005) but only a couple of studies have collected spectral field measurements over the entire growing season (Rautiainen et al. 2011; Nikopensius et al. 2015). Data on the reflectance anisotropy, i.e., multiangular reflectance features, of lingonberry and blueberry are also available for a small set of samples (Peltoniemi et al. 2005). The preceding studies have shown that the seasonality on boreal forest understory spectra is generally strong but also highly diverse between forest types which have different plant compositions.
As of today, we are not aware of any study done on forest understory species in which the seasonality of reflectance spectra would have been linked to distinct phenological stages by applying multiangular observations. Moreover, distinct reflectance spectra of berries and flowers of lingonberry and blueberry species are not currently available. Possibly the closest resembling blue-colored shrub berries previously measured for spectral reflectance are different blueberry cultivars grown commercially in the United States (Leiva-Valenzuela et al. 2012, 2013; Jiang et al. 2016).
We present the first empirical evidence of the seasonal dynamics of spectra of lingonberry and blueberry in visible to short-wave infrared spectral regions. The spectral data were obtained as multiangular spectral bidirectional reflectance factors (BRFs) using Finnish Geospatial Research Institute’s FIGIFIGO field goniometer (Peltoniemi et al. 2014). All measurements were made in radiometrically stable and controlled laboratory conditions in order to relate the changes in the spectra to shrub structure and to the optical properties of leaves, flowers and berries.
Our study addressed the following research questions: (1) What are the differences of lingonberry and blueberry spectra? (2) What are the seasonal changes of lingonberry and blueberry spectra? (3) Are flowers and berries detectable from shrub spectra using (i) conventional nadir measurements or (ii) sophisticated multiangular measurements?
2 Material and methods
2.1 Study area
The study area was located in Masala, Kirkkonummi, Finland (60°09´N, 24°32´E), on the current premises of Finnish Geospatial Research Institute (FGI). The vegetation in the area grew on partially exposed and elevated bedrock, within a sparse forest dominated by Scots pines (Pinus sylvestris L.). The high canopy openness allowed light to reach the forest floor which supported the growth of locally extensive dwarf shrub populations. The understory vegetation in the area consisted mostly of dwarf shrubs, mosses, lichen, and grasses.
2.2 Description of species
Lingonberry (also known as cowberry) is a common broad-leaved evergreen dwarf shrub species found in xeric and sub-xeric boreal forests. Being an evergreen species, it keeps its thick and waxy leaves during the winter months. Normal height of the shrubs varies between 5 and 30 cm. The leaves of lingonberry are oval shaped, 8 to 30 mm long, and curled downwards at the edges, while the white colored flowers are bell-shaped. The fruits of lingonberry are glossy red berries with thick skin. European blueberry (also known as bilberry) is also a common dwarf shrub species found in sub-xeric and mesic boreal forests. Unlike lingonberry, blueberry goes through annual senescence in the autumn and drops its leaves for the winter. Blueberry shrubs grow typically 15 to 50 cm tall. Leaves of blueberry are approximately the same length as lingonberry leaves but thinner, saw-edged, and wider near the base. Blueberry flowers are round and reddish, while the berries are indigo color with a noticeable powder-like waxy layer covering the berry skin. Berries of both species are between 5 to 8 mm in diameter.
2.3 Samples
We obtained the shrub samples from three different subplots in the study area, less than 70 m distance from each other. Two of the subplots were populated by lingonberry and one by blueberry. The primary data were spectral BRFs, measured in multiangular measurement geometry. Altogether 20 dwarf shrub samples were measured during the growing season of 2017 (between day of year (DOY) 144 and 272). The samples represented four different phenological stages: leaves-on, flowering, berrying, and senescence. Here leaves-on stage refers to shrub samples with fully developed leaves, flowering- and berrying stages to shrubs with either flowers or berries, and senescence stage to the samples with visible signs of seasonal aging.
Shrub samples were chosen based on visual observations of the dominant species, phenological stage, and structural applicability for the measurement setup. A shovel was used to dig the samples from the ground and a plastic sled was used to transport them to the FGI’s spectral laboratory located at close proximity to the study site. Care was taken to preserve the natural structure of the shrubs during transportation and when moving them on to a dark plywood sample holder. On average a 13.5 cm thick rooted layer of soil was included in all samples. The planar dimensions of an average size sample were 0.7 × 0.6 m.
Spectra for each sample were measured two or three times in the following way. The first measurements were made for intact samples which had been brought in from the forest, i.e., the sample included dwarf shrubs and forest floor vegetation. Next, in the case of shrubs with flowers and berries, the second spectral measurements were made after carefully removing all the flowers or berries from the shrubs, so that the dwarf shrubs had only leaves. Finally, for all samples, the last measurements were performed so that the dwarf shrubs were completely removed, and only the forest floor (mosses, litter) was left in the sample (Fig. 1). In this way, we were able to evaluate the influence of different components on the spectrum of a dwarf shrub sample.
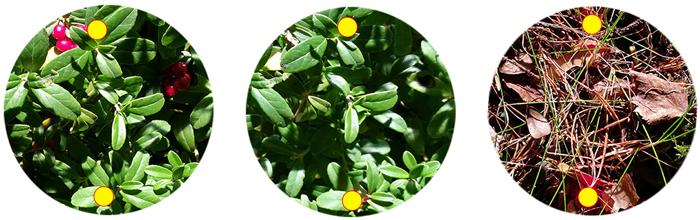
Fig. 1. Photographs of a natural stage lingonberry shrub with berries (left), after removing the berries (centre), and forest floor after removing the shrubs (right). The measurements were made from circular field of view between the yellow markings edited in the photos.
To obtain pure spectra of flowers and berries, we also measured BRFs of 30 mm tall cylindrical stacks of these products (each containing approximately 2 liters of berries or flowers). Lingonberry flowers were measured on DOY 165, berries of blueberry (referred to as blueberries) on DOY 230, and berries of lingonberry (referred to as lingonberries) on DOY 258. Both the flowers and the berries were hand-picked before measurements to minimize structural deformations and to ensure fresh samples.
Ancillary measurements of leaf spectral reflectance were made at peak growing season (on DOY 226) at the spectral laboratory of Aalto University. The number of leaf samples measured for adaxial (upper) side reflectance was 27 per species. The leaves were collected from a forest next to the university campus (60°11´N, 24°49´E).
2.4 Spectral measurements
Multiangular spectral measurements are laborious, and currently, there are very few research facilities in the entire world capable of performing them. In this study, the spectral BRF data were collected using FGI’s FIGIFIGO (Finnish Geodetic Institute Field Goniospectrometer) spectral instrument in laboratory setup (Suomalainen et al. 2009). FIGIFIGO enables multidirectional measurements of the reflected light from the sample into different view angles in the upper hemisphere (Fig. 2). We used FieldSpec Pro FR spectrometer by ASD (Analytical Spectral Devices, Inc.) as the radiometric sensor of the system to collect the spectra from visible and near infrared (NIR) to short-wave infrared (SWIR) spectral regions (350 to 2500 nm). The full-width-half-maximum (FWHM) spectral resolution of the spectrometer in visible and NIR was 3 nm and in SWIR 10 nm. The angular field-of-view (FOV) of the sensor was limited to 3° by using depolarizing fore-optics in front of the spectrometer bare fiber. The resulting diameter of the sensor footprint was 9 cm at the pivot of the goniometer (i.e. at the coordinate system origo). FIGIFIGO is designed to automatically measure spectra while sensor optics move continuously in zenith direction. Thus, given the integration time of 136 ms, and the movement speed of the sensor optics (4.7° / second), the reported BRFs were measured always within 1° zenith arc. Further, due to data transfer constrains, measurements were done at 4 to 5 degree intervals.
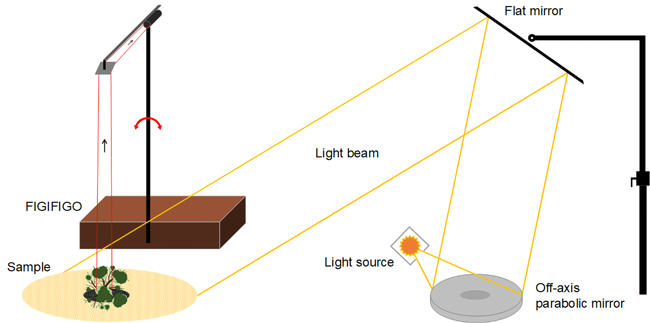
Fig. 2. Illustration of the implemented laboratory setup for measuring BRF. Adopted from Suomalainen et al. (2009).
The BRF were measured in the principal plane (i.e. light source, sample and sensor optics aligned) with changing zenith angles between maximum +–35°. The between-sampling step size in zenith was 4° with deviation from nadir being always less than 3°. The response in nadir view direction was further measured in 13 different azimuthal orientations of the sensor (15° increments between 0° and 180°) with the attempt to reduce the spatial distribution error of the sensor when coupled with spatially heterogenic sample (Suomalainen et al. 2009). The samples were illuminated from +40° zenith angle direction using a 1000 W tungsten-halogen lamp (Osram) and a stabilized power supply (Newport Oriel) with well collimated beam geometry. The glass surface of the lamp was sanded before the measurements to create a matte surface to reduce the effect of filament shadowing.
The reference spectra needed for calculating target BRF were collected always at the beginning and at the end of each set of measurements from nadir view direction. Temporal interpolation was later applied to generate a unique reference value to be applied for each sample spectra. As a reference panel, we used a 25 × 25 cm (10 × 10 inches) 99% Spectralon® panel which was carefully levelled using a bubble level. The panel surface covered fully the goniometer sensor footprint.
The dwarf shrub BRF measurements were carried out between 10 AM and 2 PM, and were initiated on average 15 minutes after digging and transporting the sample to the laboratory. The measurements took on average 30 minutes.
Leaf reflectance measurements were made using a SpectroClip-TR spectral probe by Ocean Optics, coupled with a 20 W artificial light source (HL-2000-HP-FHSA). The probe utilizes a double-integrating sphere design for non-destructive directional-hemispherical reflectance and transmittance measurements from the same 6 mm diameter spot on the leaf. As the sensor of SpectroClip-TR we used FieldSpec4 Standard-Res spectrometer by ASD in wavelength range from 350 to 2500 nm. The measured spots (one for each leaf) represented the minimum observed spatial variations in the leaf surface and thus e.g. large veins were avoided. An average of 15 spectra was saved for each spot. A white reference reading was collected always after three consecutive leaf samples using a 5 cm diameter (2 inches) round 99% Spectralon® panel. To minimize the effects of physiological changes on the spectra caused by detachment, the leaves were measured within minutes after removal from the shrubs. The shrubs were kept with full roots with moist soil inside a plastic container placed in a pre-cooled refrigerator (5 °C). The measurements were conducted for visually healthy green leaf samples.
Both the BRF and leaf reflectance measurements were made in controlled laboratory conditions. By excluding the effect of environmental variables, e.g. variation in solar angle between measurement times, we were able to trace the between-samples variations in the shrub spectra to the variations in the shrub canopy structure and to the optical properties of the leaves.
2.5 Spectral reflectance calculation
Spectral data were collected with FIGIFIGO through a custom controlling software (GonioControl 4) which stored all the raw data in a structured HDF5 (Hierarchical Data Format) data format. The BRFs were then calculated from the raw data using FGI Reflectance Toolbox 1.1 for Matlab which enabled (i) subtraction of dark current, (ii) running a linear interpolation of the measured white reference for each time of the sample radiance measurement, (iii) loading and applying spectral and illumination zenith angle correction factors for the non-ideal Lambertian surface of the Spectralon®, and (iv) finally calculating the BRFs. The BRFs were calculated in each viewing direction by applying the equation:

where DNsample,meas and DNWR,meas are the sensor readings from the sample and from the white reference panel (given as digital numbers with dark current already removed), symbols θi, ϕi, θr, ϕr , λ the directional (θ is zenith and ϕ is azimuth) and spectral (λ) variables defining the illumination (i) and viewing (r) directions, and RWR the correction term to compensate for the non-ideal reflectance properties of the reference panel. The correction term is needed because the reflectance factor is defined as the ratio of radiant flux from a sample surface (in a given view direction) to that from a perfectly diffuse (i.e. Lambertian) and lossless reference surface, both illuminated by a single directional light source (Nicodemus et al. 1977; Schaepman-Strub et al. 2006).
To obtain spectral reflectance from SpectroClip-TR measurements, we applied a measurement protocol from previous work by Hovi et al. (2018), and further the theoretical algorithms developed by Mõttus et al. (2017). The leaf reflectance (and transmittance, not shown) was calculated from several individual spectral readings of white reference, dark current, stray light, empty sphere reflectance and transmittance, and leaf response to incident light. Due to the given illumination and sensor geometry, the derived reflectance quantity is defined as directional-hemispherical reflectance (DHR) (Schaepman-Strub et al. 2006). As with the BRFs, the non-ideality of the Spectralon® material was corrected in the calculations.
Finally, in the results we will use FWHM to characterize the extent of spectral effects flowers and berries have on shrub spectra. We applied Savitzky-Golay filtering (2nd order, 31 nm spectral window) to all spectral data to smooth out spectral noise and to improve the signal-to-noise ratio.
2.6 Data analyses
The collected data were examined for characteristic spectral reflectance dynamics of blueberry and lingonberry in the principal plane (Fig. 3). We first present the seasonal variations on shrub canopy broadband BRFs at six spectral bands, centered in wavelengths 496.6 nm (blue), 560.0 nm (green), 664.5 nm (red), 703.9 nm (red-edge), 835.1 nm (NIR), and 1613.7 nm (SWIR). The selected spectral bands represent those of a new European satellite sensor, Sentinel-2A MSI. Sentinel-2 MSI provides temporally continuous surface reflectance data in spectral regions commonly utilized in mapping of land covers and in environmental studies. The broadband BRFs were calculated using the spectral response functions (S2-SRF 3.0) of the satellite sensor to relate the output metrics to those of a widely used spaceborne instrument. Furthermore, standard deviations were calculated to indicate differences of spatial heterogeneity between samples.
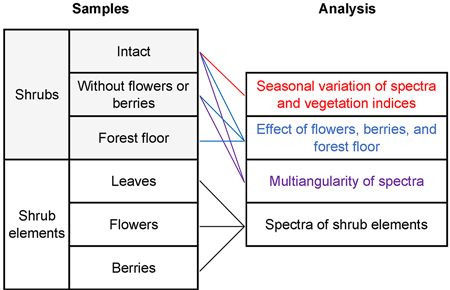
Fig. 3. Applied spectral analyses and sample types.
The interspecies differences in seasonal dynamics of the shrubs are further demonstrated by one broadband and two narrowband spectral vegetation indices (VIs), and with red-edge inflection point (REIP2), all commonly used in remote sensing of forests (Table 1). In general, VIs have been designed to link spectral observations to phenomena in plant physiology and canopy structure. The chosen VIs are (i) normalized difference vegetation index (NDVI), for enhancing the changes of the spectral contrast in red and NIR wavelength, (ii) moisture stress index (MSI), for detecting water stress conditions of the shrub canopy through evaluation ratio of SWIR and NIR, and (iii) plant senescence reflectance index (PSRI), to detect chlorophyll degradation which effecting red and blue wavelengths unevenly. REIP2 provides an additional method for detecting changes in the chlorophyll content of leaves through evaluation of the spectral shift of the slope between red and NIR domains. The inflection point is calculated from BRFs in red, red-edge, and NIR wavelengths. NDVI was calculated using the broadband spectra (corresponding to Sentinel-2 sensor bands), and MSI, PSRI and REIP2 using the original hyperspectral resolution.
| Table 1. Spectral indices used in the analysis. | ||
| Index | Formula | Reference |
| NDVI | (NIR – red) / (NIR + red) | Rouse et al. (1974) |
| MSI | BRF1599 / BRF819 | Hunt and Rock (1989) |
| PSRI | (BRF678 – BRF497) / BRF704 | Merzlyak et al. (1999) |
| REIP2 | 700 + (780 – 670) × [( BRF670 + BRF780)/2 – BRF700] / ( BRF740 – BRF700) | Guyot and Baret (1988) |
The effects of berries and flowers on the shrubs’ spectral responses, on the other hand, were examined in hyperspectral resolution over the limited solar radiation range of 400 to 2400 nm. The noisy ends of the measured spectrum (350 to 2500 nm) were cut from the analysis to improve data interpretation.
The view angle dependencies of shrub BRFs includes evaluation of lingonberry with and without berries and flowers, and blueberry with and without berries. Samples with the highest number of flowers and berries were chosen for the analysis. Further, linear interpolation was applied to the data in the analysis of the effect of flowers and berries to match the angular positions between measurements.
3 Results
We begin by presenting a time-series of lingonberry and blueberry spectra, measured from the conventional nadir view, and show the effects of berries and flowers. We then provide spectra of several contributing elements (leaves, flowers, berries, and forest floor material) and argue the usefulness of the selected VIs for further highlighting the seasonal effects. Lastly, we analyse the measured multiangular data and provide evidence of the visibility of flowers and berries from different view angles.
The season influenced the spectra of both lingonberry and blueberry shrubs (Fig. 4). Interspecies differences were expected to arise mainly from differing phenological cycles of evergreen lingonberry and deciduous blueberry. In general, both species displayed typical spectral responses for healthy green vegetation with a sharp contrast between red (664.5 nm) and NIR (835.1 nm).
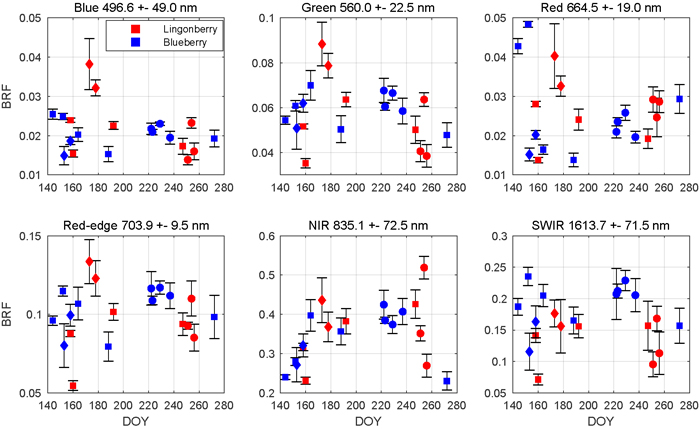
Fig. 4. Seasonal dynamics of nadir view spectra for lingonberry (red) and blueberry (blue) in 2017. The spectral bands correspond to the Sentinel-2 MSI sensor. Error bars are standard deviations. Different phenological stages are indicated by diamonds (with flowers), circles (with berries), and squares (no flowers or berries). Illumination at view zenith angle +40°.
Lingonberry samples with flowers (DOYs 173 and 178) were 60% brighter than samples without flowers in the photosynthetically active wavelengths blue (496.6 nm), green (560.0 nm), red, and red-edge (703.9 nm), while in NIR and SWIR (1613.7 nm) the change due to flowering was less notable (Fig. 4). On the other hand, lingonberry samples with the largest amount of berries (DOYs 251 and 256) showed a distinct brightening particularly in red, while less so elsewhere in the visible domain. Spectral BRFs of two lingonberry shrub samples differed considerably from the others (DOYs 160 and 254). The former represented a shadowed canopy without flowers or berries, and the latter a dense canopy with small amount of berries hidden underneath.
The seasonality of the blueberry spectra was most prominent when comparing samples of early growing season (DOYs 144 and 152) and senescence (DOY 272) to samples with fully grown leaves (DOYs 164 to 237) (Fig. 4). From late May to mid June, red BRF dropped more than 60% while NIR increased 65%. As the season progressed, red BRF began to climb. In NIR, BRFs of blueberry shrubs showed relatively low seasonality when in full leaf cover and high seasonality when in senescence. Between summer and autumn, blueberry BRF in NIR dropped 40%.
The effects of berries and flowers on the spectral signatures of lingonberry and blueberry shrubs are presented next in full wavelength resolution (Fig. 5). The contribution of flowers and berries of lingonberry was most notable in blue (450 nm) and red (650 nm) wavelength regions, while the effect of blueberries on the shrub spectra was less evident. In blue region, from 414 to 512 nm (FWHM 84 nm), the sample with flowers measured more than one and half times the BRF of the same shrub without flowers. Similarly, in the spectral region between red and red-edge, from 619 and 693 nm (FWHM 54 nm), the increase of brightness was nearly 50%. Additionally, in SWIR domain the presence of lingonberry flowers induced a notable increase of the shrub BRFs in the water absorption peaks of 1375 to 1550 nm (FWHM 108 nm), and 1870 to 2080 nm (FWHM 120 nm).
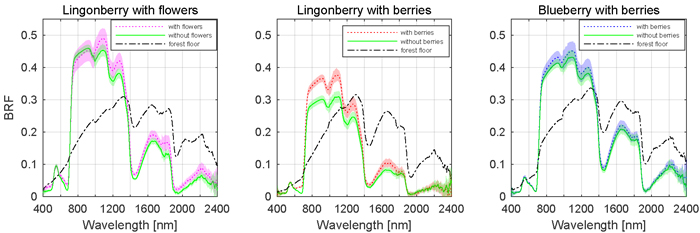
Fig. 5. Effect of berries and flowers on nadir BRF spectra. Shaded areas are standard deviations. Illumination at view zenith angle +40°.
Similarly as with the flowers, the removal of lingonberries changed the shrub’s spectral response (Fig. 5). In blue, red, and red-edge, the sample with berries measured 40% higher BRF between 432 and 444 nm (FWHM 7 nm), and between 609 and 740 nm (FWHM 44 nm). The most prominent spectral effect was observed in red wavelength of 681 nm where the measured BRF was three times that of the sample without berries. With blueberry, the effect of berries was less prominent, though a subtle increases of BRF were noted in the visible region between 540 and 704 nm (FWHM 89 nm), and in SWIR region between 1310 and 1700 nm (FWHM 160 nm). The forest floors of lingonberry and blueberry had similar spectra. They differed mainly at the red-edge where the more grasseous plants occupying the forest floor of blueberry increased the spectral contrast between red and NIR domain BRFs.
The influence of phenological stages of flowering and berrying on lingonberry and blueberry shrub spectra was further analysed by comparing the responses of individual scattering components, namely spectra of flowers and berries to that of leaves (Fig. 6). In the visible spectral region (400 to 700 nm), flowers of lingonberry produced nearly four times the BRF of that of leaves, while in NIR (700 to 1140 nm) the difference was less notable. The largest relative difference was in red wavelength of 665 nm, where the lingonberry flowers were more than five times brighter than leaves. In the SWIR domain, between 1140 to 2400 nm, flowers were darker than leaves. Additionally, lingonberry flowers had a strongly increasing BRF starting at approximately the same spectral location as the red-edge (704 nm) of its leaves.
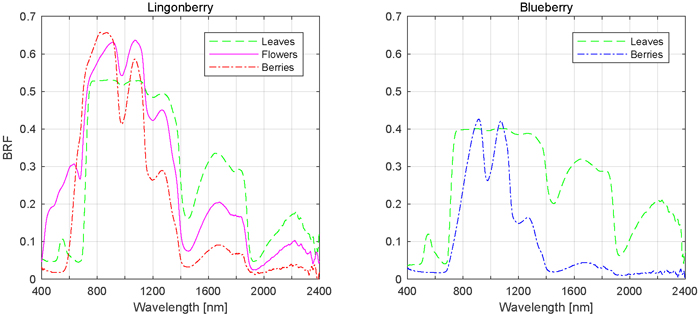
Fig. 6. Mean spectral signatures of contributing scattering components.
Lingonberries were brighter than lingonberry leaves from red to NIR (590 to 944 nm), and darker in SWIR (>1113 nm) (Fig. 6). Unlike flowers, lingonberries were darker in wavelengths shorter than 593 nm, meaning regions of blue and green wavelengths. The berry spectra differed most notably in red, around 681 nm, where berries were eight times as bright as leaves.
Blueberries were spectrally darker than leaves over the entire measured spectral range, with the exception of modest brightening around NIR and SWIR wavelengths 913 nm and 1073 nm, respectively (Fig. 6). In red and red-edge domains, where lingonberries were noted earlier to have produced the largest relative BRFs, blueberries produced the smallest relative BRFs, less than 50% of that measured of leaves.
Based on the results of the influence of phenology on different regions of nadir shrub spectra, three vegetation indices along with an analysis of red edge location are presented to emphasize the seasonal variations (Fig. 7). All selected indices and REIP2 showed characteristic and species-specific sensitivity to leaf growing, flowering, berrying, and senescence. We begin from NDVI which for both species stayed always above 0.69 units in the –1 to +1 index range. Blueberry NDVI had a trend which increased towards the middle of the growing season and then declined towards the autumn. The first notable change in blueberry was between late May (DOY 144) and mid June (DOY 164) in which NDVI increased 0.23 units. During July and August, blueberry NDVI stayed relatively steady (maximum change of 0.05 units) and high. Between late August (DOY 237) and late September (DOY 272), the latter sample representing senescence stage, blueberry NDVI decreased 0.13 units. Lingonberry NDVI stayed between 0.8 and 0.9 units throughout the season. Lingonberry shrubs in the flowering stage (DOYs 173 and 178) displayed lower NDVI compared to samples without flowers or berries (DOYs 158, 192, and 247). Similarly, lingonberry samples with berries decreased the NDVI.
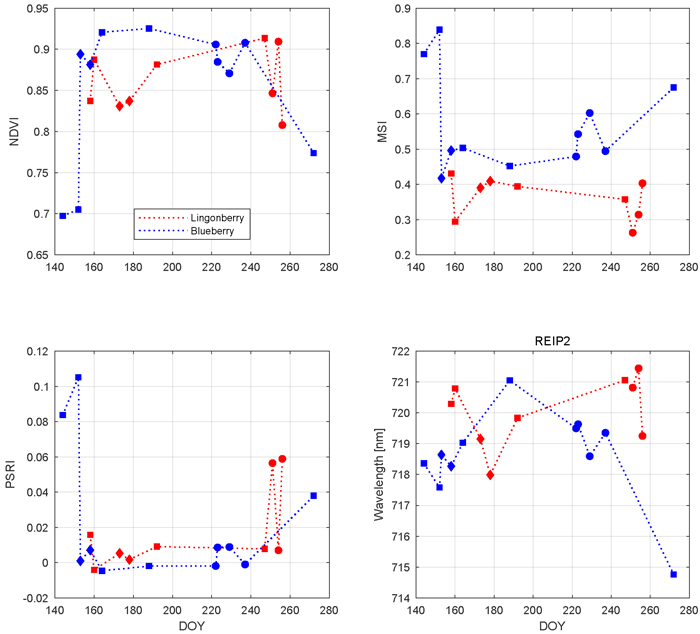
Fig. 7. Seasonal dynamics of vegetation indices and red-edge inflection point in 2017 for lingonberry (red) and blueberry (blue). Different phenological stages are indicated by diamonds (with flowers), circles (with berries), and squares (no flowers or berries). Illumination at view zenith angle +40°.
The seasonal changes in the water content of the shrubs were tracked by MSI (Fig. 7). Larger MSI indicates less moisture. Similarly to NDVI, blueberry MSI showed most notable changes during temporal transitions: from May to June the index decreased 0.23 units and from August and September the index increased 0.18 units. While blueberry MSI was always between 0.43 and 0.84 units, lingonberry was between 0.27 and 0.45 units. Overall, MSI was more sensitive to phenological changes of blueberry than those of lingonberry. The effect of lingonberries on the index were left ambiguous. Interspecies difference in MSI increased towards autumn.
PSRI is a narrow band index developed especially for detecting plant senescence in green vegetation spectra. The most notable change in PSRI was between blueberry samples measured between May and June (Fig. 7). There the index dropped 0.11 units. During summer, blueberry PSRI was relatively stable before increasing again in senescence. The seasonal variations of lingonberry PSRI were temporally linked to the phenological stage of berrying in which the index showed strong increase.
The temporal trend of REIP2 for blueberry resembled a downward opening parabola, moving towards longer wavelengths after May (718 nm), peaking at July (721 nm), and decreasing again to its lowest index in late September (715 nm) (Fig. 7). Lingonberry REIP2 was always between 718 nm and 721 nm. Although lacking a clear seasonal trend, REIP2 of lingonberry shrub samples that contained either lingonberry flowers or lingonberries were noted to have shifted towards shorter wavelengths.
The presence of lingonberry flowers and berries was noted in the multiangular spectral data (Fig. 8). The effect of flowers on the lingonberry shrub BRF was especially prominent in the photosynthetically active blue (496.6 nm) and red (664.5 nm) spectral regions for small forward view zenith angles (away from the light source), while berries of lingonberry increased the BRF most clearly in red, around nadir view direction. In other spectral domains the relative changes of BRF induced by lingonberry flowers or berries were smaller. In contrast to the effect of lingonberry flowers and berries, the appearance of the blueberry shrub was not affected by the presence of berries regardless of the applied view direction. The largest absolute differences of lingonberry BRFs with and without flowers were in red (0.025 units) and in blue (0.017 units) from –17° view zenith angle. Similarly, the largest absolute difference between lingonberry with and without berries was 0.014 units in red for nadir direction. In general, the angular BRF distributions of both species were considered characteristic for vegetation canopies with light scattered strongly backward (towards illumination) and forward. NIR (835.1 nm) domain stood out by having the highest BRFs in spectra of both species and by undergoing the largest changes (in absolute terms) as view direction was altered.
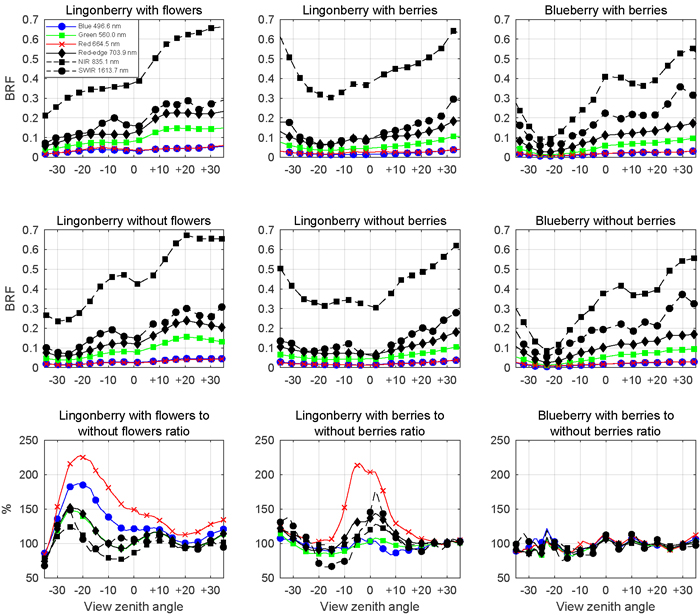
Fig. 8. Multiangular spectra of lingonberry (left and centre panels) and blueberry (right most panels) in six spectral bands corresponding to Sentinel-2 MSI sensor. View angle dependence within –35° and +35° zenith angles of BRF is shown for samples with flowers or berries (first row panels), for samples without flowers or berries (second row panels), and for the corresponding ratios (third row panels). Illumination at view zenith angle +40°.
4 Discussion
Understory shrub structures introduce unique and complex scattering environments for the incident light. We have provided the first empirical evidence on the seasonality of lingonberry and blueberry spectra in a single illumination direction and shown how changing the view angle affects the reflectance factor. By making the measurements in stable laboratory conditions, we have linked the temporal variations in the spectra to the prevailing spectral characteristics of the phenological stage of each measurement. We will next discuss all the presented results.
The spectral reflectance factors of both species were strongly influenced by the occurrences of different phenological stages. The largest changes in the lingonberry spectra were noticed during flowering and berrying. Given a sufficient spatial coverage of either flowers of lingonberry or lingonberries among the leaf cover (i.e. substitution of the visible green leaf material from the given view direction), the spectral BRFs of the shrubs changed. The whitish lingonberry flowers were noted to increase the BRF response in the entire visible domain while the glossy red and moist lingonberries brightened the BRF in red but darkened in NIR and SWIR domains. We speculate that the placement of the berries on top of the shrub structure influenced how they were detected in the spectral data: if the berries were under leaf cover, their effect on the overall spectra was ambiguous and minor.
The seasonality of blueberry spectra was most evident when comparing BRFs in red and NIR domains during transitions between spring, summer, and autumn. Blueberry goes through leaf development in spring, during which the spectrally low red-NIR contrast forest floor litter gets rapidly covered by the green, spectrally high red-NIR contrast leaf material. In autumn, blueberry shrubs go into senescence, a phenological stage of leaf degradation, during which the plant retrieves nutrients (including chlorophyll) from its leaves as it prepares for winter dormancy. For tree leaves, decrease in spectral contrast between red and NIR domains has been observed from summer to autumn (Hovi et al. 2017). The effect of senescence on the shrub spectra is further amplified by leaf drop which potentially exposes more of the underlying forest floor litter to the sensor. The effects of blueberry flowers and blueberries on the shrub spectra were not clear in the dataset (due to low number of flowers/berries present in the shrubs in the study area). Blueberry leaves were found more translucent of the two species over the measured spectral range (data not shown) and thus, were considered the main promotors of multiple scattering, explaining the observed low BRF in visible domain during full leaf cover. These results are similar to recently reported seasonal trends for tree leaf spectra showing rapid changes in their optical properties during leaf development in spring, which then revert in senescence (Mõttus et al. 2014; Hovi et al. 2017).
Both species showed typical spectral characteristics of green vegetation with strong absorption in red and high reflectance in NIR domains. At leaf level, these characteristics arise from (i) the presence of photosynthetically active chlorophyll pigments in the leaves, responsible for the strong energy absorption in visible domain, (ii) leaf thickness and the internal cell structure of leaves, promoting internal scattering and thus high NIR domain reflectance, (iii) water content, and (iv) waxiness of the leaf surface and its relative orientation to the incident light (Gates et al. 1965; Gausman et al. 1973). At canopy level, the spatial distribution and the amount of dominant scattering elements (i.e. leaves) within the 3D structure affect the strength of multiple scattering between leaves, branches, stems, and underlying material (Peltoniemi et al. 2005). There are some evidence that plant canopies made up of green leaves have larger relative spectral contrast in visible and NIR domains than that of individual leaves (Williams 1991; Rautiainen et al. 2018; Wang et al. 2018).
The vegetation indices (NDVI, MSI, and PSRI) and red-edge inflection point (REIP2) were all sensitive to plant phenology. The upward opening parabolic seasonal trend of blueberry NDVI indicated sprouting of leaves over the spectrally low contrast forest floor litter in early June, high leaf coverage over the summer, and degradation of chlorophyll in autumn. With lingonberry the most notable temporal variations of NDVI were observed during flowering and berrying stages as a result of strongly increased red BRF compared to relatively unaffected NIR domain BRF. MSI of lingonberry had only low seasonal sensitivity, while with blueberry the variations were notably connected to the transitions between phenological stages. The expansion of green blueberry leaf mass increased the moisture content above ground which, in turn, lowered the BRF ratio of SWIR and NIR domains. As expected, PSRI showed active response to relative changes of BRF in blue, red, and red-edge domains during leaf growing and senescence of blueberry. Also, similarly to the original observations by Merzlyak et al. (1999) on PSRI, the index was noted to ramp up with the presence of lingonberries in the shrubs. This happens because the red lingonberries induce a large increase of BRF in red compared to blue wavelength, a similar spectral contrasting observed with green leaves during senescence (Hovi et al. 2017). Finally, similarly to the three indices, REIP2 was highly sensitive to the seasonality of blueberry spectra, indicated by the temporal trend of a downward opening parabola. The red-edge location of blueberry BRF moved into longer wavelengths as the growing season advanced from spring (714 nm) to mid-summer (718 nm), after which REIP2 shifted again to shorter wavelengths towards autumn (710 nm). This is typical for deciduous green leaf vegetation where the seasonal changes of the chlorophyll content are strong (Moss and Rock 1991; Rautiainen et al. 2011; Nikopensius et al. 2015). For lingonberry, rather than responding to changes in the chemical composition of leaves, REIP2 was affected by the phenological stages of flowering and berrying, during which the red-edge shifted into shorter wavelengths.
Both lingonberry and blueberry shrubs showed strong anisotropy of reflectance in the principal plane by scattering the incident energy strongly backward and forward. This is typical for vegetation canopies under directional illumination, regardless of the scale (Sandmeier and Itten 1999; Peltoniemi et al. 2005; Rautiainen et al. 2007; Verrelst et al. 2008; Mõttus et al. 2012). The largest spectral BRFs for both species were observed when viewed near the direction of the illumination (i.e. hotspot) with lingonberry BRFs being slightly larger of the two. Tilting the sensor from nadir towards the hotspot affected strongly BRFs in blue, red, red-edge, and SWIR domains. In general, the backward scattering arises from structural properties of self-shadowing (minimum amount of shadows) and decreased canopy gap fraction at view angles deviating from nadir, and from coherent effect of electromagnetic waves (Hapke et al. 1996). It should also be noted that BRF measurements exactly from the direction of illumination are generally not possible due to sensor self-shadowing. The so-called dark spots, meaning the viewing directions of lowest spectral BRFs, were located between –15° and –25° forward. Dark spot occurs due to increased backshadowing effect in which the leaves shadow the rest of the structure (Sandmeier and Itten 1999). As the sensor was tilted even further forward towards the opposite of illumination direction (beyond –25°), the specular reflection dominated the anisotropy of reflectance. With reduced gap fraction, the more horizontally oriented glossy leaves of lingonberry were noted to result an especially strong specular effects in the forward direction (Ross and Marshak 1989).
The most applicable viewing angles for detecting the contribution of lingonberry flowers were those of slightly forward tilting in blue and red wavelength regions. The contributions of lingonberries on the shrub spectra, on the other hand, were most notable while viewing the shrubs from near-nadir angles and in the red wavelength region. In general, we assume that the amount of shadowed areas contributed the largest on the observed spectral variation when the viewing angle was changed. Having applied a clearly off-nadir illumination zenith angle (+40°), the strong backshadowing effect of the dense 3D shrub structure causes increasing shading of materials in the underlying vertical layers, including the forest floor litter (Kimes 1983). This results the visible proportions of illuminated and shaded canopy elements to depend on the view zenith angle.
Our results show similar trends of seasonal dwarf shrub spectra as previously conducted studies on understory reflectance characteristics by Rautiainen et al. (2011) and Nikopensius et al. (2015). Both studies aimed to differentiate forest fertility types (Cajander 1926) by the seasonality of their understory reflectance spectra. Rautiainen et al. (2011) suggested the peak of the growing season (early July) as the optimal time for discriminating forest types by their spectra. In this study, however, we showed that the characteristics of lingonberry and blueberry spectra differed mostly during spring, i.e., the leaf growing period of blueberry, and during stages of lingonberry flowering (mid-summer) and berrying (August to September). Another comparison of spectra can be made to those reported by Peltoniemi et al. (2005), who used the same instrument (FIGIFIGO) in field conditions for determining the spectra of several boreal understory species, including two samples of lingonberry and two samples of blueberry. Both the nadir and multiangular observations of that study are in line with our results. Yet, it should be mentioned that (i) all previous studies were conducted in varying illumination conditions, (ii) the spectrometer models were different, and (iii), when measuring BRF of surfaces with large natural spatial heterogeneity, spectral variation are unavoidably present in the data. Since we applied a previously introduced and validated measurement setup for the instrument, we encourage the reader to turn to a previous study by Suomalainen et al. (2009), where error sources are described in detail. Differing from the latest development stage of FIGIFIGO, we made the measurements with the fine tune mirror at a fixed angle (Hakala 2009). This induced small variation in the centre location of the sensor FOV as the sensor was tilted in zenith direction.
We scheduled our measurements to include several shrub samples at different phenological stages to maximize the spectral variability between the dominant species. All samples were collected from the same forest at close proximity to each other and the laboratory, to ensure similar growing conditions throughout the growing season as well as intact and moist samples. In the measurements, we avoided large gaps in the shrub canopies, while keeping in mind the natural structural heterogeneity. We also applied averaging of the nadir spectra after sensor rotation. However, we recognize that the approximation of the seasonal trends would improve by (i) collecting a larger number of samples from more than one forest and location, and (ii) by measuring physically larger samples that would enable several measurement spots per sample. Also, more detailed information on how the seasonality of shrub spectra is affected by the diversity of forest structure, namely different levels of canopy openness, understory composition, and soil properties, along with quantification of the effect of flowers and berries, would add to the value of future datasets.
The strong seasonality of spectra of both shrub species, as shown in this pilot study, promotes the development of new shrub mapping applications. We suggest that multitemporal, remotely sensed ground reference reflectance data, matched to the occurrences of specific phenological stages, especially in red and NIR domains, will improve the identification of common dwarf shrub species. The data can serve as training data for land cover classification applications of high spatial resolution imaging spectroscopy technologies, namely UAVs (unmanned aerial vehicles), as well as future airborne and spaceborne systems. Although multiangular data provided only small increased value over the traditional nadir view data when detecting plant phenological stages, the collected data are important input also for future boreal forest reflectance models needed in physically-based interpretation of e.g., optical satellite images, or for simulating albedo and productivity of entire forest ecosystems, not only tree layers.
Presented spectral data are openly available through SPECCHIO Spectral Information System (Hueni et al. 2009) at https://specchio.ch/ under campaign name lingonberry and blueberry spectra.
Acknowledgements
This study received support from the Academy of Finland (BOREALITY, grant No 286390). This project has also received funding from the European Research Council (ERC) under the European Union’s Horizon 2020 research and innovation programme (grant agreement No 771049). The article reflects only the authors’ view and that the Agency is not responsible for any use that may be made of the information it contains. The authors would like to thank Juha Suomalainen (FGI), Teemu Hakala (FGI), and Aarne Hovi (Aalto University) for their help with the laboratory measurements and for commenting parts of the manuscript.
References
Cajander A.K. (1926). The theory of forest types. Acta Forestalia Fennica 29: 1–108. https://doi.org/10.14214/aff.7193.
Eriksson H.M., Eklundh L., Kuusk A., Nilson T. (2006). Impact of understory vegetation on forest canopy reflectance and remotely sensed LAI estimates. Remote sensing of Environment 103(4): 408–418. https://doi.org/10.1016/j.rse.2006.04.005.
Gates D.M., Keegan H.J., Schleter J.C., Weidner V.R. (1965). Spectral properties of plants. Applied Optics 4(1): 11–20. https://doi.org/10.1364/AO.4.000011.
Gausman H.W., Allen W.A., Wiegand C.L., Escobar D.E., Rodriguez R.R., Richardson A.J. (1973). The leaf mesophylls of twenty crops, their light spectra, and optical and geometrical parameters. Technical Bulleting No. 1465, Agricultural Research Service, United States Department of Agriculture, Texas Agricultural Experiment Station.
Guyot G., Baret F. (1988). Utilisation de la Haute Resolution Spectrale pour Suivre L’etat des Couverts Vegetaux. Procedings of 4th international conference on Spectral Signatures of Objects in Remote Sensing, Aussois, France, 18–22 January. ESA SP-287. p. 279–286. [In French].
Hakala T. (2009). Improvements, calibration, and accuracy of the Finnish Geodetic Institute Field Goniospectrometer. Master’s thesis. Helsinki University of Technology. http://urn.fi/URN:NBN:fi:aalto-201203071280.
Hallik L., Kull O., Nilson T., Peñuelas J. (2009). Spectral reflectance of multispecies herbaceous and moss canopies in the boreal forest understory and open field. Canadian Journal of Remote Sensing 35(5): 474–485. https://doi.org/10.5589/m09-040.
Hapke B., DiMucci D., Nelson R., Smythe W. (1996). The cause of the hotspot in vegetation canopies and soils: shadow-hiding versus coherent backscatter. Remote Sensing of Environment 58(1): 63–68. https://doi.org/10.1016/0034-4257(95)00257-X.
Hovi A., Raitio P., Rautiainen M. (2017). A spectral analysis of 25 boreal tree species. Silva Fennica 51(4) article 7753. https://doi.org/10.14214/sf.7753.
Hovi A., Forsström P., Mõttus M., Rautiainen M. (2018). Evaluation of accuracy and practical applicability of methods for measuring leaf reflectance and transmittance spectra. Remote Sensing 10(1) article 25. https://doi.org/10.3390/rs10010025.
Hueni A., Nieke J., Schopfer J., Kneubühler M., Itten K. (2009). The spectral database SPECCHIO for improved long term usability and data sharing. Computers & Geosciences 35(3): 557–565. https://doi.org/10.1016/j.cageo.2008.03.015.
Hunt E.R.Jr., Rock B.N. (1989). Detection of changes in leaf water content using near- and middle-infrared reflectances. Remote Sensing of Environment 30(1): 43–54. https://doi.org/10.1016/0034-4257(89)90046-1.
Jiang Y., Li C., Takeda F. (2016). Nondestructive detection and quantification of blueberry bruising using near-infrared (NIR) hyperspectral reflectance imaging. Scientific Reports 6 article 35679. https://doi.org/10.1038/srep35679.
Kimes D.S. (1983). Dynamics of directional reflectance factor distributions for vegetation canopies. Applied Optics 22(9): 1364–1372. https://doi.org/10.1364/AO.22.001364.
Kuusinen N., Kolari P., Levula J., Porcar-Castell A., Stenberg P., Berninger F. (2012). Seasonal variation in boreal pine forest albedo and effects of canopy snow on forest reflectance. Agricultural and Forest Meteorology 164: 53–60. https://doi.org/10.1016/j.agrformet.2012.05.009.
Kuusk A., Lang M., Nilson T. (2004). Simulation of the reflectance of ground vegetation in sub-boreal forests. Agricultural and Forest Meteorology 126(1–2): 33–46. https://doi.org/10.1016/j.agrformet.2004.05.004.
Leiva-Valenzuela G.A., Lu R., Aguilera J.M. (2013). Prediction of firmness and soluble solids content of blueberries using hyperspectral reflectance imaging. Journal of Food Engineering 115(1): 91–98. https://doi.org/10.1016/j.jfoodeng.2012.10.001.
Leiva-Valenzuela G.A., Lu R., Aguilera J.M. (2014). Assessment of internal quality of blueberries using hyperspectral transmittance and reflectance images with whole spectra or selected wavelengths. Innovative Food Science and Emerging Technologies 24: 2–13. https://doi.org/10.1016/j.ifset.2014.02.006.
Lindhagen A., Hörnsten L. (2000). Forest recreation in 1977 and 1997 in Sweden: changes in public preferences and behaviour. Forestry: An International Journal of Forest Research 73(2): 143–153. https://doi.org/10.1093/forestry/73.2.143.
Merzlyak M.N., Gitelson A.A., Chivkunova O.B., Rakitin V.Yu. (1999). Non-destructive optical detection of pigment changes during leaf senescence and fruit ripening. Physiologia Plantarum 106: 135–141. https://doi.org/10.1034/j.1399-3054.1999.106119.x.
Miller J.R, White H.P., Chen J.M., Peddle D.R., McDermid G., Fournier R.A., Shepherd P., Rubinstein I., Freemantle J., Soffer R., LeDrew E. (1997). Seasonal change in understory reflectance of boreal forests and influence on canopy vegetation indices. Journal of Geophysical Research 102(D24): 29475–29482. https://doi.org/10.1029/97JD02558.
Moss D.M., Rock B.N. (1991). Analysis of red edge spectral characteristics and total chlorophyll values from red spruce (Picea rubens) branch segments from Mt. Moosilaukse, NH, USA, Proceedings of IGARSS’91 remote sensing: global monitoring for earth management, Espoo, Finland. IEEE. https://doi.org/10.1109/IGARSS.1991.579470.
Mõttus M., Rautiainen M., Schaepman M.E. (2012). Shoot scattering phase function for Scots pine and its effect on canopy reflectance. Agricultural and Forest Meteorology 154–155: 67–74. https://doi.org/10.1016/j.agrformet.2011.10.012.
Mõttus M., Sulev M., Hallik L. (2014). Seasonal course of the spectral properties of alder and birch leaves. IEEE Journal of Selected Topics in Applied Earth Observations and Remote Sensing 7(6): 2496–2505. https://doi.org/10.1109/JSTARS.2013.2294242.
Mõttus M., Hovi A., Rautiainen M. (2017). Theoretical algorithm and application of a double-integrating sphere system for measuring leaf transmittance and reflectance spectra. Applied Optics 56(3): 563–571. https://doi.org/10.1364/AO.56.000563.
Nicodemus F.E., Richmond J.C., Hsia J.J. (1977). Geometrical considerations and nomenclature for reflectance. National Bureau of Standards, US Department of Commerce. NBS Monograph 160. https://doi.org/10.6028/NBS.MONO.160.
Nikopensius M., Pisek J., Raabe K. (2015). Spectral reflectance patterns and seasonal dynamics of common understory types in three mature hemi-boreal forests. Internal Journal of Applied Earth Observation and Geoinformatics 43: 84–91. https://doi.org/10.1016/j.jag.2014.11.012.
Nilson T., Suviste S., Lükk T., Eenmäe A. (2008). Seasonal reflectance course of some forest types in Estonia from a series of Landsat TM and SPOT images and via simulation. International Journal of Remote Sensing 29(17–18): 5073–5091. https://doi.org/10.1080/01431160802167543.
Peltoniemi J.I., Kaasalainen S., Näränen J., Rautiainen M., Stenberg P., Smolander H., Smolander S., Voipio P. (2005). BRDF measurement of understory vegetation in pine forests: dwarf shrubs, lichen, and moss. Remote Sensing of Environment 94(3): 343–354. https://doi.org/10.1016/j.rse.2004.10.009.
Peltoniemi J.I., Hakala T., Suomalainen J., Honkavaara E., Markelin L., Gritsevich M., Eskelinen J., Jaanson P., Ikonen E. (2014). Technical notes: a detailed study for the provision of measurement uncertainty and traceability for goniospectrometers. Journal of Quantitative Spectroscopy and Radiative Transfer 146: 376–390. https://doi.org/10.1016/j.jqsrt.2014.04.011.
Pisek J., Chen J.M, Miller J.R., Freemantle J.R., Peltoniemi J.I., Simic A. (2010). Mapping forest background reflectance in a boreal region using multiangle Compact Airborne Spectrographic Imager data. IEEE Transactions on Geoscience and Remote Sensing 48(1): 499–510. https://doi.org/10.1109/TGRS.2009.2024756.
Pisek J., Chen J.M., Kobayashi H., Rautiainen M., Schaepman M.E., Karnieli A., Sprinstin M., Ryu Y., Nikopensius M., Raabe K. (2016). Retrieval of seasonal dynamics of forest understory reflectance from semiarid to boreal forests using MODIS BRDF data. Journal of Geophysical Research: Biogeosciences 121(3): 855–863. https://doi.org/10.1002/2016JG003322.
Puupponen-Pimiä R., Nohynek L., Alakomi H.-L., Oksman-Caldentey K.-M. (2005). Bioactive berry compounds – novel tools against human pathogens. Applied Microbiology and Biotechnology 67(1): 8–18. https://doi.org/10.1007/s00253-004-1817-x.
Rautiainen M., Lukeš P. (2015). Spectral contribution of understory to forest reflectance in a boreal site: an analysis of EO-1 Hyperion data. Remote Sensing of Environment 171: 98–104. https://doi.org/10.1016/j.rse.2015.10.009.
Rautiainen M., Stenberg P. (2005). Application of photon recollision probability in coniferous canopy reflectance simulations. Remote Sensing of Environment 96(1): 98–107. https://doi.org/10.1016/j.rse.2005.02.009.
Rautiainen M., Suomalainen J., Mõttus M., Stenberg P., Voipio P., Peltoniemi J., Manninen T. (2007). Coupling forest canopy and understory reflectance in the Arctic latitudes of Finland. Remote Sensing of Environment 110(3): 332–343. https://doi.org/10.1016/j.rse.2007.03.002.
Rautiainen M., Mõttus M., Heiskanen J., Akujärvi A., Majasalmi T., Stenberg P. (2011). Seasonal reflectance dynamics of common understory types in a northern European boreal forest. Remote Sensing of Environment 115(12): 3020–3028. https://doi.org/10.1016/j.rse.2011.06.005.
Ross J., Marshak A. (1989). The influence of leaf orientation and the specular component of leaf reflectance on the canopy bidirectional reflectance. Remote Sensing of Environment 27(3): 251–260. https://doi.org/10.1016/0034-4257(89)90086-2.
Rouse J.W.Jr., Haas R.H., Schell J.A., Deering D.W. (1974). Monitoring vegetation systems in the Great Plains with ERTS. NASA, Goddard Space Flight Center Third ERTS-1 Symposium 1(A). p. 309–317.
Sandmeier S.R., Itten K.I. (1999). A Field Goniometer System (FIGOS) for acquisition of hyperspectral BRDF data. IEEE Transactions of Geoscience and Remote Sensing 37(2): 978–986. https://doi.org/10.1109/36.752216.
Schaepman-Strub G., Schaepman M.E., Painter T.H., Dangel S., Martonchik J.V. (2006). Reflectance quantities in optical remote sensing – definitions and case studies. Remote Sensing of Environment 103(1): 27–42. https://doi.org/10.1016/j.rse.2006.03.002.
Suomalainen J., Hakala T., Peltoniemi J., Puttonen E. (2009). Polarised multiangular reflectance measurements using the Finnish Geodetic Institute Field Goniospectrometer. Sensors 9(5): 3891–3907. https://doi.org/10.3390/s90503891.
Turtiainen M., Salo K., Saastamoinen O. (2007). Mustikan ja puolukan marjasatojen valtakunnalliset ja alueelliset kokonaisestimaatit Suomen suometsissä. [National and regional estimates of blueberry (Vaccinium myrtillus L.) and lingonberry (V. vitis-idaea L.) yields on peatlands in Finland]. Suo 58(3–4):87–98. http://www.suo.fi/article/9857.
Turtiainen M., Salo K., Saastamoinen O. (2011). Variations of yield and utilisation of bilberries (Vaccinium myrtillus L.) and cowberries (V. vitis-idaea L.) in Finland. Silva Fennica 45(2): 237–251. https://doi.org/10.14214/sf.115.
Verrelst J., Schaepman M.E., Koetz B., Kneubühler M. (2008). Angular sensitivity analysis of vegetation indices derived from CHRIS/PROBA data. Remote Sensing of Environment 112: 2341–2353. https://doi.org/10.1016/j.rse.2007.11.001.
Wang J., Chen Y., Chen F., Shi T., Wu G. (2018). Wavelet-based coupling of leaf and canopy reflectance spectra to improve the estimation accuracy of foliar nitrogen concentration. Agricultural and Forest Meteorology 248: 306–315. https://doi.org/10.1016/j.agrformet.2017.10.017.
Williams D.L. (1991). A comparison of spectral reflectance properties at the needle, branch, and canopy level for selected conifer species. Remote Sensing of Environment 35(2–3): 79–93. https://doi.org/10.1016/0034-4257(91)90002-N.
Total of 47 references.
