Mikko Kukkonen  ,
Eetu Kotivuori,
Matti Maltamo,
Lauri Korhonen,
Petteri Packalen
,
Eetu Kotivuori,
Matti Maltamo,
Lauri Korhonen,
Petteri Packalen
Volumes by tree species can be predicted using photogrammetric UAS data, Sentinel-2 images and prior field measurements
Kukkonen M., Kotivuori E., Maltamo M., Korhonen L., Packalen P. (2021). Volumes by tree species can be predicted using photogrammetric UAS data, Sentinel-2 images and prior field measurements. Silva Fennica vol. 55 no. 1 article id 10360. https://doi.org/10.14214/sf.10360
Highlights
- A UAS-based species-specific forest inventory approach that avoids new field measurements is presented
- Models were constructed using previously measured training plots and remotely sensed data
- Bi-seasonal Sentinel-2 data were beneficial in the prediction of species-specific volumes
- RMSE values associated with the prediction of volumes by tree species and total volume at the validation plot level were 33.4–62.6% and 9.0%, respectively.
Abstract
Photogrammetric point clouds obtained with unmanned aircraft systems (UAS) have emerged as an alternative source of remotely sensed data for small area forest management inventories (FMI). Nonetheless, it is often overlooked that small area FMI require considerable field data in addition to UAS data, to support the modelling of forest attributes. In this study, we propose a method whereby tree volumes by species are predicted with photogrammetric UAS data and Sentinel-2 images, using models fitted with airborne laser scanning data. The study area is in a managed boreal forest area in Eastern Finland. First, we predicted total volume with UAS point cloud metrics using a prior regression model fitted in another area with ALS data. Tree species proportions were then predicted by k nearest neighbor (k-NN) imputation based on bi-seasonal Sentinel-2 images without measuring new field plot data. Species-specific volumes were then obtained by multiplying the total volume by species proportions. The relative root mean square error (RMSE) values for total and species-specific volume predictions at the validation plot level (30 m × 30 m) were 9.0%, and 33.4–62.6%, respectively. Our approach appears promising for species-specific small area FMI in Finland and in comparable forest conditions in which suitable field plots are available.
Keywords
forest inventory;
satellite image;
open data;
drone;
stereo matching;
unmanned aircraft system
-
Kukkonen,
University of Eastern Finland, School of Forest Sciences, P.O. Box 111, FI-80101 Joensuu, Finland
E-mail
mikko.kukkonen@uef.fi
- Kotivuori, University of Eastern Finland, School of Forest Sciences, P.O. Box 111, FI-80101 Joensuu, Finland E-mail eetu.kotivuori@uef.fi
- Maltamo, University of Eastern Finland, School of Forest Sciences, P.O. Box 111, FI-80101 Joensuu, Finland E-mail matti.maltamo@uef.fi
- Korhonen, University of Eastern Finland, School of Forest Sciences, P.O. Box 111, FI-80101 Joensuu, Finland E-mail lauri.korhonen@uef.fi
- Packalen, University of Eastern Finland, School of Forest Sciences, P.O. Box 111, FI-80101 Joensuu, Finland E-mail petteri.packalen@uef.fi
Received 24 April 2020 Accepted 15 January 2021 Published 21 January 2021
Views 82697
Available at https://doi.org/10.14214/sf.10360 | Download PDF

1 Introduction
Application of stereo photogrammetric point cloud data from unmanned aircraft systems (UAS) for forest inventories has received considerable attention recently (e.g. Guimarães et al. 2020). On-demand data availability, relatively low acquisition costs and the capability to carry different payloads make them an attractive data source for many applications. However, UAS have notable disadvantages that need to be taken into consideration in a forest inventory context. Firstly, UAS are currently technologically restricted to small areas compared to conventional forest inventories that use airborne laser scanning (ALS) to collect data. In the literature, it is typical to find UAS data acquisitions in the order of hundreds of hectares, whereas a typical ALS forest research area is measured in tens of thousands of hectares. Secondly, in many countries, UAS are regulated by strict aviation laws and regulations, which can limit the applicability of UAS by the imposition of restrictions on flying altitudes and the enforcement of visual line of sight rules. However, exceptions can be made by the reservation of airspace in advance.
These characteristics of photogrammetric UAS data can impose restrictions in their applicability in forest inventories. As opposed to ALS, which can penetrate through the canopy and provide information on the lower canopy and ground layers, photogrammetric data is confined to the upper surfaces, which are visible in two or more images. In 3D remote sensing of forests, the aim is to observe the canopy height in relation to the ground (Næsset 2002). This is commonly addressed by initially creating a digital terrain model (DTM) from points classified as ground, and then subtracting the height of the DTM from each point. This is referred to as normalization of points to above ground level (AGL). As photogrammetric data is incapable of penetrating the canopy, ground can only be reconstructed if it is visible in two or more images. Poorly distributed or an insufficient number of ground classified points could lead to errors in the calculation of AGL for a subset of points in the data. Previously acquired ALS data can be used to create an accurate DTM (Kukkonen et al. 2017), or ground classified points from the photogrammetric point cloud can be used (Kachamba et al. 2016). The former is restricted by the availability of ALS data from the area, whereas the application of the latter is dictated by canopy closure, topography of the area, the ground sample distance (GSD) of the images, and the quality of the stereo matching process.
Photogrammetric UAS data has been used to predict different forest inventory attributes, such as height (Ota et al. 2017; Krause et al. 2019), basal area (Alonzo et al. 2018) and volume (Goodbody et al. 2017; Jayathunga et al. 2018; Cao et al. 2019; Kotivuori et al. 2020) using area-based approaches (ABA). Tree species have been classified, principally using individual tree detection (ITD) methods (Nevalainen et al. 2017; Brovkina et al. 2018; Franklin and Ahmed 2018) in which multispectral or hyperspectral images are the primary component. Tuominen et al. (2017) predicted stand volume, mean height (h), mean diameter, and volume by tree species using photogrammetric UAS data and hyperspectral image data using ABA. They reported promising plot-level relative root mean square errors (%RMSE) of 34.5, 57.2 and 42.0 for pine, spruce and broadleaved trees, respectively.
Although photogrammetric UAS data can offer possibilities for small area forest inventories, an often-overlooked issue is the requirement of new local field measurements. The collection of comprehensive and representative field sample data from small areas can be prohibitively expensive and time consuming. Extensive work has been carried out to minimize the number of field plots, while maintaining the reliability of the predictions (Junttila et al. 2013). It is also important to consider the spatial distribution of the training data within the inventory area (Gobakken et al. 2013). UAS are technologically and legislatively limited to be cost-efficient in capturing image data from small areas compared to airborne remote sensing. For this reason, the collection of a representative sample of field plots from an inventory area, which costs less than alternative methods (e.g. traditional ocular standwise inventory), can be a challenge. This is partly because forest stands within a single estate (albeit a relatively small area) can vary greatly in species composition and development class. Reducing or excluding fieldwork would increase the cost-efficiency of UAS-based forest inventories considerably and facilitate operational applications.
Work by Kotivuori et al. (2020) highlighted the applicability of photogrammetric UAS data for the prediction of total growing stock volumes, without new field measurements, using ABA. However, the prediction of forest attributes by tree species is an essential requirement in most forest management inventories. Such information is required in forest management planning and silviculture when decisions on treatments and harvesting schedules are made. Also, species-specific growth models or allometric models of tree attributes require tree species information.
Traditionally, optical information from aerial images has been used to facilitate the prediction of tree species (Packalén and Maltamo 2006; Hill et al. 2010; Sedliak et al. 2017). In the case of UAS-based inventories, the use of aerial image data to predict tree species could prove to be problematic due to the need for local training data for the modeling process. In the literature, no method has been proposed to date that does not rely either on extensive field reference data at the tree-level, or manual photo interpretation (i.e. field reference data) of remotely sensed data. Both approaches require additional work and limit the operational value of UAS-based inventories. In addition, the spectral properties of a tree species are not always constant during UAS data acquisitions. For example, variations in weather and solar angle may influence the target reflectance, even if the data are collected during a single day. If the acquisitions are extended over several days or even weeks, additional issues related to phenology, site conditions, and tree stress may occur. Possible changes in sensor configuration have a similar effect. Together with the large within-species variation, these issues make aerial image-based species classification problematic (Korpela et al. 2011, 2014).
An alternative to aerial images is satellite imagery, which is particularly beneficial when field data outside of the target inventory area are used in modeling, thereby foregoing the measurement of field data in-situ. If field plots are available within a cloud-free satellite image that covers the area of interest at the time of UAS data acquisition, issues related to variations in solar angle, weather conditions and phenology, for example, can be avoided by the construction of a satellite-based species classification model. An increasing number of studies have reported positive results when using Sentinel-2 (S2) satellite images in the prediction of tree species (Immitzer et al. 2016; Kukkonen et al. 2018; Persson et al. 2018; Grabska et al. 2019). Kukkonen et al. (2018) found that the performance of S2 spectral features in the prediction of volumes by tree species was almost comparable to the spectral features of aerial images. Persson et al. (2018) found multi-temporal Sentinel-2 images useful in the prediction of tree species for predominantly single species forest plots in central Sweden. Grabska et al. (2019) found that using multi-temporal Sentinel-2 data, instead of single date images, improved the classification of tree species considerably in complex, mixed forests of the Polish Carpathian Mountains. Furthermore, albeit in a Mediterranean environment, Puletti et al. (2018) concluded that multi-temporal S2 images provide better classification results for forest categories (pure coniferous, pure broadleaved and mixed forests) than single season S2 images.
In Finland, much of data collected using government funding is publicly available. For instance, ALS datasets, covering the entire land area of Finland, collected by the National Land Survey of Finland (NLS) and Finnish Forest Centre (SMK), are publicly available for download (NLS 2019). In addition, SMK has released the sample plot data used in remote sensing-based FMI for download (SMK 2019). Many satellite data products, especially the so-called moderate resolution satellite images, are also openly available globally (Sentinel Hub 2020).
In this study, we demonstrate how the primary restrictions of UAS in forest inventories can be overcome with the aid of publicly available data sets. We propose an area-based method to predict tree species-specific volumes for small forest areas without the use of new field measurements. Instead, we employ open ALS data, bi-seasonal Sentinel-2 satellite images, and previously measured FMI field plots. Only UAS data are collected specifically from the target area of interest. The primary objective of this study is to assess whether Sentinel-2 satellite data and photogrammetric UAS data can be used to predict volumes by tree species for small area forest inventories without any new field work or manual photo interpretation of remotely sensed data.
2 Materials
The study site is located in North Karelia, Eastern Finland (62°31´N, 29°23´E) (Fig. 1). The dominant tree species in the area are Scots pine (Pinus sylvestris (L.)), Norway spruce (Picea abies (L.) Karst.) and broadleaved tree species, particularly downy birch (Betula pubescens Ehrh.) and silver birch (B. pendula Roth). The forests are predominantly privately owned, with timber production the main objective of forest management and planning.
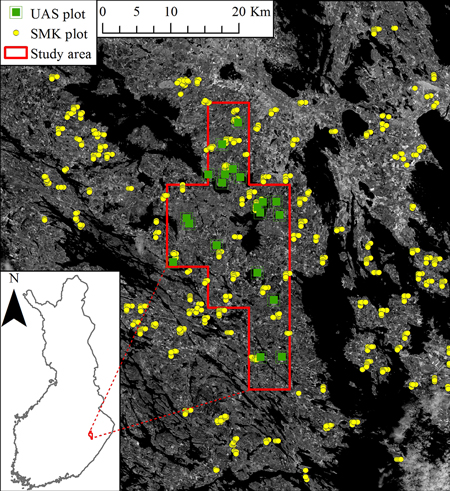
Fig. 1. Location of the species-specific volume prediction study area and field plots in Finland. Sentinel-2 SWIR2 band (b12) background. UAS means unmanned aircraft system, SMK means Finnish Forest Centre.
2.1 Field Data
A total of 20 square validation plots (30 m × 30 m) were measured in the summer 2017 (Table 1, Fig. 1). Because we could only collect 20 plots, they were selected subjectively so that the dominant tree species and development class (i.e. maturity) distributions would represent the whole range of variation occurring in the area. Tree species, height and diameter at breast height (DBH) were recorded for all trees with DBH ≥ 5 cm. The stem volumes were calculated as a function of diameter and height using the models of Laasasenaho (1982). The coordinates of every measured tree were determined as presented in Korpela et al. (2007), except that initial tree locations were extracted from the ALS-based canopy height model (CHM). With known tree locations, the 20 validation (30 m × 30 m) plots were sub-divided into 80 square 15 m × 15 m plots that were used as “grid cells”. The larger validation plots (30 m × 30 m) thus mimic forest management units i.e. stands. Predictions for validation plots were calculated using ABA by computing the mean value of predictions at the 15 m × 15 m level. This results in an averaging effect, where over- and under-predictions compensate for one another.
| Table 1. Mean and standard deviation (in parentheses) of the main forest attributes of the validation field plots and Finnish Forest Centre (SMK) plots. The SMK field plots are used only to predict the tree species proportions. The validation field plots are used to evaluate the performance of predictions. DGM is the diameter of the basal area median tree. Dominance is the percentage of a tree species with respect to the summed volumes of all tree species. | |||||
| Volume (m3 ha–1) | Lorey’s height (m) | DGM (cm) | Dominance (%) | ||
| Pine | Validation | 59.5 (100.2) | 18.3 (7.2) | 22.9 (7.1) | 24.8 |
| SMK | 80.0 (100.6) | 17.8 (5.7) | 21.7 (8.4) | 36.3 | |
| Spruce | Validation | 133.7 (132.1) | 18.6 (7.8) | 18.4 (10.1) | 55.8 |
| SMK | 98.0 (134.7) | 14.5 (6.7) | 17.5 (9.3) | 44.5 | |
| Broadleaved | Validation | 46.5 (64.9) | 18.8 (6.9) | 16.8 (8.4) | 19.4 |
| SMK | 42.2 (63.8) | 15.6 (5.5) | 14.9 (7.8) | 19.2 | |
| Total | Validation | 239.6 (132.5) | 21.2 (6.2) | 22.4 (7.2) | 100.0 |
| SMK | 220.8 (122.0 | 17.8 (5.0) | 20.9 (7.4) | 100.0 | |
A set of 785 publicly available FMI sample plots were used as training data for the prediction of tree species proportions in the validation plots (Table 1). These training plots were measured in summer 2016 by SMK. Training plots were distributed over a larger area than the validation plots (see Fig. 1). Plots had a radius of either 5.64 m (sapling stands where h > 1.3 m and DBH < 8 cm), 12.62 m (mature forests where stem number < 800 per hectare) or 9.00 m (other development classes). Seedling stands (h < 1.3 m) were excluded. The Trimble ProXRT global navigation satellite system (GNSS) was used together with an external L1/L2 antenna elevated to 5 m to determine the plot center locations. DBH and tree species were recorded for each tree with DBH ≥ 5 cm. Heights were measured for sample trees and the heights of the tally trees were predicted with height models (Eerikäinen 2009) that were calibrated for each plot. Stem volumes were calculated in a similar manner as in the validation plots and aggregated to the plot-level by tree species. A comparison of the forest attributes in the validation and FMI field plots is presented in Table 1.
2.2 UAS- and spaceborne images
Nadir UAS images were acquired from the validation plots during summer 2017 (June 20–August 23). Images were taken with a DJI Inspire 1 v2.0 quadcopter using a Zenmuse X3 camera. Images were captured from an altitude of 75 m above the take-off location of the quadcopter, resulting in a nominal GSD of ~3.2 cm at ground-level. Images were captured from each field plot using three flight lines with a lateral overlap of 60% and a forward overlap of 90%. The center of the field plot was situated in the middle of the central flight line. Photogrammetric processing of images was carried out using version 1.3 of Agisoft Photoscan (Agisoft 2017). The software has since been renamed Agisoft Metashape. Point cloud processing in Photoscan was performed without using ground control points (GCP), dense cloud quality was set to “high” and point cloud filtering was set to “mild”.
Sentinel-2B satellite images from the middle (9 July 2017, hereafter July) and the end (24 September 2017, hereafter September) of the growing season were used. The same images covered both the training and the validation plots. Images were downloaded as Level-1C products from the Copernicus Open Access Hub (https://scihub.copernicus.eu) and transformed to Level-2A products (bottom-of-atmosphere corrected reflectance) using Sen2Cor (Main-Knorn et al. 2017). The spectral bands of Sentinel-2B used in this study are presented in Table 2.
| Table 2. Spectral bands for the Sentinel-2B sensors used in the prediction of tree species proportions. | |||
| Band | Central Wavelength (nm) | Bandwidth (nm) | Resolution (m) |
| 1 – Coastal aerosol | 442.2 | 21 | 60 |
| 2 – Blue (B) | 492.1 | 66 | 10 |
| 3 – Green (G) | 559.0 | 36 | 10 |
| 4 – Red (R) | 664.9 | 31 | 10 |
| 5 – Red edge 1 (RE1) | 703.8 | 16 | 20 |
| 6 – Red edge 2 (RE2) | 739.1 | 15 | 20 |
| 7 – Red edge 3 (RE3) | 779.7 | 20 | 20 |
| 8 – Near infrared (NIR) | 832.9 | 106 | 10 |
| 8a – Near infrared narrow (NIRn) | 864.0 | 22 | 20 |
| 9 – Water vapor | 943.2 | 21 | 60 |
| 10 – Shortwave infrared / Cirrus | 1376.9 | 30 | 60 |
| 11 – Shortwave infrared 1 (SWIR1) | 1610.4 | 94 | 20 |
| 12 – Shortwave infrared 2 (SWIR2) | 2185.7 | 185 | 20 |
3 Methods
We propose a method for predicting volumes by species that only requires an investment in UAS data acquisition. Laborious reference measurements in the field, or in a virtual environment, are replaced by transferring the required prediction models from a nearby area. In short, the method consists of four steps:
i. Collection of UAS image data without the use of GCP.
ii. Prediction of total growing stock volume using a generic model linking plot measurements and point cloud metrics using publicly available data.
iii. Imputation of tree species proportions using Sentinel-2 satellite images and publicly available (FMI) field plots.
iv. Calculation of volume by species with total volumes and tree-species proportions.
3.1 Point cloud processing
No auxiliary ALS data was used in the scaling of point heights to ground-level. Instead, points from the photogrammetric UAS data were classified as ground, using the approach proposed by Axelsson (2000). A triangulated irregular network (TIN) was created from the points classified as ground to form a digital terrain model (DTM). The AGL heights for the photogrammetric UAS data were then acquired by subtracting the DTM from the point heights. Ground classification and AGL computation were performed before the validation plots were clipped from the point clouds to obtain as many ground observations as possible both within and outside the plots.
3.2 Total volume prediction
Total volumes for the 15 m × 15 m validation sub-plots (n = 80) were predicted with a regional model presented in Kotivuori et al. (2020). It is a generic area-based model (Eq. 1) for total stem volume that was fitted using publicly available ALS and FMI field plot data. The predictor variables of the model were selected by investigating the variable combination that produced the smallest RMSE value in OLS (ordinary least squares) estimation. The final model was fitted in a nonlinear form using nonlinear generalized least squares (NGLS). A detailed description of the model fitting can be found in Kotivuori et al. (2020).
![]()
where V denotes predicted total volume, BL = 1 in deciduous dominated plots and BL = 0in coniferous dominated plots, havg is the average height of photogrammetric UAS data and hmax is the maximum height of photogrammetric UAS data within a plot. Dominant tree species (BL) was obtained from the predicted tree species proportions, as explained in detail in the next section.
3.3 Prediction of tree species proportions and species-specific volumes
Tree species proportions were predicted for the 15 m × 15 m validation sub-plots with k nearest neighbor (k-NN) imputation using satellite image features (Table 3), and FMI plots as training data. Satellite image features for the plots were calculated by weighting the values of each pixel in relation to its coverage in the plot. Distance to the training sample observations was determined with the most similar neighbor (MSN) distance metric (Moeur and Stage 1995). Imputed value was calculated as the mean of selected k-NN. After preliminary testing, five nearest neighbors (k = 5) and 15 features were used.
| Table 3. Satellite image features used in the prediction of tree species proportions. Subscript b1–12 denotes band number; band wavelengths are explained in Table 2. Subscript July denotes that the feature is computed from a July image, Sep denotes that the feature is computed from a September image. | |
| Feature abbreviation | Explanation |
| mean(b1–12)July, Sep | Mean |
| ratio(b1–12)July, Sep | Ratio of bands (b1–12)July, Sep / (b1–12)July, Sep |
Given the large number of candidate features employed in the imputation of tree species proportions, all possible combinations of predictor variables for the k-NN model could not be tested. The features were selected using a heuristic optimization algorithm, i.e. simulated annealing (Kirkpatrick et al. 1983) using FMI field plots as training data. As the solution for a given iteration of simulated annealing is not deterministic but is instead a good estimate of the optimal solution, the feature selection was iterated multiple times. Predictions for the 15 m × 15 m validation sub-plots were obtained as an average of the predicted tree species proportions from 2500 k-NN models. Features were ranked with the frequency (%) by which they were included in the models over all iterations in order to analyze which Sentinel-2 features were most useful in the discrimination of tree species.
Tree species-specific volumes were calculated for the 15 m × 15 m validation sub-plots by multiplying the predicted total volume by the proportion of the respective tree species. These predictions were then aggregated to the 30 × 30 m validation plots from the four 15 m × 15 m validation sub-plots within them.
Prediction errors were assessed at the 30 m × 30 m validation plot-level with RMSE and mean difference (MD) values (Eqs. 2–5).


where yi is the observed value of y in the field plot i, ![]() is the predicted value of y in the field plot i,
is the predicted value of y in the field plot i, ![]() is the observed mean of y in the field plots, and n is the number of field plots.
is the observed mean of y in the field plots, and n is the number of field plots.
4 Results
The ten most important Sentinel-2 features for the prediction of tree species proportions (according to the frequency by which they were included in the k-NN model after feature selection) are presented in Table 4. Both July and September satellite image features were frequently selected, although the majority of the features were calculated from the September images. The most important feature, by a substantial margin, was the SWIR2 band from the July images. Other important bands that appeared more than once in the top 10 were: RSep, GSep, RE2Sep and BSep. Ratios of different bands, both from the same season and between seasons, constituted a substantial proportion of the important features (8 out of 10).
| Table 4. Top 10 most important Sentinel-2 features for the prediction of tree species proportions with k nearest neighbor (k-NN) imputation. Tree species proportions are used in the prediction of volumes by tree species. Frequency indicates the proportion of the models from 1000 iterations of variable selection that contained that variable. Variables are described in Table 2. | |
| Feature | Frequency (%) |
| 1 – (SWIR2)July | 81.8 |
| 2 – (SWIR2)July / (R)Sep | 31.3 |
| 3 – (R)Sep | 29.2 |
| 4 – (R)Sep / (G)Sep | 26.0 |
| 5 – (SWIR2)July / (B)Sep | 24.1 |
| 6 – (SWIR2)July / (RE1)Sep | 24.0 |
| 7 – (R)Sep / (RE2)Sep | 23.3 |
| 8 – (G)Sep / (RE2)Sep | 22.9 |
| 9 – (R)Sep / (NIRn)Sep | 22.8 |
| 10 – (B)Sep / (NIR)Sep | 22.0 |
The prediction errors associated with the tree species proportions in the 30 m × 30 m validation plots are presented in Table 5. The relative RMSE value associated with the proportion of pine was quite high (63.8%), while the absolute RMSE value was more modest (17.9 percentage points (p.p.)). The relative RMSE values associated with spruce and broadleaved were much smaller than pine. Absolute RMSE values were similar between pine and spruce (17.9 p.p. and 18.7 p.p., respectively). The MD value for pine was the largest (22.3%, 6.2 p.p), and the MD value for spruce was also quite large (–6.2 p.p, –13.0%), while the MD value for broadleaved trees was clearly smallest (–0.09%, 0.02 p.p.).
| Table 5. Absolute and relative root mean square error (RMSE) and mean difference (MD) values associated with tree species-specific volume proportions in the validation data using k nearest neighbor (k-NN) imputation. p.p. denotes percentage point. | ||||
| RMSE (p.p.) | RMSE (%) | MD (p.p.) | MD (%) | |
| Pine | 17.9 | 63.8 | 6.2 | 22.3 |
| Spruce | 18.7 | 39.1 | –6.2 | –13.0 |
| Broadleaved | 10.6 | 43.9 | –0.02 | –0.09 |
The RMSE and MD values associated with the prediction of volumes by species and total volume in the validation plots are presented in Table 6, and the scatterplots of observed and predicted volumes are shown in Fig. 2. The RMSE (9.0%) and MD (–0.8%) values for total volume were rather small, considering that the volume model was general and was not localized to the study area or to the UAS point cloud data. The RMSE% value for pine was the largest (62.6%) among the species-specific predictions. Spruce was predicted with a much smaller relative RMSE value (33.4%), but with a noticeably larger absolute RMSE value than pine. Broadleaved trees were predicted with the smallest absolute RMSE value, and with a surprisingly small relative RMSE value.
| Table 6. Absolute and relative root mean square error (RMSE) and mean difference (MD) values associated with volumes by tree species and total volume in the validation data. | ||||
| RMSE (m3 ha–1) | RMSE (%) | MD (m3 ha–1) | MD (%) | |
| Pine | 37.4 | 62.6 | 7.0 | 11.8 |
| Spruce | 44.8 | 33.4 | –13.4 | –10.0 |
| Broadleaved | 24.2 | 51.9 | 2.0 | 4.4 |
| Total | 21.7 | 9.0 | 3.3 | –0.8 |
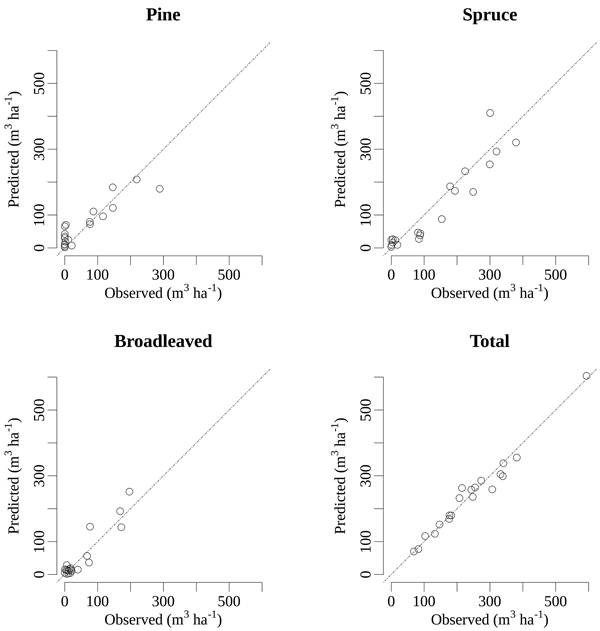
Fig. 2. Visual accuracy assessment using scatterplots of predicted and observed volumes by tree species and total volume in the validation field plots. The diagonal dashed line indicates a perfect prediction. Volumes are predicted using photogrammetric UAS data, Sentinel-2 images and prior field measurements.
The absolute prediction errors associated with tree species explained the large relative prediction error associated with pine. Even though the relative prediction error of pine was almost twice as large (62.6%) as that of spruce (33.4%), pine had a noticeably lower absolute prediction error (37.4 m3 ha–1) than spruce (44.8 m3 ha–1). This is explained by the fact that pine was absent in a large number of the field plots, which led to a low mean volume for pine. Moreover, the k-NN models also had a tendency to overestimate the volume of pine in the plots where its volume was zero (Fig 2).
5 Discussion and conclusions
UAS photogrammetry provides data at a different scale to conventional ALS data. While the latter is suitable for large-area forest management inventories (hundreds of thousands of hectares), UAS can be most cost efficient over considerably smaller areas (tens of hectares to thousands of hectares). Recently proposed approaches that apply photogrammetric UAS data in the prediction of forest inventory attributes usually require considerable fieldwork. However, in practice, fieldwork is usually too costly and time consuming to conduct in the small areas that UAS data cover. Therefore, in this study, we focused on utilizing existing publicly available data to forego new fieldwork.
The results of the satellite image feature selection are in accordance with results from other studies where boreal tree species were predicted using Sentinel-2 data. For instance, Persson et al. (2018) classified plots dominated by a single tree species in central Sweden using multi-temporal Sentinel-2 data and reported similar results regarding feature importance. Notably, they found that SWIR1, SWIR2, RE2 and RE3 were the most important predictor variables. Kukkonen et al. (2018) predicted volume by tree species in the same study area (as in this paper) using Sentinel-2 images and ALS data. They concluded that RE2 and NIRn were very useful in the prediction of tree species-specific volumes, and that SWIR2, R and RE3 were also important bands. Grabska et al. (2019) reported that the largest contribution among Sentinel-2 MSI bands to the classification of tree species in complex woodlands of the Polish Carpathian mountains was derived from the blue, red, SWIR and red-edge part of the spectrum. The importance of autumn satellite images for the discrimination of tree species has been emphasized in previous studies (Pasquarella et al. 2018; Grabska et al. 2019), and our study supports these observations, as most of the important features in the prediction of tree species proportions were from the September images.
Our results show that the use of UAS photogrammetry, previously measured FMI field plots, and spaceborne remote sensing data shows promise for small area forest inventories. The results were initially compared with the reported prediction errors associated with methods targeted at large area forest inventories. In the next paragraph, the results are compared with other studies where tree species-specific volumes were predicted using UAS data with ABA. The species-specific prediction errors (33.4–62.6%) are at a similar level to studies where the volumes of boreal tree species were predicted using either fixed-wing aircraft acquired photogrammetric data or ALS data together with aerial images or satellite images. For instance, Kukkonen et al. (2018) reported prediction errors of 49.8–69.0% using Landsat 8 and Sentinel-2 satellite images, and 52.8–63.0% using aerial images for species-specific volume predictions at the plot-level. Packalén et al. (2009) combined aerial images and low-pulse density ALS data to predict plot-level tree species-specific volumes with prediction errors of 30.2–61.7%. Bohlin et al. (2012) modeled stand-level volumes by tree species with 26.4–90.6% prediction errors using structural and spectral features.
Our findings are also similar to studies where UAS photogrammetry and aerial images was used in the prediction of volumes by tree species with ABA. For instance, Tuominen et al. (2017) predicted pine, spruce and broadleaved volumes with %RMSE values of 34.5, 57.2 and 42.0, respectively. The prediction errors associated with different tree species vary with the proportions of the tree species when ABA is applied. Pine was clearly the most dominant tree species in the field plots in Tuominen et al. (2017), whereas spruce and broadleaved trees were equally represented. In our study area, pine was less frequent than spruce, and broadleaved trees were clearly the minority tree species. Therefore, the prediction errors reported in this paper are comparable to those reported in Tuominen et al. (2017).
The large relative prediction error associated with pine (62.6%) can be explained by the fact that there were no pines present in a large portion of the validation plots. There was a clear tendency to overestimate the volume of pine in cases where the true volume was zero (Fig 2). In these plots, the k-NN models still predicted some amount of pine, due to the inherent averaging property of k-NN near the highest and lowest values of the training data. This is associated with the choice of the size of the neighborhood (k). Low k values provide smaller bias but higher variance, whereas high values of k provide a smoother and less variable fit. If pine were more commonly represented in the validation data, its relative prediction error would likely be smaller. The large %RMSE value associated with pine is further pronounced by the spectral confusion between pine and spruce. Thus, these results should be critically examined by evaluating the validation field data used in our study. In Finnish forest inventories by tree species, it is typical that broadleaved tree species exhibit the largest prediction errors, because broadleaved trees are most often the minority tree species in a stand (Kukkonen et al. 2019; Tuominen et al. 2014).
The AGL heights of the photogrammetric UAS data were computed by generating a DTM from the data itself, instead of using, for example, auxiliary LiDAR data as DTM. The reasoning behind this decision was that, although an ALS-based DTM was available, the method would also be applicable in areas where this is not the case. It has also been previously shown that DTM from photogrammetric UAS data can be used in the prediction of forest attributes (Kachamba et al. 2016). However, the construction of the DTM from photogrammetric UAS data can have adverse effects on the AGL heights of the point cloud, which should be taken into consideration. As Graham et al. (2019) corroborated in their article, while both terrain slope and a dense canopy can lead to errors in DTM, the latter is more influential. If extensive areas of ground surface are hidden underneath the canopy, the issue is twofold: (1) the search for ground points can falsely assign vegetation points as ground surface, and (2) interpolation within the DTM can be inaccurate if the distance between the ground points is too large. While these issues can (to a certain extent) be mitigated by using high resolution, low altitude data acquisition, unavoidable errors are invariably introduced when the canopy cover is vast and fully closed, and over areas where the topography varies substantially.
The construction of general species classification models based on spectrally normalized UAS data should be addressed in future research, although construction of such models is difficult due to large temporal and within-species variations in reflectance (Korpela et al. 2011). The use of consumer grade RGB cameras on many UAS may limit the accuracy of such models in species classification, as the red edge and near-infrared bands are absent (see e.g. Nezami et al. 2020).
The method described in this paper is a promising approach for tree species-specific small-area FMI. However, it is worth noting that the requirement for a variety of both field and remote sensing data can be a limiting factor. The acquisition of satellite images is, in most areas, straightforward, although clouds can cause issues in some climatic conditions. Previously measured field plots are required from an area that either encompasses the UAS inventory area or resembles the forest structure of the UAS inventory area. In essence, the method in this paper assumes that large area ALS-based FMI has been conducted in the past and that these data have been made publicly available. These requirements are fulfilled under Finnish conditions and it is possible that such data are also made public in other countries. This paper has demonstrated that publicly available field plot and ALS data can be used to facilitate small area forest inventories using consumer grade UAS systems and satellite images. As such, this paper is an example of how these data sources can be used to benefit operational practices, by advocating open data principles.
References
Agisoft PhotoScan professional version 1.3. (2017) http://www.agisoft.com/downloads/installer/. Accessed 29 June 2017.
Alonzo M, Andersen H, Morton DC, Cook BD (2018) Quantifying boreal forest structure and composition using UAV structure from motion. Forests 9, article id 119. https://doi.org/10.3390/f9030119.
Axelsson P (2000) DEM generation from laser scanner data using adaptive TIN models. Int Arch Photogramm Remote Sens Spatial Inf Sci 33: 110–117.
Bohlin J, Wallerman J, Olsson H, Fransson JES (2012) Species-specific forest variable estimation using non-parametric modeling of multi-spectral photogrammetric point cloud data. Int Arch Photogramm Remote Sens Spatial Inf Sci 39: 387–391. https://doi.org/10.5194/isprsarchives-XXXIX-B8-387-2012.
Brovkina O, Cienciala E, Surový P, Janata P (2018) Unmanned aerial vehicles (UAV) for assessment of qualitative classification of Norway spruce in temperate forest stands. Geo Spatial Inform Sci 21: 12–20. https://doi.org/10.1080/10095020.2017.1416994.
Cao L, Liu H, Fu X, Zhang Z, Shen X, Ruan H (2019) Comparison of UAV LiDAR and digital aerial photogrammetry point clouds for estimating forest structural attributes in subtropical planted forests. Forests 10, article id 145. https://doi.org/10.3390/f10020145.
Copernicus Open Access Hub (2018) https://scihub.copernicus.eu. Accessed 30 December 2018.
Eerikäinen K (2009) A multivariate linear mixed-effects model for the generalization of sample tree heights and crown ratios in the Finnish National Forest Inventory. For Sci 55: 480–493.
Franklin SE, Ahmed OS (2018) Deciduous tree species classification using object-based analysis and machine learning with unmanned aerial vehicle multispectral data. Int J Remote Sens 39: 5236–5245. https://doi.org/10.1080/01431161.2017.1363442.
Gobakken T, Korhonen L, Næsset E (2013) Laser-assisted selection of field plots for an areabased forest inventory. Silva Fenn 47, article id 943. https://doi.org/10.14214/sf.943.
Goodbody TRH, Coops NC, Tompalski P, Crawford P, Day KJK (2017) Updating residual stem volume estimates using ALS- and UAV-acquired stereo-photogrammetric point clouds. Int J Remote Sens 38: 2938–2953. https://doi.org/10.1080/01431161.2016.1219425.
Grabska E, Hostert P, Pflugmacher D, Ostapowicz K (2019) Forest stand species mapping using the Sentinel-2 time series. Remote Sens 11, article id 1197. https://doi.org/10.3390/rs11101197.
Graham A, Coops NC, Wilcox M, Plowright A (2019) Evaluation of ground surface models derived from unmanned aerial systems with digital aerial photogrammetry in a disturbed conifer forest. Remote Sens 11, article id 84. https://doi.org/10.3390/rs11010084.
Guimarães N, Pádua L, Marques P, Silva N, Peres E, Sousa JJ. (2020) Forestry remote sensing from unmanned aerial vehicles: a review focusing on the data, processing and potentialities. Remote Sens 12, article id 1046. https://doi.org/10.3390/rs12061046.
Hill RA, Wilson AK, George M, Hinsley SA (2010) Mapping tree species in temperate deciduous woodland using time-series multi-spectral data. Appl Veg Sci 13: 86–99. https://doi.org/10.1111/j.1654-109X.2009.01053.x.
Immitzer M, Vuolo F, Atzberger C (2016) First experience with Sentinel-2 data for crop and tree species classifications in central Europe. Remote Sens 8, article id 166. https://doi.org/10.3390/rs8030166.
Jayathunga S, Owari T, Tsuyuki S (2018) The use of fixed–wing UAV photogrammetry with LiDAR DTM to estimate merchantable volume and carbon stock in living biomass over a mixed conifer–broadleaf forest. Int J Appl Earth Obs Geoinf 73: 767–777. https://doi.org/10.1016/j.jag.2018.08.017.
Junttila V, Finley AO, Bradford JB, Kauranne T (2013) Strategies for minimizing sample size for use in airborne LiDAR-based forest inventory. For Ecol Manag 292: 75–85. https://doi.org/10.1016/j.foreco.2012.12.019.
Kachamba DJ, Ørka HO, Gobakken T, Eid T, Mwase W (2016) Biomass estimation using 3D data from unmanned aerial vehicle imagery in a tropical woodland. Remote Sens 8: article id 968. https://doi.org/10.3390/rs8110968.
Korpela I, Tuomola T, Välimäki E (2007) Mapping forest plots: an efficient method combining photogrammetry and field triangulation. Silva Fenn 41: 457–469. https://doi.org/10.14214/sf.283.
Korpela I, Heikkinen V, Honkavaara E, Rohrbach F, Tokola T (2011) Variation and directional anisotropy of reflectance at the crown scale – implications for tree species classification in digital aerial images. Remote Sens Environ 115: 2062–2074. https://doi.org/10.1016/j.rse.2011.04.008.
Korpela I, Mehtätalo L, Markelin L, Seppänen A, Kangas A (2014) Tree species identification in aerial image data using directional reflectance signatures. Silva Fenn 48, article id 1087. https://doi.org/10.14214/sf.1087.
Kotivuori E, Kukkonen M, Mehtätalo L, Maltamo M, Korhonen L, Packalen P. (2020) Forest inventories for small areas using drone imagery without in-situ field measurements. Remote Sens Environ 237, article id 111404. https://doi.org/10.1016/j.rse.2019.111404.
Krause S, Sanders TG, Mund J-P, Greve K (2019) UAV-based photogrammetric tree height measurement for intensive forest monitoring. Remote Sens. 11, article id 758. https://doi.org/10.3390/rs11070758.
Kukkonen M, Maltamo M, Packalen P (2017) Image matching as a data source for forest inventory – comparison of semi-global matching and next-generation automatic terrain extraction algorithms in a typical managed boreal forest environment. Int J Appl Earth Obs Geoinf 60: 11–21. https://doi.org/10.1016/j.jag.2017.03.012.
Kukkonen M, Korhonen L, Maltamo M, Suvanto A, Packalen P (2018) How much can airborne laser scanning based forest inventory by tree species benefit from auxiliary optical data? Int J Appl Earth Obs Geoinf 72: 91–98. https://doi.org/10.1016/j.jag.2018.06.017.
Laasasenaho J (1982) Taper curve and volume functions for pine, spruce and birch. Commun. Inst. For. Fenn 108: 1–74. http://urn.fi/URN:ISBN:951-40-0589-9.
Main-Knorn M, Pflug B, Louis J, Debaecker V, Müller-Wilm U, Gascon F (2017) Sen2Cor for Sentinel-2. Image and signal processing for remote sensing 23, article id 10427. Int Soc Opt Photonics. https://doi.org/10.1117/12.2278218.
Moeur M, Stage AR (1995) Most similar neighbor: an improved sampling inference procedure for natural resource planning. For Sci 41: 337–359.
Næsset E (2002) Predicting forest stand characteristics with airborne scanning laser using a practical two-stage procedure and field data. Remote Sens Environ 80: 88–99 https://doi.org/10.1016/S0034-4257(01)00290-5.
NLS (2019) Airborne LiDAR data. https://tiedostopalvelu.maanmittauslaitos.fi/tp/kartta?lang=en. Accessed 11 January 2019.
Nevalainen O, Honkavaara E, Tuominen S, Viljanen N, Hakala T, Yu X, Hyyppä J, Saari H, Pölönen I, Imai NN, Tommaselli AMG (2017) Individual tree detection and classification with UAV-based photogrammetric point clouds and hyperspectral imaging. Remote Sens 9, article id 185. https://doi.org/10.3390/rs9030185.
Nezami S, Khoramshahi E, Nevalainen O, Pölönen I, Honkavaara E (2020) Tree species classification of drone hyperspectral and RGB imagery with deep learning convolutional neural networks. Remote Sens 12, article id 1070. https://doi.org/10.3390/rs12071070.
Ota T, Ogawa M, Mizoue N, Fukumoto K, Yoshida S (2017) Forest structure estimation from a UAV-based photogrammetric point cloud in managed temperate coniferous forests. Forests 8: 343. https://doi.org/10.3390/f8090343.
Packalén P, Maltamo M (2006) Predicting the plot volume by tree species using airborne laser scanning and aerial photographs. For Sci 52: 611–622. https://doi.org/10.1093/forestscience/52.6.611.
Packalén P, Suvanto A, Maltamo M (2009) A two stage method to estimate species-specific growing stock. Photogramm Eng Remote Sensing 75: 1451–1460. https://doi.org/10.14358/PERS.75.12.1451.
Pasquarella VJ, Holden CE, Woodcock CE (2018) Improved mapping of forest type using spectral-temporal Landsat features. Remote Sens Environ 210: 193–207. https://doi.org/10.1016/j.rse.2018.02.064.
Persson M, Lindberg E, Reese H (2018) Tree species classification with multi-temporal Sentinel-2 data. Remote Sens 10, article id 1794. https://doi.org/10.3390/rs10111794.
Puletti N, Chianucci F, Castaldi C (2018) Use of Sentinel-2 for forest classification in Mediterranean environments. Ann Silvic Res 42: 32–38. https://doi.org/10.12899/ASR-1463.
Sedliak M, Sačkov I, Kulla L (2017) Classification of tree species composition using a combination of multispectral imagery and airborne laser scanning data. Cent Eur For J 63: 1–9. https://doi.org/10.1515/forj-2017-0002.
Sentinel Hub (2020) https://www.sentinel-hub.com. Accessed 28 January 2020.
SMK (2019) https://www.metsaan.fi/sites/default/files/avoin-metsatieto-tuotekuvaus.pdf. Accessed 28 January 2020.
Tuominen S, Pitkänen J, Balazs A, Korhonen KT, Hyvönen P, Muinonen E (2014) NFI plots as complementary reference data in forest inventory based on airborne laser scanning and aerial photography in Finland. Silva Fenn 48, article id 983. https://doi.org/10.14214/sf.983.
Tuominen S, Balazs A, Honkavaara E, Pölönen I, Saari H, Hakala T, Viljanen N (2017) Hyperspectral UAV-imagery and photogrammetric canopy height model in estimating forest stand variables. Silva Fenn 51, article id 7721. https://doi.org/10.14214/sf.7721.
Total of 44 references.
