Hanna Lundmark,
Lars Östlund,
Torbjörn Josefsson 
Continuity forest or second-generation forest? Historic aerial photos provide evidence of early clear-cutting in northern Sweden
Lundmark H., Östlund L., Josefsson T. (2021). Continuity forest or second-generation forest? Historic aerial photos provide evidence of early clear-cutting in northern Sweden. Silva Fennica vol. 55 no. 1 article id 10460. https://doi.org/10.14214/sf.10460
Highlights
- In the early 1900s clear-cutting had been applied to 10% of the forest land in the study area situated in Västernorrland province, northern Sweden
- By the end of the 1940s 40% of the study area had been clear-cut and constituted second-generation forest
- 50–70 years is too short of a time frame for assessing the continuity of a forest in the study area.
Abstract
Modern forestry, which mainly consists of clear-cutting, is one of the most important factors influencing today’s boreal forests. In Sweden, the breaking point for modern forestry is generally considered to be around 1950. Recently, our common knowledge of the implementation of clear-cutting in Sweden has increased, and new research indicates that clear-cutting systems were already applied before the 1950s. In this case study, we used aerial photographs from the 1940s to analyze the extent of contemporaneous clear-cuts and even-aged young forests in an area in northern Sweden. Our results show that almost 40% of the study area had already been clear-cut by the end of the 1940s, but also that clear-cutting had been applied to 10% of the forest land in the early 1900s. This implies that the historical development of forestry in northern Sweden is more complex than previously thought, and that certain proportions of the forest land were already second-generation forests in the 1950s. Our results have implications for the use of concepts such as “continuity forest”, suggesting that this concept should employ a time frame of at least 100 years.
Keywords
continuous cover forestry;
forest history;
aerial photography;
satellite image;
clear-cutting;
clear-felling
-
Lundmark,
Department of Forest Ecology and Management, Swedish University of Agricultural Sciences, S-901 83 Umeå, Sweden
 https://orcid.org/0000-0001-8402-7152
E-mail
hanna.lundmark@slu.se
https://orcid.org/0000-0001-8402-7152
E-mail
hanna.lundmark@slu.se
-
Östlund,
Department of Forest Ecology and Management, Swedish University of Agricultural Sciences, S-901 83 Umeå, Sweden
https://orcid.org/0000-0002-7902-3672
E-mail
lars.ostlund@slu.se
-
Josefsson,
Department of Forest Ecology and Management, Swedish University of Agricultural Sciences, S-901 83 Umeå, Sweden
https://orcid.org/0000-0002-8734-5778
E-mail
torbjorn.josefsson@slu.se
Received 20 October 2020 Accepted 7 February 2021 Published 22 February 2021
Views 111564
Available at https://doi.org/10.14214/sf.10460 | Download PDF

1 Introduction
As the second largest biome, boreal forests support diverse set of flora and fauna, as well as sequester a substantial proportion of the global carbon stock (Ruckstuhl et al. 2008). During the last 150 years, the boreal forests of Fennoscandia, Canada, Alaska and substantial parts of Russia have undergone dramatic transformation, including loss of forest land (Östlund et al. 1997; Nordberg et al. 2013). Although the global rate of forest loss has slowed (Anon. 2018), the remaining boreal forests are continually being transformed – mainly through different forms of land use but also as a result of climate change (Bonan 2008; Price et al. 2013).
Modern large-scale forestry in northern Europe, which mainly consists of clear-cutting, is one of the most important factors influencing forest biodiversity and carbon storage, as its implementation causes the loss of certain habitats and transforms the remaining habitats into production intensive systems (Bradshaw et al. 2009). Various biodiversity-oriented management practices, for example, creation of artificial snags, green tree retention, prescribed burning, and the creation of corridors and buffer strips, have been introduced to counteract the negative effects of clear-cutting (Larsson and Danell 2001; Kuuluvainen 2009). The influence of these activities on biodiversity has been vigorously debated, and therefore, this field has been the subject of considerable research during the last two decades (Gustafsson et al. 2010; Mori and Kitagawa 2014). Some of the practices are conceptualized as continuous cover forestry, and hence, aim to maintain substantial tree cover and heterogeneous forest structure (Seedre et al. 2018).
In Sweden, the concept of “continuity forest” (Swedish: “kontinuitetsskog”) is increasingly used in forest management and conservation (Ahlkrona et al. 2017a; Sahlin 2018), and denotes forests that have not been clear-cut previously (Dahlberg 2011). The basis for this definition stems from the idea that clear-cutting was introduced at a large-scale in Sweden in the 1950s (Dahlberg 2011). Recently, however, our common knowledge of forest history and the implementation of clear-cutting in Sweden has increased. For example, Svensson et al. (2019) showed that a significant proportion of the forest landscape was reconfigured by clear-cutting in the 1950–60s, while Lundmark et al. (2013) suggest that the use of clear-cutting systems extends even further back in time. This implies that forested sites assumed to be continuity forests may in fact have been clear-cut long before the 1950s and, hence, are currently second-generation forests. Consequently, to guide forest management aimed at continuous cover forestry and conservation efforts we need improved methodological approaches to estimate the spatial extent of clear-cuttings prior to the 1950s.
Previously, most of the research on early logging in Sweden and other European countries has been based on an approach that includes historical records such as forest management plans, forest maps and forest journals (Bürgi 1999; Lie et al. 2012; Boucher et al. 2014; Lundmark et al. 2017). Lately, remote sensing, including digitized historical aerial photographs, has enabled large-scale analyses of land use that can be used to understand landscape change and to guide forest management (Kangas et al. 2018). For example, Svensson et al. (2019) used digitized satellite images to analyze a 50–60-year period of forest fragmentation and loss within a large forest landscape in northern Sweden. Due to its high spatial resolution, aerial photography is a useful tool, and time series of photos have recently been used to study landscape dynamics (Garbarino et al. 2013; Legaard et al. 2015), vegetation changes (Rhemtulla et al. 2002), habitat loss (Ecke et al. 2013) and changes in canopy closure (Miklín and Čížek 2014). Furthermore, previous studies have shown that ownership (along with other factors such as site conditions, natural disturbances and other forms of land use) should be taken into account when studying the effects of forest management. For example, Crow et al. (1999) showed that ownership affected spatial heterogeneity in a forested landscape in Wisconsin, USA, while Bergès et al. (2013) found that ownership was an important determinant of forest understory plant composition in an area in northern France. To what extent land ownership has influenced early use of clear-cutting in northern Sweden has not been thoroughly investigated previously.
In this case study, we use a set of aerial photographs from the 1940s to analyze the extent of contemporaneous clear-cut sites and even-aged young forests (which represent clear-cutting in the early 1900s) in an area in northern Sweden containing both state-owned forest and forest owned by private companies. Thus, the main objectives were to: (1) quantify the extent of clear-cuts and even-aged young forests before 1950 within the study area, and (2) clarify whether the occurrence of clear-cuts and even-aged young forests differ between state-owned forest and private forest. We also discuss the implications of our findings for management and conservation strategies related to concepts such as continuity forest.
2 Materials and methods
2.1 Study area
The study was conducted in a region situated in the western part of Västernorrland province, which is located in the northern boreal zone of Sweden (Fig. 1). The dominant land cover in this province is coniferous forest comprising approximately 86% of the total land area (Anon. 2021). Commercial logging has been extensive in this part of Sweden, with silvicultural operations dating back to the late 1700s (Arpi 1959a; Björklund 1984; Östlund 1995). Forestry in the region was first concentrated around small sawmills along two large rivers (Ångermanälven and Indalsälven), but expanded throughout the entire province during the 1800s and early 1900s as timber floating became widespread (Östlund 2000). When the progress of the sawmill industry slowed down in the 1890s, the era of the pulp industry had already begun and was now entering a rapid expansion phase with an increase of pulp production from 100 000 tons in 1892 to 1 200 000 tons in 1915 (Rydberg 1990; Valeur 2000). The big rivers were not only suitable for floating, but also provided conditions for transporting the industries’ products to the world market. From this perspective, Ångermanälven was particularly important and this, together with accessible forests near the coast, allowed for the establishment of many pulp mills in this area. In Västernorrland province, the first grinding mill was established at Torpshammar in 1869–71, the first sulphite mills in 1898–1900 at Essvik and Utansjö, and the first sulphate mill at Frånö in 1895–96 (Valeur 2000). Initially, only private forest companies were active in the forestry sector, but in the late 1800s also forestry on the state-owned forest land was initiated by Kungliga Domänstyrelsen (later Domänverket, today Sveaskog) (Arpi 1959b).
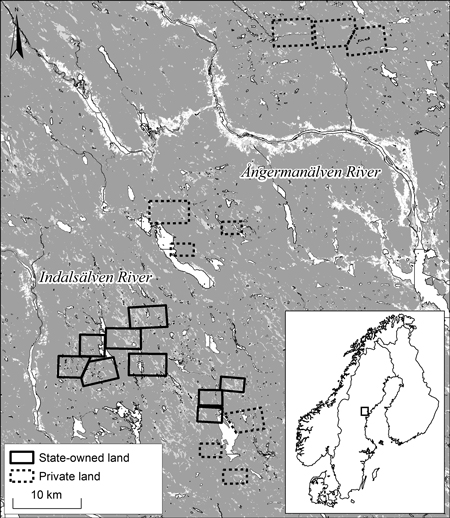
Fig. 1. Map of the study area in Västernorrland province with analyzed landscapes (based on aerial photos from the 1940s) on state-owned land and on private company land, and the distribution of forest (dark gray), open land (light grey) and water (white with black outline). Location in Fennoscandia indicated by a rectangle on the inset map.
First, we identified six subareas of approximately equal sizes (50 km2) within the study area – three situated on state-owned land and three on land owned by private forest companies. Then, we selected three landscapes from each subarea. Accordingly, a total of 9 forest landscapes on state-owned land and on private company land, respectively, were chosen for aerial photography interpretation. These landscapes varied in size from ca. 5 km2 to 27 km2, and were selected based on the following criteria: (1) access to aerial photos from the 1940s that covered the entire study area; (2) similar present configuration in terms of topography, access to waterways and presence of rural areas; and (3) similar forest conditions in terms of forest type: mixed coniferous forest (Norway spruce Picea abies (L.) H. Karst. and Scots pine Pinus sylvestris L., with a low component of deciduous trees, mostly birch Betula spp.).
2.2 Aerial photography, preparation and analysis
During the 1930s, the Swedish Mapping, Cadastral and Land Registration Authority (Swedish: Lantmäteriet) initiated aerial photography in Sweden (Anon. 2019). An important step in the initiation of aerial photography in Sweden was a 1937 decision that established a nationwide photo map. However, it was not until the 1950s that aerial photos was used in forestry (Olsson et al. 2011). The earliest available aerial photos for the study area are from 1944 and these are located at the Lantmäteriet archive in Gävle, which includes for example state and municipal cadastral archives and historical aerial photos. These photos were taken from a height ranging from 3900–4150 meters and each photo encompasses a ground area of 6 × 6 km. In this study, we included a quality control step to exclude any photos that had clear faults (damage, blur, etc.). The photos that were regarded to be of sufficient quality and selected for the study were listed in a table. A set of three aerial photos per subarea were then randomly chosen from this table. In addition, one aerial photo adjacent to each randomized photo was included to enable analysis using stereo pairs. Accordingly, a total of 36 aerial photos taken in 1944, 1945 and 1949, representing 18 stereo models (nine on private company land, and nine on state-owned land), were chosen for further analyses (Table 1). The aerial photos were scanned and georeferenced, after which they were brought from the Lantmäteriet archive to the lab for aerial photography interpretation using stereo models.
| Table 1. Unpublished sources, aerial photos from the 1940s in Västernorrland province, used for data collection. The aerial photos are stored at the archive of the Swedish mapping, cadastral and land registration authority (Swedish: Lantmäteriets arkiv). |
| Lantmäteriet [Swedish mapping, cadastral and land registration authority] |
| Flygfoto 1:20200 Y_44_31_70 1944 [Aerial photography] |
| Flygfoto 1:20200 Y_44_31_71 1944 [Aerial photography] |
| Flygfoto 1:41400 Y_44_32_75 1944 [Aerial photography] |
| Flygfoto 1:41400 Y_44_32_76 1944 [Aerial photography] |
| Flygfoto 1:41400 Y_44_34_69 1944 [Aerial photography] |
| Flygfoto 1:41400 Y_44_34_70 1944 [Aerial photography] |
| Flygfoto 1:41400 Y_44_34_73 1944 [Aerial photography] |
| Flygfoto 1:41400 Y_44_34_74 1944 [Aerial photography] |
| Flygfoto 1:41400 Y_44_34_751944 [Aerial photography] |
| Flygfoto 1:41400 Y_44_34_76 1944 [Aerial photography] |
| Flygfoto 1:41600 Y_44_36_08 1944 [Aerial photography] |
| Flygfoto 1:41600 Y_44_36_09 1944 [Aerial photography] |
| Flygfoto 1:41600 Y_44_36_17 1944 [Aerial photography] |
| Flygfoto 1:41600 Y_44_36_18 1944 [Aerial photography] |
| Flygfoto 1:41600 Y_44_36_32 1944 [Aerial photography] |
| Flygfoto 1:41600 Y_44_36_33 1944 [Aerial photography] |
| Flygfoto 1:20200 Y_44_37_12 1944 [Aerial photography] |
| Flygfoto 1:20200 Y_44_37_13 1944 [Aerial photography] |
| Flygfoto 1:20400 Y_44_45b_16 1944 [Aerial photography] |
| Flygfoto 1:20400 Y_44_45b_17 1944 [Aerial photography] |
| Flygfoto 1:20400 Y_44_47a_20 1944 [Aerial photography] |
| Flygfoto 1:20400 Y_44_47a_21 1944 [Aerial photography] |
| Flygfoto 1:19900 Y_45_25b_08 1945 [Aerial photography] |
| Flygfoto 1:19900 Y_45_25b_09 1945 [Aerial photography] |
| Flygfoto 1:19900 Y_45_41a_48 1945 [Aerial photography] |
| Flygfoto 1:19900 Y_45_41a_49 1945 [Aerial photography] |
| Flygfoto 1:19400 Y_49_141_01 1949 [Aerial photography] |
| Flygfoto 1:19400 Y_49_141_02 1949 [Aerial photography] |
| Flygfoto 1:19400 Y_49_143_04 1949 [Aerial photography] |
| Flygfoto 1:19400 Y_49_143_05 1949 [Aerial photography] |
| Flygfoto 1:19400 Y_49_145_03 1949 [Aerial photography] |
| Flygfoto 1:19400 Y_49_145_04 1949 [Aerial photography] |
| Flygfoto 1:19400 Y_49_147_02 1949 [Aerial photography] |
| Flygfoto 1:19400 Y_49_147_03 1949 [Aerial photography] |
| Flygfoto 1:19400 Y_49_147_05 1949 [Aerial photography] |
| Flygfoto 1:19400 Y_49_147_06 1949 [Aerial photography] |
The analysis of the aerial photos included the delimitation of the landscapes into compartments with different land categories, as well as measurements of mean tree height for forested areas. We identified three different land categories for clear-cuts (clear-cut with no trees, clear-cut with seed trees, and clear-cut with residual trees) and three land categories for forested land (forest 1–25 years, forest 26–50 years, forest >50 years) (Fig. 2, Table 2). The land category “forest >50” included multi-layered forests in which trees were often significantly older than 50 years. Presumably, many of these forests had been selectively logged before the 1940s. Additional land categories, including mires, outcrops, agricultural land, water, as well as houses and roads, were identified and delimited, but not further analyzed (Table 2). The classification of non-productive lands (separated from any of the clear-cut or forest categories) was guided by contemporary maps showing the extent of mires and outcrops. Mean tree height was used as a proxy for forest age (1–25 years, 26–50 years, >50 years). Accordingly, forest age was approximated by examining forest canopy structure and measuring mean tree height in at least three different places within a delimited compartment (Table 2). The program used (DAT/EM Summit Evolution) has a function that enabled us to measure mean tree heights, which was calculated as the difference between the tree top elevation, determined with the stereo model of the aerial photo, and the corresponding tree bottom elevation. Other studies have shown that tree height is correlated with tree age, particularly evident in young forests (Elfving and Kiviste 1997), and that tree height estimated from aerial photos is similar to field-estimated height (Balenović et al. 2015).
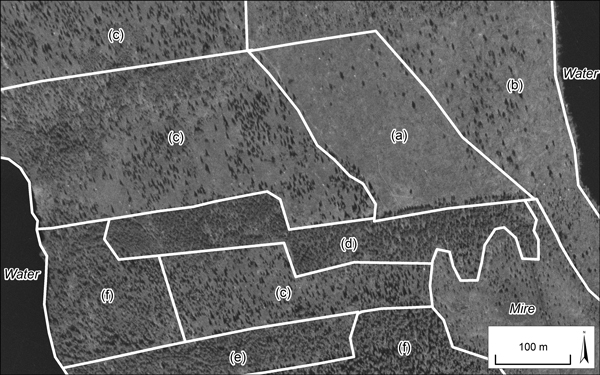
Fig. 2. Examples of each of the six land categories analyzed and identified in this study in an aerial photo from 1949: (a) clear-cut with no trees; (b) clear-cut with seed trees; (c) clear-cut with residual trees; (d) forest 1–25-years-old; (e) forest 26–50-years-old; and (f) forest >50-years-old. Aerial photography 1:19400 Y 49 141 01 1949. Source: Lantmäteriet.
| Table 2. Description of land categories used for delineation of the landscapes into compartments using aerial photos from the 1940s in the Västernorrland province. | |
| Land category | Attributes for aerial photography interpretation |
| Clear-cut with no trees | Clear-cut area > 0.5 ha, with clearly defined borders |
| Clear-cut with seed trees | Clear-cut area > 0.5 ha, with trees of the same height, evenly distributed |
| Clear-cut with residual trees | Clear-cut area > 0.5 ha, with residual trees/group of trees of different height, not evenly distributed |
| Forest 1–25-years-old | Forest with an even stand structure, tree height 0–8 m |
| Forest 26–50-years-old | Forest with an even stand structure, tree height 9–12 m |
| Forest >50-years-old | Forest with an uneven stand structure and trees of different heights (generally >12 m). Includes forest land that does not fit any other land category |
| Mire | Wetlands with or without trees, flat and low terrain, diffuse borders. Includes non-productive forest land |
| Outcrop of bedrock | Bedrock areas with trees or sparse forest, hilly and high terrain, diffuse borders. Includes non-productive forest land |
| Agricultural land | Open, treeless land areas near houses/villages, with clearly defined borders |
| Water | Lakes, rivers and creeks |
| Other | Houses, roads |
The delimitation of compartments with some type of clear-cutting, or which represented forests 1–25- and 26–50-years-old, was achieved through the interpretation of forest age and border characteristics (i.e. straight lines) (Fig. 2). Disturbances other than clear-cutting, e.g., stand-replacing fires, can create treeless areas that will later become forested land with clearly distinguished tree cohorts (Bergeron et al. 2002). However, areas with post-fire regeneration tend to be characterized by a circular or irregular shape, while areas that have been clear-cut usually have straight, long borders (Dragotescu and Kneeshaw 2012). The stands which did not have clearly defined borders were attributed to the land category “forest >50” to minimize the risk of including false clear-cuts in our analyses. Compartments situated on the edge of the analyzed aerial photos (i.e. with parts missing) were omitted from analyses of compartment size. All height measurements, assessments of forest structure and delimitations into compartments were performed in the Summit Evolution Professional program provided by DAT/EM (DAT/EM Systems International, Anchorage, AK) and ArcGIS 10.3 (ESRI, Redlands, CA).
2.3 Statistical analysis
We used analysis of variance (one-way ANOVA) to examine the significance of differences in mean size (ha) and proportion (%) of compartments for six land categories (see Table 2) between state-owned and private company land (based on nine landscapes for each land owner – see Fig. 1). All datasets were tested before analyses to ensure that the variables conformed to requirements of normality and homogeneity of variance. The statistical analyses were performed in SPSS Statistics for Windows, release 24 (IBM, Armonk, NY).
3 Results
A total of 2839 compartments of forest land (i.e. both clear-cuts and forested land), representing 17 455 ha, were identified and delineated, with 1287 (7470 ha) of these compartments on state-owned land and 1552 (9985 ha) on private company land. There was no significant difference in the mean size of compartments identified from state-owned land (5.8 ha) and private company land (6.0 ha). For both land-owner categories, most of the forest land (a little over 60%) included forests >50-years-old (Fig. 3). The remaining areas (almost 40%) consisted of either forest younger than 50 years old or clear-cuts. On state-owned land, 1–25- and 26–50-year-old forests covered 6.7% (range 2–10%) and 6.6% (range 3–14%), respectively, of the area, while on private company land these two land categories covered 8.8% (range 4–15%) and 11.6% (range 2–18%), respectively, of the area. As such, private company land showed a higher proportion of forests younger than 50 years old than state-owned land, but the difference was not significant as the proportion varied considerably between the studied landscapes.
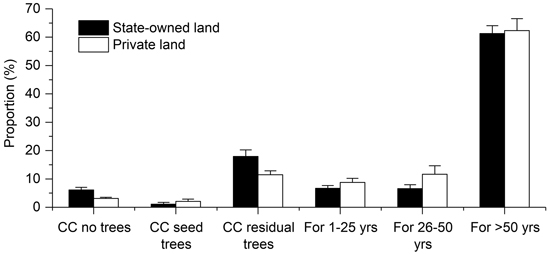
Fig. 3. Proportion of identified and analyzed land categories including clear-cuts (CC) and forests (For) for state-owned land (black bars) and private company land (open bars). Data are presented as means and standard errors.
The proportion of clear-cuts with no trees was significantly higher on state-owned land (mean 6.1%, range 3–12%) than on private company land (mean 3.1%, range 2–5%) (F1,16 = 9.043, p = 0.008, Table 3, Fig. 3). A similar trend was observed for clear-cuts with residual trees, as state-owned land had a significantly higher proportion of this land category (17.9%, range 8–32%) than private company land (11.5%, range 6–17%) (F1,16 = 5.763, p = 0.029). Both state-owned and private company land showed similar, low proportions of clear-cuts with seed trees (state-owned land: mean 1.1%, range 0–6%; private company land: mean 2.1%, range 0–7%). Clear-cut areas with seed trees were only recorded in 50% of the studied landscapes, i.e. this land category was identified from three landscapes within state-owned land and six landscapes within land owned by a private company.
| Table 3. Comparisons of proportions (%) of identified and analysed land categories on state-owned land and on private company land. Data presented as means and standard errors. Significant differences in bold. | ||||||
| Variable | State-owned land (%) | Private company land (%) | Log transformed | Degrees of freedom | F | p |
| Clear-cut with no trees | 6.1 ± 0.91 | 3.1 ± 0.41 | No | 1, 16 | 9.043 | 0.008 |
| Clear-cut with seed trees | 1.1 ± 0.65 | 2.1 ± 0.76 | No | 1, 16 | 1.036 | 0.324 |
| Clear-cut with residual trees | 17.9 ± 2.31 | 11.5 ± 1.39 | No | 1, 16 | 5.763 | 0.029 |
| Forest 1–25 years | 6.7 ± 0.98 | 8.8 ± 1.45 | No | 1, 16 | 1.451 | 0.246 |
| Forest 26–50 years | 6.6 ± 1.39 | 11.6 ± 2.98 | No | 1, 16 | 2.398 | 0.141 |
| Forest >50 years | 61.3 ± 2.79 | 62.4 ± 4.19 | No | 1, 16 | 0.047 | 0.831 |
A closer examination of how private company and state-owned land differed in terms of mean compartment sizes of different land categories revealed only minor differences. An exception was clear-cuts with no trees, as the mean size of compartments describing this land category were significantly larger on state-owned land (3.3 ha) than on private company land (1.7 ha) (F1,16 = 4.796, p = 0.044, Table 4, Fig. 4). All of the land categories generally showed large variation, i.e., relatively large standard errors, across the studied landscapes. The mean sizes of compartments representing 1–25-year old forest (state: 2.6 ha, private: 3.0 ha) and 26–50-year-old forests (state: 5.0 ha, private 5.3 ha) were similar for the two land-owners. Compartments representing older forests (>50-years-old) were somewhat larger (7.2 ha) on private company land when compared to state-owned land (5.9 ha), but this difference was not statistically significant. Clear-cuts with seed trees was the land category with the largest mean compartment size on both state-owned (6.8 ha) and private company land (9.0 ha). Although forest land owned by a private company showed a larger mean compartment size for these clear-cuts than state-owned land, this difference was not statistically significant. The average compartment sizes of clear-cuts with residual trees were similar for both land-owner categories. Furthermore, there were no significant differences between state-owned and private company land in terms of the minimum or maximum size of compartments. The minimum compartment size measured for each land category was generally less than 1 ha (Table 4). In contrast, the maximum compartment sizes of different land categories varied considerably, as indicated by high standard errors. Forests >50-years-old constituted the largest compartments (66.4 ha on state-owned land and 86.9 ha on private company land). The maximum size of other land categories varied between c. 10 and 24 ha.
| Table 4. Comparisons of minimum, maximum and mean size of compartments (ha) on identified and analysed land categories between state-owned land and on private company land. Data presented as means and standard errors. Significant differences in bold. | ||||||
| Variable | State-owned land (ha) | Private company land (ha) | Log transformed | Degrees of freedom | F | p |
| Minimum size | ||||||
| Clear-cut with no trees | 0.2 ± 0.04 | 0.2 ± 0.06 | No | 1, 16 | 0.090 | 0.768 |
| Clear-cut with seed trees | 2.8 ± 0.45 | 6.4 ± 1.64 | No | 1, 7 | 1.513 | 0.258 |
| Clear-cut with residual trees | 0.4 ± 0.18 | 0.3 ± 0.09 | No | 1, 16 | 0.527 | 0.478 |
| Forest 1–25 years | 0.2 ± 0.04 | 0.3 ± 0.06 | No | 1, 16 | 1.561 | 0.229 |
| Forest 26–50 years | 1.5 ± 0.55 | 0.9 ± 0.23 | No | 1, 16 | 1.068 | 0.317 |
| Forest >50 years | 0.3 ± 0.07 | 0.5 ± 0.21 | No | 1, 16 | 0.574 | 0.460 |
| Maximum size | ||||||
| Clear-cut with no trees | 14.2 ± 2.97 | 9.8 ± 2.24 | No | 1, 16 | 1.347 | 0.263 |
| Clear-cut with seed trees | 16.9 ± 4.40 | 11.8 ± 1.88 | No | 1, 7 | 0.732 | 0.420 |
| Clear-cut with residual trees | 21.4 ± 5.17 | 23.4 ± 4.76 | No | 1, 16 | 0.082 | 0.778 |
| Forest 1–25 years | 13.2 ± 3.32 | 15.1 ± 3.36 | No | 1, 16 | 0.170 | 0.686 |
| Forest 26–50 years | 21.9 ± 5.44 | 24.2 ± 3.83 | No | 1, 16 | 0.123 | 0.730 |
| Forest >50 years | 66.4 ± 10.28 | 86.9 ± 14.78 | No | 1, 16 | 1.297 | 0.263 |
| Mean size | ||||||
| Clear-cut with no trees | 3.3 ± 0.63 | 1.7 ± 0.28 | No | 1, 16 | 4.796 | 0.044 |
| Clear-cut with seed trees | 6.8 ± 2.01 | 9.0 ± 1.43 | No | 1, 8 | 0.445 | 0.523 |
| Clear-cut with residual trees | 4.8 ± 0.63 | 3.9 ± 0.60 | No | 1, 16 | 1.096 | 0.311 |
| Forest 1–25 years | 2.6 ± 0.46 | 3.0 ± 0.34 | No | 1, 16 | 0.485 | 0.496 |
| Forest 26–50 years | 5.0 ± 1.20 | 5.3 ± 0.73 | No | 1, 16 | 0.056 | 0.816 |
| Forest >50 years | 5.9 ± 0.82 | 7.2 ± 1.09 | No | 1, 16 | 0.870 | 0.365 |
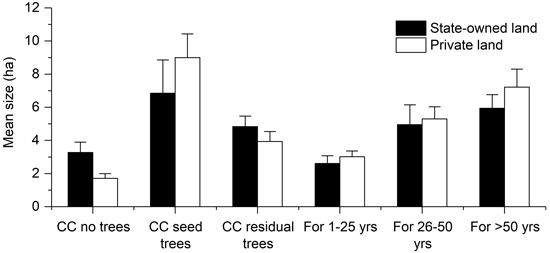
Fig. 4. Mean size (ha) of compartments representing identified and analyzed land categories including clear-cuts (CC) and forests (For) on state-owned land (black bars) and private company land (open bars). Data are presented as means and standard errors.
4 Discussion
Commercial forest use, including selective cutting of valuable tree resources, has a long history in Fennoscandia, and it was not until the mid-1900s that improved infrastructure and machinery enabled the large-scale implementation of clear-cutting systems (Fryjordet 1962; Östlund 1993). However, the extent to which clear-cutting systems were applied in northern Fennoscandia before the 1950s is largely unknown. Our interpretation of historical aerial photographs indicate that large parts of the studied forest region have been shaped by forestry, and that different forms of clear-cutting were already applied during the early 1940s. The study area is of particular interest due to early commercial forestry and the rapid establishment of industries as well as the presence of both state and private company forests, since it shows the reasons for and the direction of change in the Swedish forestry during the dramatic first part of the 20th century. The study area is not, however, representative of northern Sweden as a whole, but for regions with a similar history our results may be applicable. Similar studies, but directed towards areas with other landowner constellations and pre-requisites of previous forest history and industrial development would enhance the possibilities to understand the spatial extent of early clearcutting in Fennoscandia. Below we discuss the presented findings in terms of general forest history, the role of different forest land owners (state and private companies), and more specific concepts such as continuity forest.
4.1 Extent of clear-cuttings and even-aged young forests before 1950
The silvicultural practice of clear-cutting, which consists of stand-level logging and subsequent artificial regeneration (Noble and Dirzo 1997), has its roots in Germany, where it became common during the 1700s (Hölzl 2010). The German idea spread throughout Europe (Mather et al. 1998; Bürgi and Schuler 2003) and reached Sweden in the early 1800s, where it was first introduced in the central parts (Brynte 2002; Lundmark et al. 2017). Increased demand for wood throughout Europe during the 1800s led to further exploitation of forests in Sweden and other parts of Fennoscandia (Fryjordet 1962; Björklund 1984; Östlund et al. 1997). As a result of this trend, clear-cutting was being increasingly implemented also in other parts of Sweden at the end of the 1800s (Lundmark et al. 2013). This implementation was mainly supported by foresters who wished to replace forest land with residual trees from selective cuttings (often referred to as the “Green lie”) and establish new forests that they could manage from the start, i.e., through stand-level management including clear-cutting and sowing or planting (Nordström 1959; Farrell et al. 2000; Lundmark et al. 2017). However, this traditional view of the Fennoscandian forest situation in the early 1900s has recently been challenged by for example Lie et al. (2012), who examined past forest structure and composition in southern Norway, and concluded that productive and diverse forests with heterogeneous age, diameter distribution and tree species composition could be maintained through selective logging.
Regarding the period between the early 1900s and the 1950s, we have been lacking detailed information about how wide-spread clear-cutting was. Our results, which describe the situation in the 1940s, show that 38–39% of the forest land in the studied landscapes had been subjected to clear-cutting over several decades (Fig. 3). This proportion was in fact as high as 60–70% in some of the studied landscapes. If we consider the newly established clear-cuts, it can be noticed that they constitute c. 25% of the state-owned forest land, compared to c. 17% of forest land owned by a private company. It is worth noting that the differences between state-owned and private company land in proportions of clear-cuts with no trees and clear-cuts with residual forest were statistically significant. The dynamic regarding the proportion of older clear-cuts (even-aged forests 1–25- and 26–50-years-old) was reversed (but not statistically significant), i.e. older clear-cuts were more prevalent on private company land (c. 20%) than on state-owned land (c. 13%). Accordingly, the results indicate that clear-cutting was already well-established in the early 1900s, and that both private companies and the Swedish state were actively implementing clear-cutting – with private companies possibly the stronger proponent of this silvicultural method. These conclusions agree with the general forest history of this part of Sweden (i.e., the province of Västernorrland). The rapid expansion of the Swedish forest industry in the early 1900s was reflected by the establishment of a large number of private saw mills, as well as pulp mills, in the northern parts of the country during this time period (Holmgren 1950). It could be argued that the expansion of the pulp industry enabled the large-scale application of clear-cutting since trees of all dimensions could be used for manufacturing pulp (Holmgren 1959). However, one other question remains unanswered: if clear-cutting was already widely used during the early 1900s, why was not the proportion of clear-cuts made in the 1920s and 1930s (forest 1–25 years old) higher than clear-cuts made in the early 1900s (forest 26–50 years old) (Fig. 3)? This “halt” in the development of clear-cutting systems is most likely related to changes in the world economy during the 1920–40s (cf. Heinrich 2001). The economic crisis, which started in the USA, had a profound effect on the Swedish forest industry, and the repercussions could even be seen in forest management (Holmgren 1959). According to Lundmark et al. (2013), the large-scale application of clear-cutting system was hampered by the global recession and, as a result, selective cutting was favored in the 1930–40s mainly because clear-cutting was associated with high regeneration costs.
4.2 The implementation of clear-cutting with regards to landowner categories
In our study, we analyzed forests owned by the Swedish state and forests owned by private companies. While the state-owned forests in the study area were exploited from the late 1800s onwards, commercial forest use by private companies in the area started about 100 years earlier. Interestingly, our results show that the proportions of older clear-cuts (Fig. 3), as well as their mean and maximum size (Table 4, Fig. 4), were higher in forests own by a private company than in state-owned forests. These differences indicate that private companies applied clear-cutting noticeably earlier than state-owned companies, and were thereby the stronger proponent for this silvicultural practice. However, this theory should be looked into further since we could not show significant differences between the land-owner categories in our study. There are also other indications that private companies were early adopters of clear-cutting while state-owned companies were more inclined to apply selective cutting. As stated by Andrén (1992), several private companies active in this part of Sweden conducted field experiments with clear-cutting and regeneration by planting or sowing at the turn of the 20th century. Moreover, according to Lundberg (1893), one of the private companies included in this study, Graningeverken, had applied clear-cutting and prescribed burning since the early 1800s. Graningeverken was a forest company which combined iron-works with sawmills and pulp mills (Almquist 1909). At the time when Lundberg’s research was published, Graningeverken owned about 63 000 hectares of forest land, making it one of the largest forest landowners in the region in that period (Almquist 1909). Before the establishment of the first chemical pulp mills in the 1890s the smaller diameter trees were used mainly for charcoal (Anon. 1885; Valeur 2000).
4.3 Continuity forests or second-generation forests?
Various concepts that describe continuity of forest ecosystems have been developed and applied for their understanding, management and conservation (Rose 1974; Ohlson and Tryterud 1999; Sverdrup-Thygeson and Lindenmayer 2003; Fritz et al. 2008; Bradshaw et al. 2015). For this reason, the relationship between continuity and time and spatial scales, ecophysiology, habitat quality and fragmentation vary considerably depending on the definition, a phenomenon which makes this concept challenging to apply in practice (cf. Nordén and Appelqvist 2001, and references therein). In Sweden, the concept of “continuity forests” has recently been developed and is used in methods to identify old, ecologically valuable forests (Anon. 2004; Björk 2009; Dahlberg 2011; Ahlkrona et al. 2017a). The method uses historical aerial photographs from the 1950–60s and onwards, as well as other data, and focus on contemporaneous clear-cuts down to a size of 0.5 ha (Ahlkrona et al. 2017a). This means that the concept – in its present form – do not take into account clear-cuts made before the 1950s.
Our results show that almost 40% of the forest land within the studied area had already been managed through some form of clear-cutting by the end of the 1940s, as well as that clear-cutting had been applied on about 10% of the forest land during the initial decade of the 1900s – about 100 years ago. Hence, these forests were already second-generation forests in the 1950s. This suggests that the large-scale application of clear-cutting systems was prevalent in the Västernorrland province long before 1950, and according to our results, clear-cutting was applied to similar extents on private company and state-owned land. Interestingly, the official policy of the state-owned forest management company in the early 1900s was that selective cutting should be applied in state-owned forests (Enander 2007). However, as was shown in this study and has previously been discussed by Holmgren (1950) and Nordquist (1959), clear-cutting with subsequent regeneration was applied to state-owned forest areas during the first half of the 1900s.
Previous research has highlighted various problems with the application of the continuity forest concept. For example, the minimum size of forest patches and short time frames has been questioned when this concept is applied to coastal forests, highly productive forests, and forests in southern Sweden (Ahlkrona et al. 2017a; Ahlkrona et al. 2017b). The results of our study add important information about Swedish forestry during the early 1900s, and contribute to the general discussion and improvement of the continuity forest concept. Our results indicate that 50–70 years is too short of a time frame for assessing the continuity of a certain forest – not only in terms of the forest categories mentioned above, but also for inland forests in northern parts of Sweden and possibly other parts of Fennoscandia. Furthermore, much of the criticism directed at concepts of continuity concerns insufficient definitions of time frames and spatial dependencies, as well as inadequate explanations for the choice of specific indicator species (Ohlson et al. 1997; Nordén and Appelqvist 2001; Rolstad et al. 2002; Sverdrup-Thygeson and Lindenmayer 2003). We believe that definitions of all these factors are vital to the forest continuity concept, and that the time frame should be extended. By using the approach presented in this study, the time frame could be extended to at least 100 years for areas covered by historical aerial photographs dating to the 1940s or 1950s. This would help to better distinguish between continuity forests and second-generation forests. Potentially, this approach could be developed further by applying AI technology.
4.4 Comments on the data and chosen methodology
In our study, the forest land was divided into six different land categories: three representing forests of different age classes and three representing different forms of clear-cutting. In addition to clear-cutting, a number of other logging methods (e.g. selective cutting of trees with similar dimensions and logging of tree groups) were also applied in Sweden during the first half of the 1900s (Wahlgren 1928). Selective cutting and clear-cutting were, however, the dominant forest management methods. Unfortunately, the methodology used in this study did not allow us to discern how large of a proportion of the studied forest land had been managed by selective cutting. Nevertheless, it is likely that most of the forests older than 50 years, which covered c. 60% of the forest land, were managed through selective cutting. This theory is based on the fact that the logging industry was already well-established in this part of northern Sweden in the early 1800s.
5 Conclusions
This case study, based on the analysis of historical aerial photographs, shows that clear-cutting was applied at large scales during the first half of the 1900s in the studied area situated in the Västernorrland province in northern Sweden, i.e. before the generally accepted timeline with 1950 as the breaking point in Swedish forest management for large-scale clear-cutting. Our results demonstrate that a large portion (almost 40%) of the forests in both state-owned and private company land in the studied area had already been clear-cut by the end of the 1940s. Our results does not demonstrate significant differences between the extent of clear-cutting on private and state-owned land, but indicate that private companies may have been a stronger proponent for this silvicultural practice. Our findings also imply that the early historical development of forestry in northern Sweden is more complex than previously thought, and that a certain proportion of forest land currently categorized as continuity forest in fact constitute second-generation forest. We deduce that forest history studies that focus on specific structural elements and employ methods that can provide high-resolution data can promote a deeper understanding of how to manage and protect forests in northern Scandinavia from a multiple-use perspective.
Acknowledgements
This study was financially supported by Stiftelsen Nils och Dorthi Troëdssons Forskningsfond (Grant No. 711/11) and Stiftelsen Mauritz Carlgrens fond. Special thanks to Björn Nilsson for much appreciated support with analysis of the aerial photos. Thanks also to Thomas Holgersson and Christer Strandberg for their help with procurement and preparation of the aerial photos. Valuable help and advice about the map program ArcGIS was provided by Mats Högström and Anders Pettersson. We also wish to thank two anonymous reviewers for constructive comments. The English was corrected by Sees-Editing, UK.
Declaration of interest statement
The authors declare no conflict of interest.
Authors’ contributions
Hanna Lundmark: Developed the project (research question and design) jointly with Lars Östlund and Torbjörn Josefsson, performed the extraction, analysis and interpretation of aerial photos, and performed the writing and revision of the manuscript.
Lars Östlund: Developed the project (research questions and design) jointly with Hanna Lundmark and Torbjörn Josefsson, aided in the extraction and interpretation of aerial photos, and participated in the writing and revision of the manuscript.
Torbjörn Josefsson: Developed the project (research question and design) jointly with Hanna Lundmark and Lars Östlund, aided in the extraction, analysis and interpretation of aerial photos, and performed the writing and revision of the manuscript.
References
Ahlkrona E, Giljam C, Wennberg S (2017a) Kartering av kontinuitetsskog i boreal region. [Mapping of continuity forest in boreal region]. Metria AB, on behalf of the Swedish Environmental Protection Agency, Gävle.
Ahlkrona E, Gilljam C, Keskitalo C, Klein J, Naumov V (2017b) Precisera kartering av kontinuitetsskog i Västernorrlands län. [Specify mapping of continuity forest in the Västernorrland province]. Metria AB, on behalf of the Swedish Environmental Protection Agency, Gävle.
Almquist JA (1909) Graningeverken: historisk skildring. [Graningeverken: a historical narrative]. Tullbergs Boktryckeri, Stockholm.
Andrén T (1992) Från naturskog till kulturskog, Mo och Domsjö AB:s skogsbruk under 3/4 sekel 1900–1979. [From primary forest to artificially regenerated forest. Mo and Domsjö AB’s forestry for 3/4 of a century 1900–1979]. CEWE-förlaget, Bjästa.
Anon. (1885) 1885 års berättelse. Bil. Litt. H. Årsberättelse från Föreningen för skogskultur i Norrland för 1885. [The story of 1885 in Annual report from the Association for Artificial Regeneration in northern Sweden in 1885]. pp 13–16.
Anon. (2004) Kontinuitetsskogar: en förstudie. [Continuity forests: a pilot study]. Meddelande 2004:1, Skogsstyrelsen, Jönköping.
Anon. (2018) The sustainable development goals report 2018. United Nations, New York.
Anon. (2019) Product description: historic orthophotos. Lantmäteriet, Gävle.
Anon. (2021) Marken i Sverige. [The land in Sweden]. SCB Statistics Sweden. https://scb.se/hitta-statistik/sverige-i-siffror/miljo/marken-i-sverige/. Accessed 22 January 2021.
Arpi G (1959a) Skogens utnyttjande. [Utilization of the forest]. In: Arpi G (ed) Sveriges skogar under 100 år: en sammanfattande redogörelse över det svenska skogsbruket 1859–1959, del I. [The forests in Sweden for 100 years: a summary of Swedish forestry from 1859–1959, part I]. Domänverket, Stockholm, pp 117–237.
Arpi G (1959b) Äganderättsförhållanden. [Ownership conditions]. In: Arpi G. (ed) Sveriges skogar under 100 år: en sammanfattande redogörelse över det svenska skogsbruket 1859–1959, del I. [The forests in Sweden for 100 years: a summary of Swedish forestry from 1859–1959, part I]. Domänverket, Stockholm, pp 7–113.
Balenović I, Seletković A, Pernar R, Jazbec A (2015) Estimation of the mean tree height of forest stands by photogrammetric measurement using digital aerial images of high spatial resolution. Ann Forest Res 58: 125–143. https://doi.org/10.15287/afr.2015.300.
Bergeron Y, Leduc A, Harvey BD, Gauthier S (2002) Natural fire regime: a guide for sustainable management of the Canadian boreal forest. Silva Fenn 36: 81–95. https://doi.org/10.14214/sf.553.
Bergès L, Avon C, Verheyen K, Dupouey J-L (2013) Landownership is an unexplored determinant of forest understory plant composition in Northern France. Forest Ecol Manag 306: 281–291. https://doi.org/10.1016/j.foreco.2013.06.064.
Björk L (2009) Kartläggning och identifiering av kontinuitetsskog. [Mapping and identification of continuity forest]. Skogsstyrelsen, Jönköping, Rapport 4.
Björklund J (1984) From the Gulf of Bothnia to the White Sea: Swedish direct investments in the sawmill industry of Tsarist Russia. Scand Econ Hist Rev 1: 17–41. https://doi.org/10.1080/03585522.1984.10408021.
Bonan GB (2008) Forests and climate change: forcings, feedbacks, and the climate benefits of forests. Science 320: 1444–1449. https://doi.org/10.1126/science.1155121.
Boucher Y, Grondin P, Auger I (2014) Land use history (1840–2005) and physiography as determinants of southern boreal forests. Landscape Ecol 29: 437–450. https://doi.org/10.1007/s10980-013-9974-x.
Bradshaw CJA, Warkentin IG, Sodhi NS (2009) Urgent preservation of boreal carbon stocks and biodiversity. Trends Ecol Evol 24: 541–548. https://doi.org/10.1016/j.tree.2009.03.019.
Bradshaw RH, Jones CS, Edwards SJ, Hannon GE (2015) Forest continuity and conservation value in Western Europe. Holocene 25: 194–202. https://doi.org/10.1177/0959683614556378.
Brynte B (2002) C.L. Obbarius: en nydanare i Bergslagens skogar vid 1800-talets mitt. [C.L. Obbarius: an innovator in the forests of the Bergslagen area in the mid-1800s]. Kungl. Skogs- och Lantbruksakademien, Stockholm, Skogs- och lantbrukshistoriska meddelanden 24.
Bürgi M (1999) A case study of forest change in the Swiss lowlands. Landscape Ecol 14: 567–575. https://doi.org/10.1023/A:1008168209725.
Bürgi M, Schuler A (2003) Driving forces of forest management: an analysis of regeneration practices in the forests of the Swiss Central Plateau during the 19th and 20th century. Forest Ecol Manag 176: 173–183. https://doi.org/10.1016/S0378-1127(02)00270-0.
Crow TR, Host GE, Mladenoff DJ (1999) Ownership and ecosystem as sources of spatial heterogeneity in a forested landscape, Wisconsin, USA. Landscape Ecol 14: 449–463. https://doi.org/10.1023/A:1008084123874.
Dahlberg A (2011) Kontinuitetsskogar och hyggesfritt skogsbruk. [Continuity forests and continuous cover forestry]. Skogsstyrelsen, Jönköping, Rapport 7.
Dragotescu I, Kneeshaw D. (2012) A comparison of residual forest following fires and harvesting in boreal forests in Quebec, Canada. Silva Fenn 46: 365–376. https://doi.org/10.14214/sf.47.
Ecke F, Magnusson M, Hörnfeldt B (2013) Spatiotemporal changes in the landscape structure of forests in northern Sweden. Scand J Forest Res 28: 651–667. https://doi.org/10.1080/02827581.2013.822090.
Elfving B, Kiviste A (1997) Construction of site index equations for Pinus sylvestris L. using permanent plot data in Sweden. Forest Ecol Manag 98: 125–134. https://doi.org/10.1016/S0378-1127(97)00077-7.
Enander K-G (2007) Skogsbruk på samhällets villkor: skogsskötsel och skogspolitik under 150 år. [Forestry on societys terms: forest management and forest politics during 150 years]. Institutionen för skogen ekologi och skötsel, Sveriges lantbruksuniversitet, Umeå.
Farrell EP, Führer E, Ryan D, Andersson F, Hüttl R, Piussi P (2000) European forest ecosystems: building the future on the legacy of the past. Forest Ecol Manag 132: 5–20. https://doi.org/10.1016/S0378-1127(00)00375-3.
Fritz O, Gustafsson L, Larsson K (2008) Does forest continuity matter in conservation? A study of epiphytic lichens and bryophytes in beech forests of southern Sweden. Biol Conserv 141: 655–668. https://doi.org/10.1016/j.biocon.2007.12.006.
Fryjordet T (1962) Skogadministrasjonen i Norge gjennom tidene. Bind II. Tiden etter 1857. [The forest administration in Norway thorugh the ages. Vol. II. The time after 1857]. Landbruksdepartementet og Direktoratet for Statens Skoger, Oslo.
Garbarino M, Lingua E, Weisberg PJ, Bottero A, Meloni F, Motta R (2013) Land-use history and topographic gradients as driving factors of subalpine Larix decidua forests. Landscape Ecol 28: 805–817. https://doi.org/10.1007/s10980-012-9792-6.
Gustafsson L, Kouki J, Sverdrup-Thygeson A (2010) Tree retention as a conservation measure in clear-cut forests of northern Europe: a review of ecological consequences. Scand J Forest Res 25: 295–308. https://doi.org/10.1080/02827581.2010.497495.
Heinrich T (2001) Product diversification in the U.S. pulp and paper industry: the case of international paper, 1898–1941. Bus Hist Rev 75: 467–505. https://doi.org/10.2307/3116384.
Holmgren A (1950) Norrlandsminnen. [Memories of northern Sweden]. Stockholm.
Holmgren A (1959) Skogarna och deras vård i övre Norrland intill år 1930. [The forests and their managament in northern Sweden]. In: Arpi G (ed) Sveriges skogar under 100 år: en sammanfattande redogörelse över det svenska skogsbruket 1859–1959, del II. [The forests in Sweden for 100 years: a summary of Swedish forestry from 1859–1959, part II]. Domänverket, Stockholm, pp 399–412.
Hölzl R (2010) Historicizing sustainability: German scientific forestry in the eighteenth and nineteenth centuries. Sci Cult 19: 431–460. https://doi.org/10.1080/09505431.2010.519866.
Kangas A, Astrup R, Breidenbach J, Fridman J, Gobakken T, Korhonen KT, Maltamo M, Nilsson M, Nord-Larsen T, Næsset E, Olsson H (2018) Remote sensing and forest inventories in Nordic countries – roadmap for the future. Scand J Forest Res 33: 397–412. https://doi.org/10.1080/02827581.2017.1416666.
Kuuluvainen T (2009) Forest management and biodiversity conservation based on natural ecosystem dynamics in northern Europe: the complexity challenge. Ambio 66: 309–315. https://doi.org/10.1579/08-A-490.1.
Larsson S, Danell K (2001) Science and the management of boreal forest biodiversity. Scand J Forest Res 16: 5–9. https://doi.org/10.1080/028275801300090528.
Legaard KR, Sader SA, Simons-Legaard EM (2015) Evaluating the impact of abrupt changes in forest policy and management practices on landscape dynamics: analysis of a Landsat image time series in the Atlantic northern forest. PLoS ONE 10, article id e0130428. https://doi.org/10.1371/journal.pone.0130428.
Lie MH, Josefsson T, Storaunet KO, Ohlson M (2012) A refined view on the “Green lie’’: forest structure and composition succeeding early twentieth century selective logging in SE Norway. Scand J Forest Res 27: 270–284. https://doi.org/10.1080/02827581.2011.628950.
Lundberg H (1893) Om Graningeverkens skogar. [The forests of Graningeverken]. Årsskrift från Föreningen för skogsvård i Norrland 1893: 30–47.
Lundmark H, Josefsson T, Östlund L (2013) The history of clear-cutting in northern Sweden: driving forces and myths in boreal silviculture. Forest Ecol Manag 307: 112–122. https://doi.org/10.1016/j.foreco.2013.07.003.
Lundmark H, Josefsson T, Östlund L (2017) The introduction of modern forest management and clear-cutting in Sweden: Ridö State Forest 1832–2014. Eur J Forest Res 136: 269–285. https://doi.org/10.1007/s10342-017-1027-6.
Mather AS, Needle CL, Coull JR (1998) From resource crisis to sustainability: the forest transition in Denmark. Int J Sus Dev World 5: 182–193. https://doi.org/10.1080/13504509809469982.
Miklín J, Čížek L (2014) Erasing a European biodiversity hot-spot: open woodlands, veteran trees and mature forests succumb to forestry intensification, succession, and logging in a UNESCO Biosphere Reserve. J Nat Conserv 22: 35–41. https://doi.org/10.1016/j.jnc.2013.08.002.
Mori AS, Kitagawa R (2014) Retention forestry as a major paradigm for safeguarding forest biodiversity in productive landscapes: A global meta-analysis. Biol Conserv 175: 65–73. https://doi.org/10.1016/j.biocon.2014.04.016.
Noble IR, Dirzo R (1997) Forests as human-dominated ecosystems. Science 277: 522–525. https://doi.org/10.1126/science.277.5325.522.
Nordberg M, Angelstam P, Elbakidze M, Axelsson R (2013) From logging frontier towards sustainable forest management: experiences from boreal regions of North-West Russia and North Sweden. Scand J Forest Res 28: 797–810. https://doi.org/10.1080/02827581.2013.838993.
Nordén B, Appelqvist T (2001) Conceptual problems of Ecological Continuity and its bioindicators. Biodivers Conserv 10: 779–791. https://doi.org/10.1023/A:1016675103935.
Nordquist M (1959) Skogarna och deras vård i mellersta Sverige. [The forests and their management in central Sweden]. In: Arpi G (ed) Sveriges skogar under 100 år: en sammanfattande redogörelse över det svenska skogsbruket 1859–1959, del II. [The forests in Sweden for 100 years: a summary of Swedish forestry from 1859–1959, part II]. Domänverket, Stockholm, pp 316–360.
Nordström L (1959) Skogsskötselteorier och skogslagstiftning. [Ideas in forest management and forest legislation]. In: Arpi G (ed) Sveriges skogar under 100 år: en sammanfattande redogörelse över det svenska skogsbruket 1859–1959, del II. [The forests in Sweden for 100 years: a summary of Swedish forestry from 1859–1959, part II]. Domänverket, Stockholm, pp 241–262.
Ohlson M, Tryterud E (1999) Long-term spruce forest continuity: a challenge for a sustainable Scandinavian forestry. Forest Ecol Manag 124: 27–34. https://doi.org/10.1016/S0378-1127(99)00053-5.
Ohlson M, Söderström L, Hörnberg G, Zackrisson O, Hermansson J (1997) Habitat qualities versus long-term continuity as determinants of biodiversity in boreal old-growth swamp forests. Biol Conserv 81: 221–231. https://doi.org/10.1016/S0006-3207(97)00001-3.
Olsson H, Fransson J, Nilsson B, Nilsson M, Holmgren J (2011) Från flygbilder till laserteknik för skoglig inventering: en drygt femtioårig historia med stark förankring i Norrland. [From aerial images to laser technology for forest inventory: a more than fifty-year history with strong roots in northern Sweden]. THULE Kungliga Skytteanska Samfundets Årsbok. Kungl. Skytteanska Samfundet, Umeå, pp 63–74.
Östlund L (1993) Exploitation and structural changes in the north Swedish boreal forest 1800–1992. Department of Forest Vegetation Ecology, Swedish University of Agricultural Sciences, Umeå.
Östlund L (1995) Logging the virgin forest: northern Sweden in the early-nineteenth century. Forest Conserv Hist 39: 160–171. https://doi.org/10.2307/3983957.
Östlund L (2000) Den tidiga flottningen i ett vattendrag i mellersta Norrland. [The early floating in a watercourse in northern Sweden]. In: Törnlund E, Östlund L (eds) Flottning: vattendragen, arbetet, berättelserna. [Floating: the water courses, the work, the stories]. Nordiska museets förl., Stockholm, Skrifter om skogs- och lantbrukshistoria 14, pp 9–31.
Östlund L, Zackrisson O, Axelsson AL (1997) The history and transformation of a Scandinavian boreal forest landscape since the 19th century. Can J Forest Res 27: 1198–1206. https://doi.org/10.1139/x97-070.
Price DT, Alfaro RI, Brown KJ, Flannigan MD, Fleming RA, Hogg EH, Girardin MP, Lakusta T, Johnston M, McKenney DW, Pedlar JH, Stratton T, Sturrock RN, Thompson ID, Trofymow JA, Venier LA (2013) Anticipating the consequences of climate change for Canada’s boreal forest ecosystems. Environ Rev 21: 322–365. https://doi.org/10.1139/er-2013-0042.
Rhemtulla JM, Hall RJ, Higgs ES, Macdonald SE (2002) Eighty years of change: vegetation in the montane ecoregion of Jasper National Park, Alberta, Canada. Can J Forest Res 32: 2010–2021. https://doi.org/10.1139/x02-112.
Rolstad J, Gjerde I, Gundersen VS, Saetersdal M (2002) Use of indicator species to assess forest continuity: a critique. Conserv Biol 16: 253–257. https://doi.org/10.1046/j.1523-1739.2002.00552.x.
Rose F (1974) The epiphytes of oak. In: Morris MG, Perring FH (eds) The British oak. Its history and natural history. EW Classey, Faringdon, pp 250–273.
Ruckstuhl KE, Johnson EA, Miyanishi K (2008) Introduction. The boreal forest and global change. Philos T Roy Soc B 363: 2245–2249. https://doi.org/10.1098/rstb.2007.2196.
Rydberg S (1990) Papper i perspektiv: massa- och pappersindustri i Sverige under hundra år. [Paper in perspective: pulp and paper industry in Sweden for a hundred years]. Skogsindustrierna, Stockholm.
Sahlin M (2018) Från mångfald till enfald: en vitbok över den svenska modellen för skogsbruk. [From diversity to uniformity: a White Paper of the Swedish forestry model]. Naturskyddsföreningen, Stockholm.
Seedre M, Felton A, Lindbladh M (2018) What is the impact of continuous cover forestry compared to clearcut forestry on stand-level biodiversity in boreal and temperate forests? A systematic review protocol. Environ Evid 7, article id 28. https://doi.org/10.1186/s13750-018-0138-y.
Svensson J, Andersson J, Sandström P, Mikusiński G, Jonsson BG (2019) Landscape trajectory of natural boreal forest loss as an impediment to green infrastructure. Conserv Biol 33: 152–163. https://doi.org/10.1111/cobi.13148.
Sverdrup-Thygeson A, Lindenmayer DB (2003) Ecological continuity and assumed indicator fungi in boreal forest: the importance of the landscape matrix. Forest Ecol Manag 174: 353–363. https://doi.org/10.1016/S0378-1127(02)00043-9.
Valeur C (2000) Papper och massa i Ångermanland. Från handpappersbruk till processindustri. [Paper and pulp in Ångermanland. From handmade paper to process industry]. Skogsindustriernas historiska utskotts skriftserie, Köping.
Wahlgren A (1928) Skogsskötseln, dess historiska utvecklingsgång och nuvarande ståndpunkt. [Forest management, its historical development and current position]. In: Wahlgren A, Schotte G (eds) Sveriges skogar och huru vi utnyttja dem. Del I. [The forests in Sweden and how we use them. Part I]. Hökerbergs, Stockholm, pp 470–646.
Total of 73 references.
