Felicia Dahlgren Lidman  ,
Emma Holmström,
Tomas Lundmark,
Nils Fahlvik
,
Emma Holmström,
Tomas Lundmark,
Nils Fahlvik
Management of spontaneously regenerated mixed stands of birch and Norway spruce in Sweden
Dahlgren Lidman F., Holmström E., Lundmark T., Fahlvik N. (2021). Management of spontaneously regenerated mixed stands of birch and Norway spruce in Sweden. Silva Fennica vol. 55 no. 4 article id 10485. https://doi.org/10.14214/sf.10485
Highlights
- The absence of forest management does not always mean economic loss
- With dense spontaneous regeneration of birch and Norway spruce, the first competition release can have a high impact on future stem development
- Significantly different effects on stand volume production and diameter development of Norway spruce can be expected with different biomass harvest strategies.
Abstract
Timber production and profitability were evaluated for spontaneously-regenerated mixtures on two formerly clearcut areas. The abandoned areas developed into birch-dominated (Betula pendula Roth and Betula pubescens Ehrh.) stands with successional ingrowth of Norway spruce (Picea abies (L.) H. Karst.). An experiment with randomized treatments within blocks was established, using three management strategies and one unthinned control, resulting in variation in optimal rotation age, merchantable volume and species composition. The management strategies were evaluated based on total production (volume) by using measured growth data 42 years after clearcutting and the modelled future stand development. The long-term effects of spontaneous regeneration and management strategies were evaluated based on land expectation value (LEV) and compared with a fifth management strategy using artificial regeneration and intense thinnings. 12 years after treatment, at a stand age of 42 years, the unthinned control had produced the highest total stem volume. At interest rates of 2% or higher, the unmanaged forest was an economically viable strategy, even compared to an intensive management strategy with a preferred merchantable timber species. Interest rates clearly impacted the profitability of the different management strategies. This study shows that when spontaneous regeneration is successful and dense, the first competition release can have a high impact on the development of future crop trees and on the species mixture.
Keywords
Betula pendula;
Picea abies;
Betula pubescens;
natural regeneration;
mixed forest;
land expectation value
-
Dahlgren Lidman,
Department of Forest Ecology and Management, Swedish University of Agricultural Science, Umeå, Sweden
 https://orcid.org/0000-0002-2474-1810
E-mail
felicia.lidman@slu.se
https://orcid.org/0000-0002-2474-1810
E-mail
felicia.lidman@slu.se
-
Holmström,
Southern Swedish Forest Research Centre, Swedish University of Agricultural Science, Alnarp, Sweden
https://orcid.org/0000-0003-2025-1942
E-mail
emma.holmstrom@slu.se
-
Lundmark,
Department of Forest Ecology and Management, Swedish University of Agricultural Science, Umeå, Sweden
https://orcid.org/0000-0003-2271-3469
E-mail
tomas.lundmark@slu.se
-
Fahlvik,
The Forestry Research Institute of Sweden, Ekebo, Sweden
https://orcid.org/0000-0002-2179-7800
E-mail
nils.fahlvik@skogforsk.se
Received 24 November 2020 Accepted 14 July 2021 Published 18 August 2021
Views 124307
Available at https://doi.org/10.14214/sf.10485 | Download PDF

1 Introduction
For over a century, the forests of Fennoscandia have mostly been managed as even-aged stands, with the majority of productive forestland actively managed for wood production (Yrjölä 2002; Josefsson and Östlund 2011; Lundmark et al. 2013). Forestry has long been a cornerstone of the Swedish economy, which has resulted in laws and regulations to ensure sustainable timber production (Hagner 2005; Jansson et al. 2011). Swedish forest legislation requires reforestation measures to be applied directly after a final felling. In regenerated areas, two tree species are almost exclusively used: Norway spruce (Picea abies (L.) H. Karst.) and Scots pine (Pinus sylvestris L.). Depending on tree species, regeneration method, site conditions and region, new forest must be considered established within 5–15 years and be approved according to the Swedish Forestry Act (Skogsstyrelsen 2019a, 2019b).
When choosing among different forest management alternatives, it is common to compare net present values (NPVs), which depend on interest rates (Simonsen 2013). The dominant forest-management strategy in Sweden is even-aged management (Albrektson et al. 2012), using planting, tending and commercial thinnings (often one or two), before a final harvest using clearfelling. In the last five years, more than 80% of clearfelled area in Sweden was regenerated by planting, around 10% was naturally regenerated, with the remaining part seeded or left without active measures. More than 85% of the clearfelled area was mechanically scarified to expose bare mineral soil (Skogsstyrelsen 2019b), helping to increase survival of planted and naturally-regenerated seedlings (Karlsson and Nilsson 2005; Holmström et al. 2017). The combination of birch and Norway spruce in young stands is well studied in Swedish forestry, especially using birch as a nursing shelter over Norway spruce (Andersson 1985; Mård 1996; Bergqvist 1999; Klang and Ekö 1999; Grönlund and Eliasson 2019). Birches are pioneer species and grow best in the overstorey since they are shade intolerant (Hynynen et al. 2009). Norway spruce is a secondary species that is considered semi-shade tolerant and can survive in darker understories (Assman 1970; Andersson 1985). Despite the majority of the clearfelled area in Sweden being artificially regenerated, around 2000–4000 hectares are still unmanaged and allowed to spontaneously regenerate each year, half of which is without soil scarification (Skogsstyrelsen 2019b). Such areas in Fennoscandia without any active regeneration methods, or where planting has failed, tend to spontaneously regenerate with birch (Betula pendula Roth and Betula pubescens Ehrh.) (Holgén and Hånell 2000; Götmark et al. 2005; Karlsson et al. 2010), and sometimes also with later ingrowth of Norway spruce (Nilsson et al. 2002; Hanssen 2003). These unmanaged clearfelled areas are usually considered to regrow slowly if at all, reducing future production. However, in areas where the spontaneous regeneration is successful, the stands can develop at full density.
This study evaluates different management strategies on land without investment in regeneration, but with spontaneous regeneration of birch and Norway spruce. The first objective was to test the relative impact of competition release on total volume production over time (which is expected to be low) vs. the development of the future crop trees (which is expected to be high). A second objective was to evaluate timber production and profit over the full stand rotation for different selection management strategies starting from the first competition release in dense mixed regenerations. The management strategies were compared both with an unmanaged control and with an intensive management-simulation starting from regeneration.
2 Material and methods
2.1 Site and measurements
The experiment was established in the spring of 2007 on two sites where no active regeneration measures had been taken since final felling in 1977. Both sites are on the east central coast of Sweden and have mesic glacial till soils. Site A (long term experiment, SLU 1475) is at 62°56´N, 17°56´E with altitude 115 m and site B (long term experiment, SLU 1476) is located at 62°23´N, 17°11´E with altitude 140 m. At establishment, both sites consisted of naturally-regenerated Norway spruce (Picea abies) and birch (Betula pendula and Betula pubescens), with a minor proportion of other broadleaved tree species (mainly grey alder (Alnus incana (L.) Moench)). The stem density on each site was approximately 15 000 ha–1 of which almost 75% was birch (Table 1). Natural mortality had already begun at both sites at the time of experiment establishment and the basal area of dead trees was 0.3 m2 ha–1 (site A) and 1.2 m2 ha–1 (site B).
| Table 1. Stand characteristics at each site before biomass harvest at the start of the experiment in 2007. Numbers inside parentheses are standard deviations. QMD = quadratic mean diameter. | |||||
| Site | Species | Stem density (ha–1) | QMD (cm) | Dominant Height (m) | Basal area (m2 ha–1) |
| A | Norway spruce | 2473 (530) | 3.9 (0.6) | 7.3 (1.0) | 2.9 (0.6) |
| Birch | 11 425 (4106) | 5.2 (0.8) | 13.8 (0.7) | 22.9 (1.0) | |
| Other broadleaves | 1040 (589) | 3.7 (1.6) | - | 1.1 (0.9) | |
| B | Norway spruce | 3158 (1251) | 3.5 (1.0) | 7.5 (2.0) | 2.9 (1.4) |
| Birch | 10 642 (1023) | 5.7 (0.4) | 14.8 (0.7) | 27.1 (2.7) | |
| Other broadleaves | 1308 (1154) | 2.3 (1.4) | - | 0.8 (1.3) | |
In total, five blocks were established, two at site A and three at site B. Using a randomized block design, each block was subset into four plots: three management strategies and one unmanaged control plot (CTR). All management strategies began with a commercial thinning of small-dimension trees used as fuelwood, hereafter called ‘biomass harvest’, but the selection of retained stems varied with treatment and strategy. In each strategy the target of the stand in final felling was set and the harvest selections were made to achieve these targets with the future crop trees, aiming for 1300 stems ha–1 of Norway spruce (NS), 1200 stems ha–1 of birch (BI) and a mixture with 1300 stems ha–1 of Norway spruce and 1200 stems ha–1 of birch (MIX) (Table 2). Out of all birches remaining after the biomass harvest, over 99.9% were silver birch.
| Table 2. Stem density and quadratic mean diameter (QMD) after the establishment of the experiment in 2007. The management strategies are a non-thinned control (CTR), biomass harvest and thinning to promote pure stands of Norway spruce (Picea abies) (NS) and birch (Betula pendula) (BI) or a mixture of Norway spruce and birch (MIX). | ||||||||
| Site | Treatment | Stems ha–1 | QMD (cm) | |||||
| Spruce | Birch | Other broad-leaves | Spruce | Birch | Basal area (m2 ha–1) | Volume (m3 ha–1) | ||
| A | CTR | 2117 | 9842 | 842 | 4.0 | 5.4 | 26.9 | 134.4 |
| NS | 1208 | 0 | 0 | 4.7 | - | 2.1 | 7.1 | |
| BI | 0 | 1167 | 0 | - | 9.9 | 9.0 | 52.7 | |
| MIX | 1267 | 1200 | 0 | 4.4 | 10.4 | 12.1 | 69.4 | |
| B | CTR | 2983 | 11 300 | 1172 | 2.9 | 5.7 | 30.6 | 174.7 |
| NS | 1406 | 0 | 0 | 4.2 | - | 2.0 | 6.3 | |
| BI | 0 | 1161 | 0 | - | 10.5 | 10.0 | 64.4 | |
| MIX | 1400 | 1183 | 17 | 3.3 | 10.5 | 11.5 | 70.6 | |
The experimental plots were 20×30 m, surrounded by a 5 m buffer zone with the same management strategy as the plot. Dominant and co-dominant trees of good vitality (undamaged, well-developed and symmetric crowns) were retained during thinning, and other trees removed according to the strategies. Quality (stem straightness, branch diameter, lack of damage) and spatial distribution of the trees were considered subordinate to vitality when designating future crop trees. To compare the development of the future crop trees in thinned and unthinned stands, future crop trees of Norway spruce and birch were also selected and measured within CTR according to the same criteria as in NS, BI and MIX plots. In CTR an intended strip road was considered when selecting the reference crop trees to maintain the size of the selection pool, but no cutting was carried out. Later, the selected trees in CTR and the trees retained after the first thinning in NS, BI and MIX were all defined as crop trees.
After the applied management in spring 2007, all crop trees were permanently marked with individual numbers at breast height (1.3 m above ground). Trees were measured before treatment in Nov/Dec 2006 and in June 2007, Oct/Nov 2010, Aug/Sept 2012, March 2016 and May 2019. Diameter at breast height (DBH; 1.3 m above ground), species and damage were recorded for all trees. Tree height and height to the base of the living crown were measured on randomly selected sample trees. The number of sample trees per plot varied between 16–51 for Norway spruce and 11–44 for birch. In spring 2016 a second thinning was conducted but only in the two management strategies with birch crop trees, reducing the birch density in the MIX and BI strategies to 400 and 700 stems per hectare respectively, following birch thinning guidelines (Raulo 1987; Rytter et al. 2014). The database used for taxonomic nomenclature in this paper is Missouri Botanical garden (Missouri Botanical Garden 2021).
2.2 Calculations
DBH was used to calculate basal area (m2) and the relationship of diameter and height for sample trees was used to estimate the height of all trees whose height was not measured, using species-specific height functions (Eq. 1), where x = 2 for Norway spruce and x = 3 for birch (Näslund 1947). The a and b parameters were calculated separately for each plot, revision and tree species.

The stem volumes of all trees were calculated using the measured diameter and the calculated estimated heights using species-specific volume functions for northern Sweden from Andersson (1954) for trees with DBH < 5 cm and Brandel (1990) for larger trees. However, non-crop trees in the control, whose stems were not all initially numbered, were not included in this calculation. The volume of dead trees in the control was instead estimated by multiplying the decrease in stem number between two measurements (Fig. 1) by the median volume of a measured tree in the control at that time. Total stand volume production (m3 ha–1) was summarized as the standing volume, the accumulation of harvested volumes and the estimated volume of dead wood.
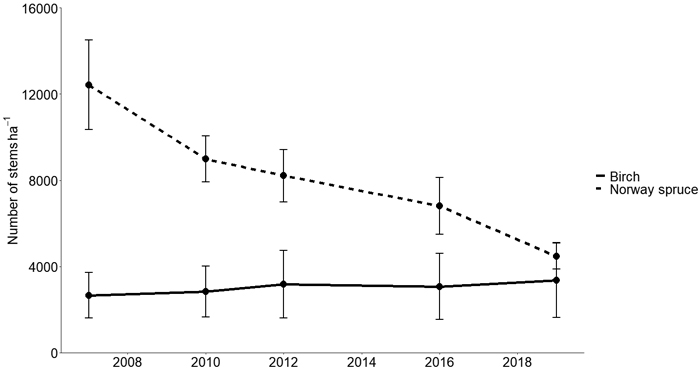
Fig. 1. Average stem density of birch and Norway spruce (Picea abies) (stems hectare–1) in unmanaged control (CTR) plots. Error bars show standard deviations.
Mean stem diameter (cm) in the treatment plots was estimated both for the stand mean, defined as the quadratic mean diameter (QMD) and the mean diameter of the 300 dominating trees (DBHdom), corresponding to the 300 largest stems per hectare from when the crop trees first where numbered. Living crown ratio was calculated as the proportion of tree crown length in relation to the tree height for all sample trees.
2.3 Statistical analysis of observed growth
The effect of competition release was tested for total volume production, DBHdom and crown length using a linear model (Eq. 2).
![]()
, where Y19 is either volume production (m3 ha–1), DBHdom (cm) or crown length (m) in 2019 per plot, the fixed factor strategy is the thinning strategy for the plot and site is one of the two sites A and B. Included in the equation was also a covariate Y0 which was the initial estimate of standing volume (m3 ha–1), QMD (cm) or average tree height (m) for each plot, measured directly after the biomass harvest. Block was also tested as a fixed factor in the linear models and was excluded after comparisons of AIC, adjusted R2 and normality of residuals, since it did not have a significant effect and did not strengthen the model.
Tukey’s tests were used, to test for significant differences between management strategies on total volume production, DBHdom for Norway spruce and crown length for birch. All statistical tests were performed in R 3.6.1 (R Core Team 2019). The packages lmerTest (Kuznetsova et al. 2017) and TukeyC (Faria et al. 2019) were used to statistically evaluate differences between means, at significance level p = 0.05. Residuals of the linear models showed no indication of violating the assumptions of normality or constant variance.
2.4 Simulations and economic analysis of management alternatives
2.4.1. Forecasting stand development
Future stand development and management of the experimental plots after 2019 were simulated in the Heureka forestry decision support system (Wikström et al. 2011) to evaluate the management strategies over a full rotation. Inputs to Heureka included site data (e.g., latitude, site index, and vegetation type), stand characteristics (age, management history) and individual tree data (species, diameter, and height). The observed values from the first measurement of all individually-measured trees were used as inputs and the observations from the following years were used to calibrate the development in the Heureka models. Heureka simulates stand development using empirical models (Elfving 2010; Fahlvik et al. 2014) and calculates basal area development with a combination of stand-wise and tree-wise growth models. The stand-wise models determine the growth rate whereas the tree-wise models are used to distribute stand-wise growth of single trees (e.g., Fahlvik et al. (2014)). The Heureka system also includes models for estimation of mortality and ingrowth. Stand development in Heureka is estimated in 5 year periods. Treatment-specific thinnings in Heureka, were simulated based on decisions regarding the timing of thinning, the proportion of basal area removed, thinning form (size of removed trees in relation to the remaining stand) and the distribution of the removal among spruce, pine and broadleaves. Heureka also includes functions for bucking of commercial wood assortments.
2.4.2. Costs of forest operations
Time expended for pre-commercial thinning (PCT) and understorey cleaning prior to biomass harvest was based on time studies of motor-manual PCT (Bergstrand et al. 1986; SLA Norr 1991). The cost for motor-manual PCT was 33 € h–1. Understory cleaning prior to felling in CTR was assumed to cost 189 € h–1.
Felling costs were calculated from productivity norms of biomass harvest (selective tree-based multi-tree handling – TMFFSel), (Sängstuvall et al. 2012), thinning (Brunberg 1997) and final felling (Brunberg 2007). Forwarding costs were based on productivity norms of biomass harvest (Sängstuvall 2010) and forwarding of round wood (Brunberg 2004). The forwarder and harvester costs were 75 and 75 € h–1 at biofuel thinning, 66 and 94 € h–1 at thinning and 75 and 104 € h–1 at final felling, respectively.
The planting cost was 472 € ha–1 and the cost per sapling was 0.24 €. The cost for soil preparation was 214 € ha–1.
2.4.3. Assortments and prices
The price list for spruce timber included two quality classes with maximum prices of 59 and 40 € m–3 for class 1 and 2 timber, respectively. The minimum top diameter of spruce timber logs was 14 cm and the pricing varied with the dimension of the logs. In all simulations, 87% of timber logs were assigned to class 1 and 13% to class 2. The pricing of birch timber was uncertain due to a limited market in Sweden. To handle the uncertainty, separate calculations were made for birch timber prices of 42 € m–3 (BirchLow) and 53 € m–3 (BirchHigh), respectively. The minimum top diameter of birch timber logs was 14 cm.
The price of pulpwood was 25 and 29 € m–3 for spruce and birch, respectively. The minimum top diameter of pulpwood was 5 cm. The market for biofuel in Sweden is uncertain as well, so we made separate calculations for biofuel prices of 14 € Mg–1 (BioLow) and 42 € Mg–1 (BioHigh) dry weight, respectively.
2.4.4. Management strategies
The strategies in the economic evaluation were the same as the four management strategies in the experiment. Inputs to the Heureka system were diameters and heights of both numbered and unnumbered trees in 2019 together with necessary site and stand data. A fifth strategy reflecting an intense management with planted Norway spruce (PL) and subsequent thinnings was also simulated as a reference. Simulations were carried out from the time of the last measurement until final felling according to the management strategies:
- CTR: Stand development was simulated with no further management actions, except for an understory cleaning right before the final felling.
- BI: Stand development was simulated with no further management actions.
- NS: Two thinnings were simulated 20 and 40 years after the start of the simulation.
- MIX: One additional thinning of both spruce and birch was simulated 15 years after the start of the simulation.
- PL: Reference reflecting traditional management of a planted monoculture of spruce. Stand development from regeneration to final felling was simulated in Heureka. The stand was planted in year 1 with 2000 spruce plants ha–1. PCT to remove naturally-regenerated trees was carried out in year 15. The stand was thinned in years 40, 55 and 70.
Different rotation lengths were simulated and the rotation that maximized Land Expectation Value (LEV) according to Eq. 3 was selected for each management strategy and interest rates. The minimum stand age at final felling was restricted to 65 years for all strategies to prevent harvest of too weakly dimensioned forests and to consider the Swedish forestry act (Skogsstyrelsen 2019a). All simulated thinnings were carried out from below, removing trees in all diameter classes but more frequently from the smaller diameter classes, since we want to retain the larger, most vital stems. Thinning from below is the common practice in Sweden (Wallentin 2007) and has previously been shown to have a positive effect on net stem volume production of Norway spruce (Nilsson et al. 2010). Management strategies were based on guidelines for birch and Norway spruce in Sweden (Skogsstyrelsen 1985; Raulo 1987). Values from the experimental plots were used as site parameters in the simulations of PL.
2.4.5. Economic calculations
Costs and income from the biomass harvest in 2007 in the BI, NS and MIX treatments assumed that all trees < 5 cm DBH were motor-manually cleaned before thinning. The extracted biomass was assumed to include stems and living branches of thinned trees with DBH > 5 cm. The biomass of thinned trees was calculated with functions from (Marklund 1988).
The timber assortments, costs and income of simulated thinnings and final felling were calculated within the Heureka system. Also, the assortments and income from thinning of birch in 2016 were calculated within the Heureka system and costs of machinery were calculated using the same set of time consumption functions as in Heureka.
The reference year in the calculations of net present value was the year of final felling of the previous stand (t = 0in Eq. 3) for all management alternatives. LEV was calculated according to Eq. 3, where R is the net amount in euro of cleaning, biomass harvest, thinning or final felling; c is the net present value of regeneration costs; t is time since last final felling (yr); u is rotation length (yr) and r is the interest rate. Regeneration cost was only relevant for PL.

LEV was calculated for four different interest rates: 1, 2, 3 and 4%.
3 Results
3.1 Observed mid-rotation growth and yield
The competition release had a significant negative effect on total stem volume production until the last measurement 2019 at a stand age of 42 years (Table 3, Fig. 2). The total stem volume production was significantly higher in the unmanaged control (CTR) ( 315 ± 15 m3 ha–1; this and all subsequent error intervals are standard deviations) compared to the management strategies targeting different future crop trees: mixed (MIX) (269 ± 7 m3 ha–1 ), birch (BI) (239 ± 11 m3 ha–1) and Norway spruce (NS) (222 ± 10 m3 ha–1) . These values only differed significantly between MIX and NS (Table 4).
| Table 3. Analysis of variance (type II Wald χ2 test) for total volume production, diameter at breast height for the 300 largest stems ha–1 (DBHdom) by tree species (Picea abies and Betula pendula) and living crown ratio for birch (Betula pendula). QMD = quadratic mean diameter. | |||||
| Response variable | Tree species | Variable | F-value | df | P-value |
| Volume | Strategy | 21.762 | 3 | 1.546e–05 | |
| Initial volume 2006 | 5.083 | 1 | 0.04 | ||
| Site | 3.486 | 1 | 0.083 | ||
| DBHdom | Norway spruce | Strategy | 29.623 | 2 | 6.281e–05 |
| Norway spruce | Initial QMD 2006 | 2.168 | 1 | 0.172 | |
| Norway spruce | Site | 3.227 | 1 | 0.103 | |
| DBHdom | Birch | Strategy | 1.062 | 2 | 0.38 |
| Birch | Initial QMD 2006 | 1.2 | 1 | 0.3 | |
| Birch | Site | 3.74 | 1 | 0.08 | |
| Living crown length | Birch | Strategy | 27.768 | 3 | 4.005e–08 |
| Birch | Tree height | 4.968 | 1 | 0.035 | |
| Birch | Site | 28.351 | 1 | 1.613e–05 | |
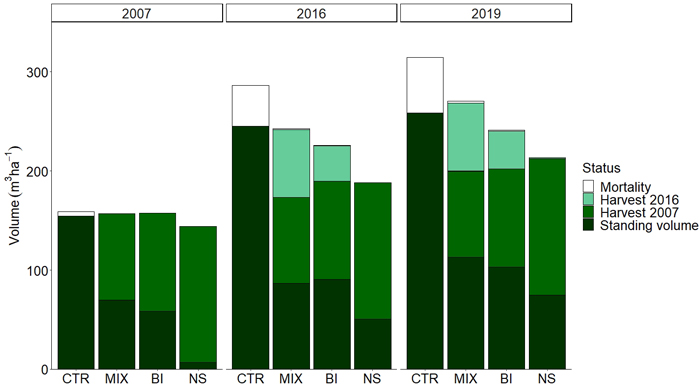
Fig. 2. Total standing stem volume (m3 ha–1), biomass harvest in 2007, birch (Betula pendula) thinning harvest in 2016, and mortality between 2007 and 2019. The management strategies are a non-thinned control (CTR), biomass harvest and thinning to promote pure stands of Norway spruce (Picea abies) (NS), birch (BI) or a mixture of Norway spruce and birch (MIX).
| Table 4. Volume production in each strategy and control, diameter at breast height for the 300 largest stems ha–1 (DBHdom) for Norway spruce (Picea abies) and crown length for birch (Betula pendula) in 2019. Letters in the final column indicate significant differences among strategies using Tukey t-test (within response variables) at p = 0.05. | ||||
| Response variable | Tree species | Strategy | Average total stem volume production (m3 ha–1), average DBHdom (cm), average crown length (m) | Significance |
| Volume | CTR | 315 | a | |
| MIX | 269 | b | ||
| BI | 239 | b | ||
| NS | 222 | c | ||
| DBHdom | Norway spruce | CTR | 9.8 | a |
| Norway spruce | MIX | 12.6 | b | |
| Norway spruce | NS | 16.9 | c | |
| Living crown length | Birch | CTR | 6.08 | a |
| Birch | MIX | 8.45 | b | |
| Birch | BI | 8.65 | b | |
On the other hand, the competition release had a significant positive effect on the development of the future Norway spruce crop trees. DBHdom for Norway spruce differed significantly between the three strategies (NS, MIX and CTR) (Tables 3 and 4) and the variation among blocks was largest in CTR (Table 5, Fig. 3) in 2019. For birch there was no significant difference in DBHdom among the three management strategies BI, MIX and CTR at the latest measurement in 2019 (Fig. 3, Table 3) with an overall mean of 18.1 cm. (Table 5). However, the length of living crown for birch was significantly longer after competition release than in CTR in 2019 (Table 4), so was not the case at the first measurement of crown length in 2010. The living crown ratio of birch was 44 ± 5%, 46 ± 6% and 50 ± 7% for BI, MIX and CTR at the first measurement in 2010.
| Table 5. Average stem diameter at breast height for the 300 largest stems ha–1 (DBHdom), quadratic mean diameter (QMD), total stem volume production and basal area for all stems, and average living crown ratio for the sample trees of birch (Betula pendula) and Norway spruce (Picea abies) in the different management strategies at the latest measurement in 2019. Numbers inside parentheses are standard deviations. The management strategies were a non-thinned control (CTR), biomass harvest and thinning to promote pure stands of Norway spruce (NS), birch (BI) or a mixture of Norway spruce and birch (MIX). | ||||||
| Birch | Norway spruce | |||||
| BI | MIX | CTR | NS | MIX | CTR | |
| DBHdom (cm) | 18.7 (0.7) | 18.1 (0.8) | 17.4 (0.9) | 16.9 (2) | 12.6 (1.5) | 9.8 (0.6) |
| QMD (cm) | 16.1 (0.7) | 17.4 (0.6) | 9.5 (0.7) | 12.4 (1.5) | 9.2 (1) | 5.6 (1.2) |
| Total stem volume production (m3 ha–1) | 239 (11) | 139 (20) | 257 (93) | 222 (10) | 39 (10) | 33 (8) |
| Basal area (m2 ha–1) | 14.4 (0.4) | 9.4 (0.8) | 31.4 (2) | 15.3 (1.8) | 8.8 (1.3) | 8.1 (1.4) |
| Living crown ratio (%) | 57 (5) | 53 (5) | 42 (3) | 90 (1) | 89 (2) | 79 (1) |
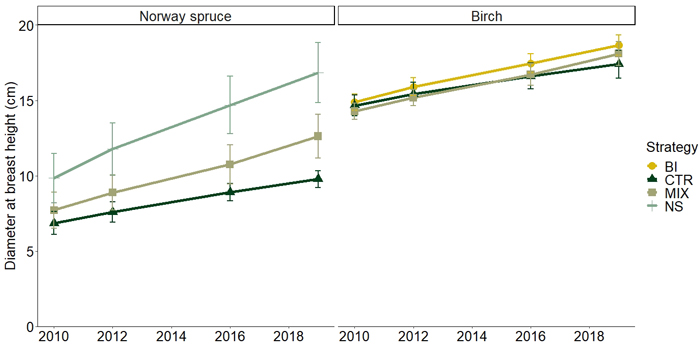
Fig. 3. Average diameter at breast height (cm) for the initially largest crop trees (DBHdom) of Norway spruce (Picea abies) and birch (Betula pendula) (300 stems hectare–1) between 2010 and 2019 for the different management strategies. The management strategies are a non-thinned control (CTR), and biomass harvest and thinning to promote pure stands of Norway spruce (NS), birch (BI) or a mixture of Norway spruce and birch (MIX). Error bars show standard deviations.
The quadratic mean diameter was 16.1, 13.3 and 12.4 cm for the BI, MIX and NS respectively and 6.5 cm for CTR (see Table 5 for species-specific QMD). Diameter distribution show the layering of Norway spruce and birch in MIX and CTR, with birch in the overstory and Norway spruce in the understory (Fig. 4). Birch mortality was highest in CTR. Between 2007 and 2019 an average of 610 stems were lost per hectare and year (Figs. 1 and 2) and the proportion of birch stems declined from 82% to 57% due to high mortality of birch and ingrowth of Norway spruce.
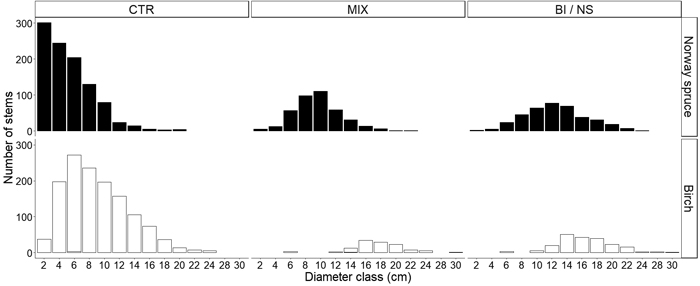
Fig. 4. Diameter distribution for Norway spruce (Picea abies) and birch (Betula pendula) in the different management strategies at the latest measurement in 2019. The management strategies included a non-thinned control (CTR), and biomass harvest and thinning to promote pure stands of Norway spruce (NS), birch (BI) or a mixture of Norway spruce and birch (MIX).
3.2 Full rotation simulations of yield and economy
The simulated production over a full rotation, based on measured initial data, demonstrated that competition release through the different management strategies had a long-term effect on assortments and amounts of extractable wood. The management strategy MIX with future crop trees of both birch and Norway spruce, resulted in the greatest total extraction of biomass (biofuel, pulpwood and timber combined) during a rotation period. The highest MAI (mean annual increment) was found in CTR, followed by PL, MIX, NS and BI. In CTR, MIX and BI the greatest share of the total removal of round wood was pulpwood, while in NS and PL the greatest share was timber (Table 6).
| Table 6. Simulated results of average annual stem volume production (MAI, m3 ha–1 yr–1), net revenue (€ ha–1 yr–1) and harvested assortments: Bio = Biomass (ton DW ha–1 yr–1); Pulp = pulpwood (m3 ha–1 yr–1); Tim = timber (m3 ha–1 yr–1) for sites A and B. R = rotation length (yr). Mortality before the first measurement of CTR, BI, NS and MIX in 2007 was unknown and was not included in MAI. Biofuel prices were BioLow = 14 € and BioHigh = 42 € Mg–1 DW and for birch timber BirchLow = 42 € and BirchHigh = 57 € m–3. The management strategies were a non-thinned control (CTR), biomass harvest and thinning to promote pure stands of Norway spruce (Picea abies) (NS), birch (Betula pendula) (BI) or a mixture of Norway spruce and birch (MIX) and a simulated reference of planted Norway spruce with conventional thinning for roundwood production (PL). | |||||||||||||
| Strategy | Interest rate (%) | BioLow_BirchLow | Assortment | BioHigh_BirchHigh | Assortment | ||||||||
| R | MAI | Net | Bio | Pulp | Tim | R | MAI | Net | Bio | Pulp | Tim | ||
| CTR | 1 | 65 | 8.9 | 1029 | 0.0 | 4.4 | 0.9 | 65 | 8.9 | 1029 | 0.0 | 4.4 | 0.9 |
| BI | 65 | 5.6 | 505 | 0.8 | 2.7 | 0.6 | 70 | 5.6 | 770 | 0.7 | 2.8 | 0.6 | |
| MIX | 97 | 7.3 | 1078 | 0.4 | 3.3 | 1.8 | 105 | 7.3 | 1257 | 0.4 | 3.2 | 1.9 | |
| NS | 107 | 6.9 | 1200 | 0.7 | 1.1 | 3.1 | 110 | 6.9 | 1430 | 0.7 | 1.1 | 3.1 | |
| PL | 93 | 8.3 | 1806 | 0.0 | 2.2 | 4.1 | 93 | 8.3 | 1806 | 0.0 | 2.2 | 4.1 | |
| CTR | 2 | 65 | 8.9 | 1029 | 0.0 | 4.4 | 0.9 | 65 | 8.9 | 1029 | 0.0 | 4.4 | 0.9 |
| BI | 65 | 5.6 | 505 | 0.8 | 2.7 | 0.6 | 65 | 5.6 | 748 | 0.8 | 2.7 | 0.6 | |
| MIX | 85 | 7.3 | 948 | 0.5 | 3.5 | 1.5 | 87 | 7.3 | 1136 | 0.5 | 3.5 | 1.6 | |
| NS | 95 | 6.9 | 1065 | 0.8 | 1.2 | 2.9 | 97 | 6.9 | 1340 | 0.8 | 1.2 | 3.0 | |
| PL | 85 | 8.2 | 1729 | 0.0 | 2.4 | 4.0 | 85 | 8.2 | 1729 | 0.0 | 2.4 | 4.0 | |
| CTR | 3 | 65 | 8.9 | 1029 | 0.0 | 4.4 | 0.9 | 65 | 8.9 | 1029 | 0.0 | 4.4 | 0.9 |
| BI | 65 | 5.6 | 505 | 0.8 | 2.7 | 0.6 | 65 | 5.6 | 748 | 0.8 | 2.7 | 0.6 | |
| MIX | 75 | 7.2 | 799 | 0.6 | 3.6 | 1.2 | 80 | 7.2 | 1053 | 0.5 | 3.6 | 1.4 | |
| NS | 95 | 6.9 | 1065 | 0.8 | 1.2 | 2.9 | 95 | 6.9 | 1312 | 0.8 | 1.2 | 2.9 | |
| PL | 75 | 7.9 | 1509 | 0.0 | 2.5 | 3.7 | 75 | 7.9 | 1509 | 0.0 | 2.5 | 3.7 | |
| CTR | 4 | 65 | 8.9 | 1029 | 0.0 | 4.4 | 0.9 | 65 | 8.9 | 1029 | 0.0 | 4.4 | 0.9 |
| BI | 65 | 5.6 | 505 | 0.8 | 2.7 | 0.6 | 65 | 5.6 | 748 | 0.8 | 2.7 | 0.6 | |
| MIX | 75 | 7.2 | 799 | 0.6 | 3.6 | 1.2 | 75 | 7.2 | 983 | 0.6 | 3.6 | 1.2 | |
| NS | 95 | 6.9 | 1065 | 0.8 | 1.2 | 2.9 | 95 | 6.9 | 1312 | 0.8 | 1.2 | 2.9 | |
| PL | 70 | 7.7 | 1367 | 0.0 | 2.6 | 3.5 | 70 | 7.7 | 1367 | 0.0 | 2.6 | 3.7 | |
Ranking the different management strategies by land expectation value (LEV) gave different results depending on the interest rate. The influence of different biofuel and birch timber prices on strategy rankings were however minor (Fig. 5, Table 6). PL had the greatest mean LEV at an interest rate of 2% or less. CTR produced the greatest LEV at interest rates of 3% or more when the biofuel price was low, when the biofuel price was high NS had the greatest LEV. BI had the lowest LEV for all scenarios up to a 2% interest rate, while above a 2% interest rate the price of biofuel and birch timber determined if it was BI or PL that had the lowest LEV. The negative LEV of BI, NS and PL at high interest rates was caused by negative net revenue from the biofuel thinning in scenarios with low biofuel prices. CTR had the most stable LEV across the different scenarios. The differences among the five strategies were consequently smallest when pricing for biofuel and birch timber was more competitive with Norway spruce timber prices and under low interest rates.
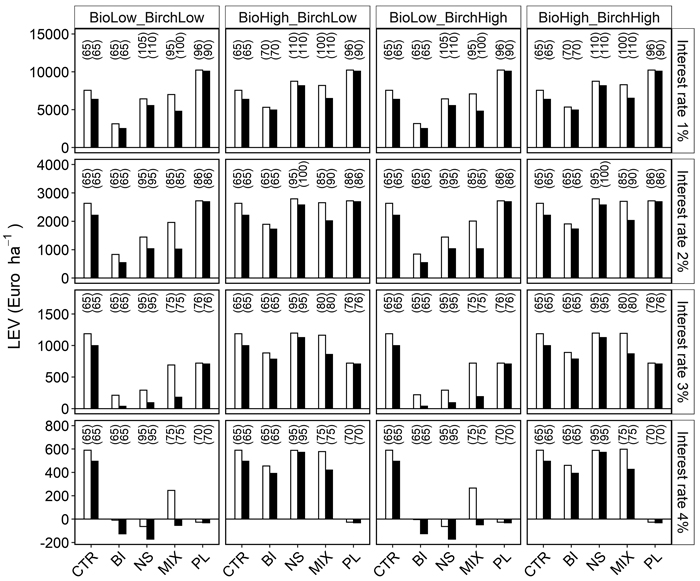
Fig. 5. Simulated land expectation value (LEV) for five management alternatives (x-axis), under four commodity price scenarios (names at the top of the figure) and interest rates between 1 and 4%. Bars show calculated LEV at sites A (unfilled) and B (filled). Biofuel prices were BioLow = 14 € and BioHigh = 42 € Mg–1 DW and birch timber prices BirchLow = 42 € and BirchHigh = 57 € m–3. The management strategies were a non-thinned control (CTR), biomass harvest and thinning to promote pure stands of Norway spruce (Picea abies) (NS), birch (Betula pendula) (BI), a mixture of Norway spruce and birch (MIX) and a simulated reference of planted Norway spruce with conventional thinning for roundwood production (PL). Age at final felling within parentheses.
4 Discussion
4.1 Observed growth
Assuming the spontaneous regeneration is successful and dense, the first competition release can have a big impact on future stem development and on the species mixture. For Norway spruce, which was initially suppressed, the competition release had a significant positive effect (Figs. 2 and 3, Table 3).
Previous studies show similar patterns of dense and unthinned stands producing higher total stand volume compared to sparser and thinned stands (Simard et al. 2004; Niemistö 2013; Pretzsch 2020). However, one can argue that these are only mid-rotation values and the stands’ future total volume may be more or less affected by mortality rates.
Competition release in the different strategies had a significant positive effect on DBHdom of Norway spruce in 2019 (Table 3). The NS strategy had the largest DBHdom followed by the MIX and CTR (Table 4), indicating reduced growth of Norway spruce due to competition from the higher stem density in the MIX and CTR strategies. This is in line with the results from previous studies (Mäkinen and Isomäki 2004; Juodvalkis et al. 2005), where the diameter of Norway spruce increased with increasingly intense thinning. The large variation in standard deviation of DBHdom for Norway spruce between the different management strategies and the control (Fig. 3) might be explained by the difference in stem density and patchiness, as seen in different standard deviations of stem density, between sites A and B at the establishment of the trial (Table 1). However, competition release in the different management strategies did not have a significant effect on DBHdom of birch (Fig. 3). It is possible that an earlier competition release could have yielded a faster diameter development that could have resulted in the strategies having an effect on DBHdom for birch. Rytter and Werner (2007) found that deciduous pioneer tree species in southern Sweden start to develop diameter differences before the stand is 10 years old. This could mean that the competition between the birches in the first 30 years of this study restricted growth to the extent that the competition release following biomass harvest didn’t make any difference. Later results from the Rytter and Werner (2007) trial also support this interpretation by indicating that early rotation diameter loss can’t be compensated for later in the rotation period (Rytter 2013). In addition, the birches had a more similar standard deviation of DBHdom between strategies and the control than Norway spruce (Fig. 3). This could further imply that the competition release for the birches came too late, and that they had already self-thinned in the overstorey.
Further, the competition release through the management strategies had a significant positive effect on crown length (Tables 3 and 4), with BI having the longest crown followed by MIX and CTR in 2019 (Table 5). Crown length is an important indicator in silviculture of birch, and it should be at least 50% of the tree length to ensure vigorous growth (Niemistö 1991). The significant positive effect of competition release through the different strategies suggest that there perhaps in the future will be a significant difference in diameter growth of DBHdom for birch between strategies.
4.2 Economy & simulations
At interest rates of 2% or higher (Fig. 5), the unmanaged forest (CTR) was an economically viable strategy, even compared to intensive management with a preferred merchantable timber species (PL). At higher interest rates, high initial costs and long rotations of intensive management are more difficult to overcome, even with more lucrative timber assortments and higher yields. The intensive management strategy with artificial planting was only a better economic choice at a low interest rate (1%) (Fig. 5). Artificial regeneration using planting with soil scarification requires a larger investment, but ensures more predictable survival and stand development, and also offers the opportunity to use improved plant material (Nilsson et al. 2002; Simonsen 2013; Sikstrom et al. 2020).
Biofuel prices affects the LEV (Fig. 5). This and the timber assortment differences between strategies (Table 6) imply that the profitability of different strategies can depend on local conditions, since the prices for roundwood varies across the country (Skogsstyrelsen 2021). Age is an important parameter in the growth model and is negatively correlated to growth at a given basal area or tree size. This correlation is logical in single-storied and even-age stands. However, understory spruce in NS might respond to a release cutting in relation to tree size rather than to the age (Ferlin 2002). Production in NS might be underestimated if released Norway spruce growth depends more on tree size than age. This needs to be evaluated as additional data about the stand development becomes available in the future.
4.3 Adaptability
Although artificial regeneration practices in boreal forest, with soil scarification and planting of conifers, have proven highly efficient (Örlander et al. 1998; Hjelm et al. 2019) and profitable (Sikström et al. 2018), there is a need for management practices in areas where mixed forests spontaneously regenerate (Coll et al. 2018; Löf et al. 2018). Spontaneous regeneration is an opportunity for the forest owner to combine production and biodiversity on the same clearcut by leaving different tree species during pre-commercial thinning to create a mixed-species stand (Felton et al. 2016; Holmström et al. 2016). An expected positive effect of mixing birch into a spruce stand is an increase in bird biodiversity (Jansson and Andrén 2003; Felton et al. 2011; Lindbladh et al. 2017). Replacing a monoculture with a mixed-species stand can also be a type of risk spreading (Yachi and Loreau 1999); by combining species with different functional traits the chance that at least some maintain their long-term function increases (Morin et al. 2014). A mixed-species stand also increases forest owners’ management alternatives when climate change causes difficult-to-predict disturbances (Millar et al. 2007).
The type of forest management evaluated in this study – spontaneous or natural regeneration, without active cultivation in combination with or without biomass harvest at a later stage – is a viable management strategy for both profit and volume production as long as the spontaneous regeneration is vigorous. However, the dense spontaneous regeneration that occurred at these sites is no guarantee at another site with similar traits. Multiple variables needs to be aligned for a dense and vigorous regeneration to occur (Karlsson et al. 2010; Holmström et al. 2016; Holmström et al. 2017; Tiebel et al. 2020) . The different management strategies show very clearly that it is possible to create different types of stands to meet various objectives through strategic biomass harvest. This type of strategy could be a solution for regenerating sites where planted seedling survival is expected to be low. Factors reducing planted coniferous seedling survival include wet soils (Holmström et al. 2019) and incomplete soil scarification due to factors like rocky soils (Berg 1986; Sundblad 2009; Luoranen et al. 2011). Today there are several digital tools available for locating sections of a clearcut unsuitable for planting conifers before going out to the field. Soil wetness maps and digital elevation models (Murphy et al. 2011; Ågren et al. 2014; Lidberg et al. 2020) are two examples. The biggest challenge of using spontaneous regeneration without active cultivation is predicting the success of regeneration on a specific site (Holmström et al. 2017). With further development of predictive models for spontaneous regeneration, less intensive cultivation can be an option, in combination with the low-investment management strategy to promote economic profitability, biomass production and birch mixtures. Ultimately, the naturally-regenerated mixed forest of birch and Norway spruce is a possible alternative when it comes to meeting the Swedish FSC standards’ (FSC 2020) recommendation of aiming for 10% deciduous trees in all stands across Sweden.
Declaration of openness of research materials, data and code
The data that supports the findings of this study is available at www.silvaboreal.com.
Authors’ contributions
TL and NF designed and established the experiment. NF conducted the simulations and economic analysis, FDL conducted the growth, yield and statistical analysis. All authors contributed to the writing of the manuscript.
Acknowledgments
We thank the field technicians at Svartberget Field Research Station, SLU, for continuously measuring the experiment.
Funding
Bergvik Skog AB, The Swedish forest agency and the Swedish University of Agricultural sciences funded the establishment of the field trial upon which this study is based.
References
Ågren AM, Lidberg W, Strömgren M, Ogilvie J, Arp PA (2014) Evaluating digital terrain indices for soil wetness mapping – a Swedish case study. Hydrol Earth Syst Sci 18: 3623–3634. https://doi.org/10.5194/hess-18-3623-2014.
Albrektson A, Elfving B, Lundqvist L, Valinger E (2012) Skogsskötselns grunder och samband. [The forest managment series: basics of forest managment]. Skogsskötselserien 1, Skogsstyrelsen, Jönköping.
Andersson S-O (1954) Funktioner och tabeller för kubering av småträd. [Functions and tables for estimation of volume of small trees]. Medd St Skogsforskningsinst 44: 1–12.
Andersson S-O (1985) Treatment of young mixed stands with birch and conifers (Betula pubescens, Betula pendula, Betula verrucosa, precommercial thinning, shelterwood). In: Hägglund B, Peterson G (eds) Broadleaves in boreal silviculture – an obstacle or an asset? Report 14, Department of Silviculture, Swedish University of Agricultural Science, pp 127–161.
Assman E (1970). The principles of forest yield: studies in the organic production structure increments and yield of forest stands. Elsevier Science, pp. 346–369. ISBN 9781483150932.
Berg S (1986) Terrängtypschema för skogsarbetare. [Terrain classification for forestry work]. Forsningsstiftelsen Skogsarbeten, Stockholm.
Bergqvist G (1999) Wood volume yield and stand structure in Norway spruce understorey depending on birch shelterwood density. Forest Ecol Manag 122: 221–229. http://dx.doi.org/10.1016/S0378-1127(99)00008-0.
Bergstrand K-G, Lindman J, Petré E (1986) Underlag för prestationsmål för motormanuell röjning. [Basic data for productivity targets in motor-manual cleaning]. Skogsarbeten redogörelse 7, Spånga, Sweden.
Brandel G (1990) Volymfunktioner för enskilda träd: tall, gran och björk. [Volume functions for individual trees; Scots pine (Pinus sylvestris), Norway spruce (Picea abies) and birch (Betula pendula & Betula pubescens)]. Rapport 26, Sveriges lantbruksuniversitet, Garpenberg.
Brunberg T (1997) Underlag för produktionsnorm för engreppsskördare i gallring. [Basic data for productivity norms for single-grip harvesters in thinning]. Redogörelse 8, Skogforsk, Uppsala, Sweden.
Brunberg T (2004) Underlag till produktionsnorm för skotare. [Productivity-norm data for forwarders]. Redogörelse 3, Skogforsk, Uppsala, Sweden.
Brunberg T (2007) Underlag för produktionsnormer för extra stora engreppsskördare i slutavverkning. [Basic data for productivity norms for extra large single-grip harvesters in final felling]. Redogörelse 2, SkogForsk, Uppsala, Sweden.
Coll L, Ameztegui A, Collet C, Löf M, Mason B, Pach M, Verheyen K, Abrudan I, Barbati A, Barreiro S, Bielak K, Bravo-Oviedo A, Ferrari B, Govedar Z, Kulhavy J, Lazdina D, Metslaid M, Mohren F, Pereira M, Peric S, Rasztovits E, Short I, Spathelf P, Sterba H, Stojanovic D, Valsta L, Zlatanov T, Ponette Q (2018) Knowledge gaps about mixed forests: What do European forest managers want to know and what answers can science provide? Forest Ecol Manag 407: 106–115. https://doi.org/10.1016/j.foreco.2017.10.055.
Elfving B (2010) Growth modelling in the Heureka system. Department of Forest Ecoclogy and Management, Swedish University of Agricultural Sciences, Umeå, Sweden.
Fahlvik N, Elfving B, Wikström P (2014) Evaluation of growth functions used in the Swedish Forest Planning System Heureka. Silva Fenn 48, article id 1013. https://doi.org/10.14214/sf.1013.
Faria JC, Jelihovschi EG, Allaman IB (2019) Conventional Tukey test. UESC, Ilheus, Brasil.
Felton A, Andersson E, Ventorp D, Lindbladh M (2011) A comparison of avian diversity in spruce monocultures and spruce-birch polycultures in southern Sweden. Silva Fennica 45: 1143–1150. https://doi.org/10.14214/sf.92.
Felton A, Nilsson U, Sonesson J, Felton AM, Roberge J-M, Ranius T, Ahlström M, Bergh J, Björkman C, Boberg J, Drössler L, Fahlvik N, Gong P, Holmström E, Keskitalo ECH, Klapwijk MJ, Laudon H, Lundmark T, Niklasson M, Nordin A, Pettersson M, Stenlid J, Sténs A, Wallertz K (2016). Replacing monocultures with mixed-species stands: ecosystem service implications of two production forest alternatives in Sweden. Ambio 45: 124–139. https://doi.org/10.1007/s13280-015-0749-2.
Ferlin F (2002) The growth potential of understorey silver fir and Norway spruce for uneven‐aged forest management in Slovenia. Forestry 75: 375–383. https://doi.org/10.1093/forestry/75.4.375.
FSC (2020) The FSC national forest stewardship standard of Sweden FSC-STD-SWE-03-2019 EN. Forest Stewardship Council.
Götmark F, Fridman J, Kempe G, Norden B (2005) Broadleaved tree species in conifer-dominated forestry: regeneration and limitation of saplings in southern Sweden. Forest Ecol Manag 214: 142–157. https://doi.org/10.1016/j.foreco.2005.04.001.
Grönlund Ö, Eliasson L (2019) Birch shelterwood removal – harvester and forwarder time consumption, damage to understory spruce and net revenues. J For Eng 30: 26–34. https://doi.org/10.1080/14942119.2019.1595943.
Hagner S (2005) Skog i förändring: vägen mot ett rationellt och hållbart skogsbruk i Norrland ca. 1940–1990. [Forest in transformation: the way towards rational and sustainable forestry in northern Sweden, around 1940–1990.]. Skogs- och Lantbrukshistoriska neddelanden 34, Kungl. Skogs- och Lantbruksakademien. ISBN 9l-89379-99-3.
Hanssen KH (2003) Natural regeneration of Picea abies on small clear-cuts in SE Norway. Forest Ecol Manag 180: 199–213. https://doi.org/10.1016/S0378-1127(02)00610-2.
Hjelm K, Nilsson U, Johansson U, Nordin P (2019) Effects of mechanical site preparation and slash removal on long-term productivity of conifer plantations in Sweden. Can J For Res 49: 1311–1319. https://doi.org/10.1139/cjfr-2019-0081.
Holgén P, Hånell B (2000) Performance of planted and naturally regenerated seedlings in Picea abies-dominated shelterwood stands and clearcuts in Sweden. Forest Ecol Manag 127: 129–138. https://doi.org/10.1016/S0378-1127(99)00125-5.
Holmström E, Ekö PM, Hjelm K, Karlsson M, Nilsson U (2016) Natural regeneration on planted clearcuts – the easy way to mixed forest? Open J For 6: 281–294. httpS://doi.org/10.4236/ojf.2016.64023.
Holmström E, Karlsson M, Nilsson U (2017) Modeling birch seed supply and seedling establishment during forest regeneration. Ecol Modell 352: 31–39. https://doi.org/10.1016/j.ecolmodel.2017.02.027.
Holmström E, Gålnander H, Petersson M (2019) Within-site variation in seedling survival in Norway spruce plantations. Forests 10, article id 181. https://doi.org/10.3390/f10020181.
Hynynen J, Niemistö P, Viherä-Aarnio A, Brunner A, Hein S, Velling P (2009) Silviculture of birch (Betula pendula Roth and Betula pubescens Ehrh.) in northern Europe. Forestry 83: 103–119. https://doi.org/10.1093/forestry/cpp035.
Jansson G, Andrén H (2003) Habitat composition and bird diversity in managed boreal forests. Scand J Forest Res 18: 225–236. https://doi.org/10.1080/02827581.2003.9728293.
Jansson U, Wastenson L, Aspenberg P, Tanner R (2011) National atlas of Sweden. Agriculture and forestry in Sweden since 1900: a cartographic description. Norstedts förlag, Stockholm, pp 114–186. ISBN 978-91-87760-61-7.
Josefsson T, Östlund L (2011) Increased production and depletion: the impact of forestry on northern Sweden’s forest landscape. In: Antonson H, Jansson U (eds) Agriculture and forestry in Sweden since 1900 – geographical and historical studies. Skogs-och lantbrukshistoriska Meddelanden, The Royal Academy of Agriculture and Forestry, Sweden, pp 338–353.
Juodvalkis A, Kairiukstis L, Vasiliauskas R (2005) Effects of thinning on growth of six tree species in north-temperate forests of Lithuania. Eur J For Res 124: 187–192. https://doi.org/10.1007/s10342-005-0070-x.
Karlsson M, Nilsson U (2005) The effects of scarification and shelterwood treatments on naturally regenerated seedlings in southern Sweden. Forest Ecol Manag 205: 183–197. https://doi.org/10.1016/j.foreco.2004.10.046.
Karlsson M, Nilsson U, Örlander G (2010) Natural regeneration in clear-cuts: effects of scarification, slash removal and clear-cut age. Scand J Forest Res 17: 131–138. https://doi.org/10.1080/028275802753626773.
Klang F, Ekö P-M (1999) Tree properties and yield of Picea abies planted in shelterwoods. Scand J Forest Res 14: 262–269. https://doi.org/10.1080/02827589950152782.
Kuznetsova A, Brockhoff P, Christensen RHB (2017) lmerTest package: tests in linear mixed effects models. J Stat Softw 82: 1–26. https://doi.org/10.18637/jss.v082.i13.
Lidberg W, Nilsson M, Ågren A (2020) Using machine learning to generate high-resolution wet area maps for planning forest management: a study in a boreal forest landscape. Ambio 49: 475–486. https://doi.org/10.1007/s13280-019-01196-9.
Lindbladh M, Lindström Å, Hedwall P-O, Felton A (2017) Avian diversity in Norway spruce production forests – how variation in structure and composition reveals pathways for improving habitat quality. Forest Ecol Manag 397: 48–56. https://doi.org/10.1016/j.foreco.2017.04.029.
Löf M, Ammer C, Coll L, Drössler L, Huth F, Madsen P, Wagner S (2018) Regeneration patterns in mixed-species stands. In: Bravo-Oviedo A, Pretzsch H, del Río M (eds) Dynamics, silviculture and management of mixed forests. Managing Forest Ecosyst 31, Springer, Cham, pp 103–130. https://doi.org/10.1007/978-3-319-91953-9_4.
Lundmark H, Josefsson T, Östlund L (2013) The history of clear-cutting in northern Sweden – driving forces and myths in boreal silviculture. Forest Ecol Manag 307: 112–122. https://doi.org/10.1016/j.foreco.2013.07.003.
Luoranen J, Rikala R, Smolander H (2011) Machine planting of Norway spruce by Bracke and Ecoplanter: an evaluation of soil preparation, planting method and seedling performance. Silva Fenn 45: 341–357. https://doi.org/10.14214/sf.107.
Mäkinen H, Isomäki A (2004) Thinning intensity and growth of Norway spruce stands in Finland. Forestry 77: 349–364. https://doi.org/10.1093/forestry/77.4.349.
Mård H (1996) The influence of a birch shelter (Betula spp) on the growth of young stands of Picea abies. Scand J Forest Res 11: 343–350. https://doi.org/10.1080/02827589609382945.
Marklund LG (1988) Biomassafunktioner för tall, gran och björk i Sverige. [Biomass functions for Scots pine, Norway spruce and birch in Sweden]. Rapport 45, Sveriges Lantbruksuniversitet.
Millar CI, Stephenson NL, Stephens SL (2007) Climate change and forests of the future: managing in the face of uncertainty. Ecol Appl 17: 2145–2151. https://doi.org/10.1890/06-1715.1.
Missouri Botanical Garden (2021) https://tropicos.org. Accessed 11 August 2021.
Morin X, Fahse L, de Mazancourt C, Scherer‐Lorenzen M, Bugmann H (2014) Temporal stability in forest productivity increases with tree diversity due to asynchrony in species dynamics. Ecol Lett 17: 1526–1535. https://doi.org/10.1111/ele.12357.
Murphy PN, Ogilvie J, Meng F-R, White B, Bhatti JS, Arp PA (2011) Modelling and mapping topographic variations in forest soils at high resolution: a case study. Ecol Model 222: 2314–2332. https://doi.org/10.1016/j.ecolmodel.2011.01.003.
Näslund M (1947) Funktioner och tabeller för kubering av stående träd, tall, gran och björk i södra sverige samt i hela landet. [Empirical formulae and tables for determining the volume of standing trees: Scots pine, Norway spruce and birch in southern Sweden and in the whole of the country]. Meddelanden från Statens Skogsforskningsinstitut 36. http://urn.kb.se/resolve?urn=urn:nbn:se:slu:epsilon-e-1110.
Niemistö P (1991) Growing density and thinning models for Betula pubescens stands on peatlands in northern Finland. Folia For 782. http://urn.fi/URN:ISBN:951-40-1185-6.
Niemistö P (2013) Effect of growing density on biomass and stem volume growth of downy birch stands on peatland in Western and Northern Finland. Silva Fenn 47, article id 1002. https://doi.org/10.14214/sf.1002.
Nilsson U, Gemmel P, Johansson U, Karlsson M, Welander T (2002) Natural regeneration of Norway spruce, Scots pine and birch under Norway spruce shelterwoods of varying densities on a mesic-dry site in southern Sweden. Forest Ecol Manag 161: 133–145. https://doi.org/10.1016/S0378-1127(01)00497-2.
Nilsson U, Agestam E, Ekö P-M, Elfving B, Fahlvik N, Johansson U, Karlsson K, Lundmark T, Wallentin C (2010) Thinning of Scots pine and Norway spruce monocultures in Sweden – effects of different thinning programmes on stand level gross- and net stem volume production. Studia Forestalia Suecia 219. ISBN 978-91-86197-76-6.
Örlander G, Hallsby G, Gemmel P, Wilhelmsson C (1998) Inverting improves establishment of Pinus contorta and Picea abies – 10‐year results from a site preparation trial in Northern Sweden. Scand J Forest Res 13: 160–168. https://doi.org/10.1080/02827589809382972.
Pretzsch H (2020) Density and growth of forest stands revisited. Effect of the temporal scale of observation, site quality, and thinning. Forest Ecol Manag 460, article id 117879. https://doi.org/10.1016/j.foreco.2020.117879.
Raulo J (1987) Björkboken. [The birch book]. Skogsstyrelsen, Jönköping. ISBN 91-85748-61-7.
Rytter L (2013) Growth dynamics of hardwood stands during the precommercial thinning phase – recovery of retained stems after competition release. Forest Ecol Manag 302: 264–272. https://doi.org/10.1016/j.foreco.2013.03.034.
Rytter L, Werner M (2007) Influence of early thinning in broadleaved stands on development of remaining stems. Scand J Forest Res 22: 198–210. https://doi.org/10.1080/02827580701233494.
Rytter L, Karlsson A, Karlsson M, Stener L-G (2014) Skötsel av björk, al och asp. [The forest managment series: managment of birch, alder and aspen.]. Skogsskötselserien nr 9, Skogsstyrelsen.
Sängstuvall L (2010) Modelling productivity of novel machine systems – application on forest fuel extraction and long-term forest scenario analyses. Report from Norwegian Forest and Landscape Institute 12, Ås, Norway.
Sängstuvall L, Bergström D, Lämås T, Nordfjell T (2012) Simulation of harvester productivity in selective and boom-corridor thinning of young forests. Scand J Forest Res 27: 56–73. https://doi.org/10.1080/02827581.2011.628335.
Sikström U, Gålnander H, Hjelm K, Hajek J, Friberg G, Sundblad L-G (2018) Strategier, kunskapsunderlag för utveckling av Beståndsanläggningskedjan. [Strategies, knowledge for development of the stand establishment chain], Arbetsrapport 970, Skogforsk, Uppsala, Sweden.
Sikstrom U, Hjelm K, Hanssen KH, Saksa T, Wallertz K (2020) Influence of mechanical site preparation on regeneration success of planted conifers in clearcuts in Fennoscandia – a review. Silva Fenn 54, article id 10172. https://doi.org/10.14214/sf.10172.
Simard SW, Blenner-Hassett T, Cameron IR (2004) Pre-commercial thinning effects on growth, yield and mortality in even-aged paper birch stands in British Columbia. Forest Ecol Manag 190: 163–178. https://doi.org/10.1016/j.foreco.2003.09.010.
Simonsen R (2013) Optimal regeneration method–planting vs. natural regeneration of Scots pine in northern Sweden. Silva Fenn 47, article id 928. https://doi.org/10.14214/sf.928.
Skogsstyrelsen (1985) Gallringsmallar – Norra Sverige. [Thinning guidelines – Northern Sweden]. Skogsstyrelsen, Jönköping, Sweden.
Skogsstyrelsen (2019a) Skogsvårdslagstiftningen. [The swedish Forestry Act]. Skogsstyrelsen, Jönköping, Sweden.
Statistikdatabas (2019b) Skogsstyrelsen. https://www.skogsstyrelsen.se/en/statistics/statistical-database/. Accessed 27 August 2021.
Skogsstyrelsen (2021) Rundvirkespriser 2020. [Prices on roundwood in 2020]. Statistiska meddelanden från skogsstyrelsen JO0303 SM 2101.
SLA Norr (1991) Prognosunderlag – motormanuell röjning och förrensning. [Forcast data – manual pre-commercial thinning]. Centraltryckeriet Skellefteå, Sweden.
Sundblad L-G (2009) Grävmaskinburet aggregat klarar både inversmarkberedning och högläggning. [Excavator unit for soil scarification can handle both mounding and inversion of soil patches]. Resultat från Skogforsk 11, Uppsala, Sweden.
Tiebel K, Huth F, Frischbier N, Wagner S (2020) Restrictions on natural regeneration of storm-felled spruce sites by silver birch (Betula pendula Roth) through limitations in fructification and seed dispersal. Eur J For Res 139: 731–745. https://doi.org/10.1007/s10342-020-01281-9.
Wallentin C (2007) Thinning of Norway spruce. Acta Universitatis Agriculturae Sueciae 29. http://urn.kb.se/resolve?urn=urn:nbn:se:slu:epsilon-1535.
Wikström P, Edenius L, Elfving B, Eriksson LO, Lämås T, Sonesson J, Öhman K, Wallerman J, Waller C, Klintebäck F (2011) The Heureka forestry decision support system: an overview. Math Comput For Nat-Res Sci 3: 87–95.
Yachi S, Loreau M (1999) Biodiversity and ecosystem productivity in a fluctuating environment: the insurance hypothesis. Proc Natl Acad Sci 96: 1463–1468. https://doi.org/10.1073/pnas.96.4.1463.
Yrjölä T (2002) Forest management guidelines and practices in Finland, Sweden and Norway. Internal report 2, European Forest Institute, Joensuu, Finland.
Total of 78 references.
