Karin Kolis  ,
Juhana Hiironen,
Esa Ärölä,
Arvo Vitikainen
,
Juhana Hiironen,
Esa Ärölä,
Arvo Vitikainen
Effects of sale-specific factors on stumpage prices in Finland
Kolis K., Hiironen J., Ärölä E., Vitikainen A. (2014). Effects of sale-specific factors on stumpage prices in Finland. Silva Fennica vol. 48 no. 3 article id 1054. https://doi.org/10.14214/sf.1054
Highlights
- Data on 4824 individual sales were used to estimate which factors affect stumpage prices
- The time of sale, seasonal harvest restrictions, the location and the assortment affected prices
- Larger total volumes and shorter forest haulage distances raised unit prices
- A higher percentage of the assortment and percentage of sawlogs within the sale corresponded to higher prices.
Abstract
Buyers of standing timber take not only the market situation but also the harvest costs into consideration when making purchase offers. In Finland, 85% of all timber is sold as standing timber, but there is little information for forest owners and third parties regarding how differences in harvest costs are reflected in the stumpage prices. This article analyses the relationship between sale-specific factors and stumpage prices in Finland. Data on 4824 standing timber sales between 2008 and 2012 were gathered from five local Forest Management Associations. Regression analyses were run on the stumpage prices (euros m–3) paid for sawlogs and pulpwood. Seasonal harvest restrictions, the volume of the sale and the timber assortment influenced stumpage prices, as did the presence of forest damages. Prices also differed over time and between locations. Furthermore, the forest haulage distance was statistically significant for pulpwood. The results suggest that the size of the individual sales and the composition of assortments affect the income owners earn from their forest. The results can be used to estimate stumpage prices and the monetary impacts on forest owners of procedures such as forest road network planning and land consolidation, as well as for valuation of forests.
Keywords
pulpwood;
timber trade;
standing timber sales;
hedonic price;
sawlogs;
non-industrial forest owners
-
Kolis,
Aalto University, Department of Real Estate, Planning and Geoinformatics, P.O. Box 12200, FI-00076 Aalto, Finland
E-mail
karin.kolis@aalto.fi
- Hiironen, Aalto University, Department of Real Estate, Planning and Geoinformatics, P.O. Box 12200, FI-00076 Aalto, Finland E-mail juhana.hiironen@aalto.fi
- Ärölä, National Land Survey of Finland, Production Support Services, P.O. Box 84, FI-00521 Helsinki, Finland E-mail esa.arola@nls.fi
- Vitikainen, Aalto University, Department of Real Estate, Planning and Geoinformatics, P.O. Box 12200, FI-00076 Aalto, Finland E-mail arvo.vitikainen@aalto.fi
Received 22 November 2013 Accepted 19 August 2014 Published 17 September 2014
Views 135042
Available at https://doi.org/10.14214/sf.1054 | Download PDF

1 Introduction
There are approximately 350 000 privately owned forests in Finland, making private non-industrial forest owners central actors in the Finnish timber trade. A large number of private forest owners are active in the market: during a five-year period, almost two-thirds of forest owners sell timber (Hänninen et al. 2010). In fact, almost 80% of commercial timber in Finland comes from non-industrial private forests (Finnish Forest Research Institute 2012).
In Finland, 85% of the timber is sold as standing timber (Finnish Forest Research Institute 2012), which means that the company buying the timber is responsible for harvesting it. In these cases, the buyers bear the costs of harvesting and transportation. In the timber sale contract, the buyer and seller agree on stumpage prices (euros m–3) separately for each assortment (the most common ones are sawlog and pulpwood from pine, spruce and birch trees). Timber sales are the main source of income from forests, and stumpage prices are seen as one of the most important factors affecting a forest owner’s decision to sell (Kurki et al. 2012).
Finnish studies on stumpage prices have mainly focused on modelling average prices over time (e.g. Linden and Uusivuori 2000; Malaty et al. 2007). Weekly regional price information is publicly available and divided into timber assortments and felling types. However, timber sales are negotiated one at a time, and the actual stumpage prices paid in individual sales are influenced by site- and sale-specific characteristics, such as the size of the sale, the distance to a road network and contractual provisions.
The time consumption and cost of harvesting and transportation has been the subject of a number of studies (e.g. Kuitto et al. 1994; Nurminen et al. 2005; Nurminen and Heinonen 2007). There is, however, little information on how different factors are reflected in the stumpage prices paid in individual transactions (Kurki et al. 2012). Knowing which factors significantly influence stumpage prices could help the design of standing timber sales that achieve the best prices. Knowledge on harvest and transportation costs can guide the planning of sales, but the prices paid do not necessarily correspond directly to the difference between the value of timber at the mill and the costs for harvesting and transportation. The assumption is that buyers are well aware of how the costs are reflected in stumpage prices, whereas the sellers have less information about this effect.
The sellers of timber are guided mainly by past stumpage prices and their own price expectations play a part when deciding when to accept an offer. Little information on price formation could lead to forest owners selling their timber for lower prices than otherwise: Dahal and Mehmood (2005) found that non-industrial private forest owners achieved lower stumpage prices than other sellers, while Munn and Rucker (1995) found that the use of a consultant in private sales increased prices. As such, knowledge on factors that can be expected to lead to offers that are higher or lower than the average stumpage prices can support the analysis of offers. Stumpage prices that are expected to differ from the average prices can also affect the value of a forest stand.
The valuation of stumpage prices based on transaction evidence has a long history in North America, where regression models have been used particularly to appraise publicly owned tracts (e.g. Huebschmann et al. 2004). Some studies suggest that factors such as harvestable volume density (e.g. Huebschmann et al. 2004; Brown et al. 2012), total sale area (Buongiorno and Young 1984; Sydor and Mendell 2008) and the volume or diameter of the trees (e.g. Niquidet and van Kooten 2006; Sydor and Mendell 2008) influence stumpage prices, while others (Mey Huang and Buongiorno 1986; Sendak 1992; Leefers and Potter-Witter 2006) found that these factors had no significant effect on stumpage prices. Tract location (e.g. Leefers and Potter-Witter 2006; Brown et al. 2012) and the distance to the mill (e.g. Puttock et al. 1990; MacKay and Baughman 1996) could also influence stumpage prices. Stumpage prices have also been found to change over time and in relation to the season when the sale was made (e.g. Dahal and Mehmood 2005; Niquidet and van Kooten 2006).
The stumpage price recommendations that were agreed upon in Finland in 1978–1991 determined how sale-specific characteristics were taken into account in stumpage prices. However, the number of studies showing how sale-specific characteristics currently influence stumpage prices is rather limited: at least during this study no publicised studies were found. This also means that calculations of the profitability of forest road construction and forest land consolidation have to rely on rough estimates or on changes in harvesting costs to assess the benefits to the forest owners.
The purpose of this study is, therefore, to analyse the effects that sale- and site-specific characteristics have on the stumpage prices paid to non-industrial private forest owners in Finland. What characteristics are significant for stumpage prices and how do they affect the prices? Are economies or diseconomies of scale displayed in stumpage prices and to what extent? Market data from 2008–2012, collected from five local Forest Management Associations, are analysed using econometric estimation. One model is created for sawlogs and one for pulpwood. The results are also compared over time and for different Forest Management Associations. The material gathered and the theoretical background are presented below in greater detail, before reporting the results and comparing the results to other studies.
2 Materials and methods
2.1 Theoretical background
Prices in individual sales are set as an agreement between the forest owner and the purchaser. In a timber transaction, the buyers of stumpage are, at least in the long run, at most willing to pay the value of timber at the mill minus the costs for harvesting and transportation. On the other hand, the sellers will only accept offers above a certain minimum price, their reservation price, or they will not proceed with the sale. This sets the stumpage price, separately for each sale, somewhere between the buyer’s maximum willingness to pay, and the seller’s minimum willingness to accept (cf. Omwami 1986). The prices paid in individual sales, therefore, vary because standing timber sales are negotiated one at a time, sales attract different levels of competition and because the characteristics of each sale are different. Site- and sale-specific factors, such as the size of the sale, the distance to the road network and contractual provisions are unique for each sale. Stand-specific characteristics influence harvesting costs, and therefore also the price buyers are willing to pay for stumpage (Klemperer 1996).
Since standing timber, unlike timber from delivery sales, is harvested only after the purchase, expectations and uncertainties about future market and harvest conditions also need to be considered when setting a price. The amount of competition also has an influence on stumpage prices (Niquidet and van Kooten 2006). Purchasers need to take the competition into account when placing a bid: if there are many offers a higher bid is required to secure winning the bid, while stumpage can be bought at lower prices when there is little competition. As such, the stumpage price in an individual transaction can be seen as influenced by several characteristics:
Stumpage price = f(timber characteristics; harvest and transportation costs; market situation; competition; contractual terms)
In reality, some of these factors are displayed through other measurable variables, such as the size of the sale or the forest haulage distance. Differences in the size of the sale affect the harvest costs through economies of scale, but may also change the interest among buyers, which is difficult to measure and to know in advance. As such, including the size of the sale as a variable, rather than the estimated harvest costs, enables the estimation of the combined effect that can be seen in stumpage prices.
Timber buyers are expected to be familiar with the market prices, but private forest owners who do not regularly sell timber do not necessarily have specific knowledge on the price formation. This information disparity can lower the negotiation powers of private forest owners, unless consultants are used. For consultant sales, such as the sales through a Forest Management Association, it has been suggested that selling prices would be above those where no consultant is used (cf. Munn and Rucker 1994; Munn and Palmquist 1997). As a result, Munn and Palmquist (1997) suggested that consultant sales should display a non-normal distribution of residuals with a positive skew.
Hedonic price models can be used to estimate how the heterogeneous attributes of products are valued on the market, as a result of the interaction between buyers and sellers. Hedonic prices are based on the idea that the economic value of the characteristics of a good can be observed by the price differences (Rosen 1974), and that a statistical analysis of a set of heterogeneous sales can reveal how the different characteristics influence the prices. The general hedonic price model is
P = f(Zi, . . . , Zn)
where P represents the stumpage price, and Z = (Zi, . . . , Zn) represent the various uncorrelated characteristics that are expected to influence stumpage prices, such as total volume, forest haulage distance and geographic location.
2.2 Data collection
Historical market data were used to estimate the influence of site-specific characteristics on stumpage prices. The data were collected from Forest Management Associations, which offer forest owners guidance and professional assistance in forestry-related issues and in sales. Five local Forest Management Associations in different parts of Finland were included: Kalajokilaakso, Kuusamo, Länsi-Uusimaa, Pohjois-Karjala and Päijänne (Fig. 1). Data were originally gathered from seven Forest Management Associations, but two had to be excluded because sales had been recorded differently in the database, e.g. they did not differentiate between finalised sales and planned sales.
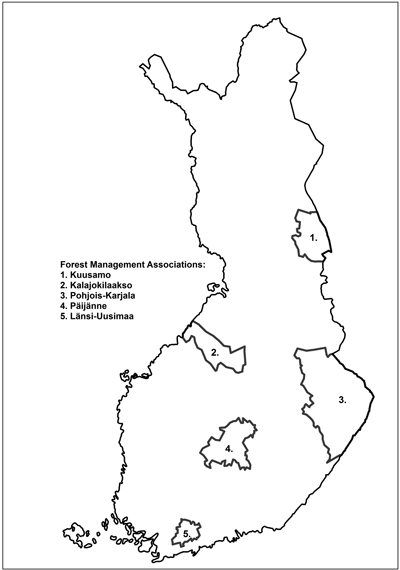
Fig. 1. The location of the five Forest Management Associations included in the study.
The data consist of 4824 standing timber sales between 2008 and 2012 where the forest owner had given a timber sale assignment to the local Forest Management Association. Delivery sales, where the seller is responsible for harvesting, were excluded because the compensations paid for harvesting were recorded in various ways. The volume of the sales varied between 4 m³ and 9200 m³. In Pohjois-Karjala, where the association corresponds to a whole region in the timber trade statistics by the Finnish Forest Research Institute, the standing timber sales in the sample correspond to approximately 12 % of the total volume of the standing timber trade between 2008 and 2012.
The following information was collected for each sale: municipality, date of purchase, size of marked stand (m³ and ha), seasonal harvest restrictions, felling method (first thinning, thinning and regeneration felling), the volume of the timber assortments involved in the sale (solid cubic metre, including bark) and the price (€ m–3) paid. Other information included forest haulage distance, the coordinates of the stands and information such as the presence of forest damage. The harvestable volume density (m³ ha–1) was calculated based on the total volume and the area of the marked stand.
Only sales where prices were listed separately for each timber assortment were included. Because the focus of this study is on the unit price (€ m–3) rather than the total sum of the sale, each separately priced assortment within a sale was treated as a separate case in the analysis. The data consisted of 53 488 cases. General data about the sale and the stands were combined with these prices.
Timber assortments were separated by dummy variables. Furthermore, variables were created to represent the percentage of the timber assortment in question in relation to the total volume of the sale and also what per cent of the total sale volume consisted of sawlogs. The assortment percentages were calculated by dividing the volume of the assortment by the total volume of the sale and multiplying this by 100. For the sawlog percentage, the volume of all log assortments, including logs of different grades, were added together; this number was then divided by the total volume and multiplied by 100.
Dummy variables were created for tracts marked as also being harvestable in the summer, as well as for tracts that are harvestable all year round, even when other areas are too wet to be harvested. The base group consists of tracts that can be harvested only in winter. For pulpwood, dummies were created for thinning and the first thinning. For sawlogs, only regeneration felling was included. The price effect of other, special felling methods, such as removing seed trees, was not estimated because one sale could include several felling methods and the assortments in the data were only coded for the three main felling types. Quarterly dummies were created to control for changes in stumpage prices over time. This was done because the goal was mainly to examine the impact of other characteristics rather than to explain how changes, for example in end-product markets, influence stumpage prices. The number of sales was the largest in the 4th quarter of 2010, with the fourth quarter also overall having the most sales.
The differences in prices between regional locations were included through dummies representing the Forest Management Associations. Local market conditions and the distance to the main purchasers can lead to variations in price levels between areas. Buongiorno and Young (1984) found that location did not affect stumpage prices in the studied area, while others (e.g. Leefers and Potter-Witter 2005; Niquidet and van Kooten 2006; Brown et al. 2012) found that prices differed between locations.
The distance from the marked stands to the road network was calculated using the topographic database of the National Land Survey of Finland. The forest haulage distance was calculated as the shortest geometrical distance from the centre of the compartments marked on the map to the nearest road (roads for motor vehicle traffic, less than 8 metres wide). Roads wider than 8 metres were excluded because these major roads cannot normally be used for loading timber. Uotila and Viitala (2000) and Viitala et al. (2004) used the same classification system. The forest haulage distances from the compartments were then weighed according to area and an average forest haulage distance for the entire sale was then calculated. The coordinates in the centre of the polygon where the software used by the Forest Management Associations had placed the number of the compartment was used as the centre of the compartment. This can result in errors in those cases where the number has manually been moved, but it was estimated that these cases were in a clear minority.
For 34% of the sales, a forest haulage distance to the landing had been marked in the database, usually with a precision rate of 50 metres. A comparison between the distances recorded in the data and the average forest haulage distances calculated from the topographic database showed that the calculated distances were, on average, 33 metres shorter than the recorded ones (standard deviation 180 m). The largest differences were found in cases where the forest haulage distance in the data was to a winter road or another road that was not included in the database search or in cases where the calculated forest haulage distance included crossing another property.
The longest forest haulage distance for sawlogs was approximately 1300 metres and for pulpwood 1700 metres. Cases with a forest haulage distance of more than 2000 metres were excluded because an inspection of these cases on a map revealed that they were situated on islands with no road access. For islands, the costs and arranging of harvesting and transportation differ considerably from normal cases, and including these cases would have affected the models. It is possible that some cases with a forest haulage distance below 2000 metres are also situated on islands, but these were not found to be outliers that could have a large influence on the models.
The distance from the roadside to the mill was not included because no data existed on where the timber was being transported to. Timber from a single purchase can be transported to different mills, making the haul distance difficult to establish. Previous attempts to use the distance to the nearest mill as an estimate of transportation distance have rendered the variable insignificant (eg. Nautiyal et al. 2006). Therefore, no attempts to include the transportation distance were made. Long-distance transportation accounts for almost 40% of the total unit costs of harvesting and transportation of timber in Finland (Finnish Forest Research Institute 2012). Part of the influence of the transportation cost can be expected to be included in regional dummy variables and part in the error term.
A dummy variable was created for all cases where some kind of forest damage had been recorded for at least part of the area included in the sale. This was done for 3.5% of the cases. Forest damage was caused particularly by storms, heavy snow, a lack of nutrients and tree diseases. Other quality indices, such as quality differences between sawlogs marked as part of the same assortment, could not be created because of data limitations.
Other variables that have been found to be significant in North American research, but that could not be included in the models because of data limitations, are the slope of the site (Niquidet and van Kooten 2006), contractual provisions (Leefers and Potter-Witter 2006; Brown et al. 2012) and competition between buyers (Dahal and Mehmood 2005; Leefers and Potter-Witter 2006).
2.3 Descriptive statistics
Descriptive statistics for sawlogs and pulpwood are presented in Table 1. Outliers were identified, and cases where the assortment clearly had been priced together with another, usually inferior, assortment were excluded. This was usually the case where the volume of the specific assortment was small.
| Table 1. Select descriptive statistics for the cases included in the models. | ||||
| Sawlogs | Pulpwood | |||
| Mean | Standard deviation | Mean | Standard deviation | |
| Price (€ m–3) | 51.82 | 8.12 | 16.22 | 3.90 |
| Total volume (m3) | 763.89 | 781.69 | 790.05 | 740.40 |
| Assortment percentage | 20.40 | 21.72 | 11.14 | 13.60 |
| Sawlog percentage | 57.27 | 19.35 | 39.42 | 22.42 |
| Forest haulage distance (m) | 182.44 | 142.54 | 225.36 | 162.59 |
2.4 Statistical analyses
The data were analysed using the ordinary least squares method. The general form of the linear regression model is as follows:
![]()
where β0 is the intercept, β1–n measure the change in y with respect to x1–n, while holding all other factors fixed, and u is the error term. The estimated equation expresses stumpage price per cubic metre (€ m–3) as a function of the independent variables. An attempt was made to take a natural logarithm of the unit price, but the linear form was found to be a better fit. The regression coefficients provide an estimate of the effect of the characteristics on stumpage prices.
The regression was first run separately for each region and assortment. Models were run on sawlogs and pulpwood from pine, spruce and birch trees. These assortments made up a total of 75.1% of the total volume, or approximately 2.5 million m³. The model was then simplified by combining the cases to produce more general models. The final models include one model for sawlogs and one for pulpwood. The models only include stumpage prices paid for basic sawlogs and pulpwood. Other assortments had a smaller numbers of cases and the assortments partly varied between tree species and regions. In the data from the Kuusamo Forest Management Association, there were no sales of birch sawlog.
The model for sawlogs was run on cases that were marked as regeneration felling. These accounted for 88% of the total volume of sawlogs. Furthermore, the volume of wood marked as originating from the first thinning was restricted to 0and the subsequent thinnings to a maximum of 10% of the volume of the individual sale. This enabled a more exact estimation of the average forest haulage distance when weighed by area. For pulpwood, all felling methods were included.
The performance of the parameters for comparing sales with different site-specific characteristics was tested by correcting unit prices with estimated coefficients, so that the prices would correspond to the characteristics of the average sawlog and pulpwood sale. Prices were corrected for harvest restrictions, forest damage, total volume, forest haulage distance (pulpwood), assortment and sawlog percentage and for thinnings (pulpwood). The market volatility was then compared to the total volatility of stumpage prices, separately for each assortment, year and Forest Management Association. The total volatility, Total CV = σ0 / μ, where σ0 is the standard deviation of stumpage prices in all transactions and μ is the average stumpage price, measures the dispersion in prices between transactions. The market volatility, Market CV = σ1 / μ, where σ1 is the standard deviation of the corrected prices and μ the average price as above, measures the level of dispersion not explained by the factors used for correcting prices.
3 Results
Table 2 shows the results of the regression models for the stumpage prices (€ m–3) paid for sawlogs and pulpwood in 2008–2012. The base group for dummy variables consisted of winter-harvestable Scots pine from Kalajokilaakso during the 4th quarter of 2012. The constant term has no substantial interpretation on its own. The models account for 74.1% of the variance in stumpage prices for sawlogs and 55.6% for pulpwood. Part of the price variations was left unexplained (Fig. 2 and Fig. 3). An inspection of residuals did not, however, reveal harmful heteroscedasticity (Fig. 4 and Fig. 5). The recognisable pattern in the graphs is due to the stumpage prices being rounded, usually to the nearest euro. This means that some small variations in the independent variables are not reflected in the dependent variables. This effect, however, does not have a systematic size or direction.
| Table 2. Regression model on stumpage prices (€ m–3) for sawlogs from regeneration felling and for pulpwood in 2008–2012. | ||||
| Sawlogs | Pulpwood | |||
| Number of cases | 4316 | 17808 | ||
| R2 | 0.741 | 0.556 | ||
| Variable | β | S.E. | β | S.E. |
| Constant | 44.647 | 0.587*** | 12.859 | 0.190*** |
| Summer harvestability | 1.223 | 0.165*** | 0.575 | 0.045*** |
| No seasonal harvest restrictions | 1.906 | 0.257*** | 0.679 | 0.091*** |
| Forest damage present | –1.067 | 0.436* | –0.302 | 0.097** |
| ln total volume | 1.484 | 0.076*** | 0.736 | 0.024*** |
| Forest haulage distance (km) | –0.296 | 0.497 | –1.559 | 0.133*** |
| Assortment percentage | 0.034 | 0.004*** | 0.024 | 0.002*** |
| Birch*assortment percentage | 0.154 | 0.015*** | - | - |
| Sawlog percentage | 0.020 | 0.004*** | 0.016 | 0.001*** |
| Q1_2008 | 5.255 | 0.493*** | 1.493 | 0.170*** |
| Q2_2008 | 4.510 | 0.511*** | 1.952 | 0.154*** |
| Q3_2008 | 3.861 | 0.385*** | 2.045 | 0.121*** |
| Q4_2008 | 2.184 | 0.389*** | 2.114 | 0.119*** |
| Q1_2009 | –3.886 | 0.672*** | 0.716 | 0.210*** |
| Q2_2009 | –8.014 | 0.645*** | –0.175 | 0.221 |
| Q3_2009 | –8.342 | 0.453*** | –1.088 | 0.165*** |
| Q4_2009 | –7.089 | 0.383*** | –0.999 | 0.119*** |
| Q1_2010 | –5.190 | 0.446*** | –0.134 | 0.132 |
| Q2_2010 | –1.573 | 0.432*** | 0.164 | 0.132 |
| Q3_2010 | 0.990 | 0.378** | 0.828 | 0.117*** |
| Q4_2010 | 0.766 | 0.354* | 0.491 | 0.111*** |
| Q1_2011 | 0.457 | 0.416 | 0.524 | 0.123*** |
| Q2_2011 | 1.303 | 0.414** | 0.767 | 0.129*** |
| Q3_2011 | 2.322 | 0.433*** | 0.814 | 0.142*** |
| Q4_2011 | 0.867 | 0.397* | 0.610 | 0.129*** |
| Q1_2012 | 0.205 | 0.413 | 0.306 | 0.123** |
| Q2_2012 | 0.498 | 0.498 | 0.062 | 0.149 |
| Q3_2012 | 0.973 | 0.453* | 0.184 | 0.142 |
| Pohjois-Karjala | –0.842 | 0.189*** | –1.793 | 0.056*** |
| Länsi-Uusimaa | –2.498 | 0.223*** | –1.379 | 0.078*** |
| Päijänne | –0.192 | 0.197 | –0.829 | 0.064*** |
| Kuusamo | –7.775 | 0.574*** | –4.924 | 0.080*** |
| Spruce sawlog | –1.021 | 0.156*** | - | - |
| Birch sawlog | –13.529 | 0.190*** | - | - |
| First thinning | - | - | –4.350 | 0.060*** |
| Thinning | - | - | –3.019 | 0.047*** |
| Spruce pulpwood | - | - | 2.040 | 0.048*** |
| Birch pulpwood | - | - | –0.966 | 0.048*** |
| * Corresponding p-value less than 0.05, ** less than 0.01 and *** less than 0.001. | ||||
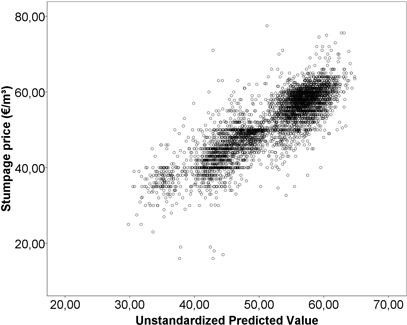
Fig. 2. Predicted values plotted against stumpage prices for sawlogs.
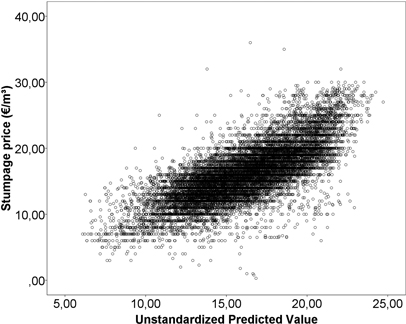
Fig. 3. Predicted values plotted against stumpage prices for pulpwood.
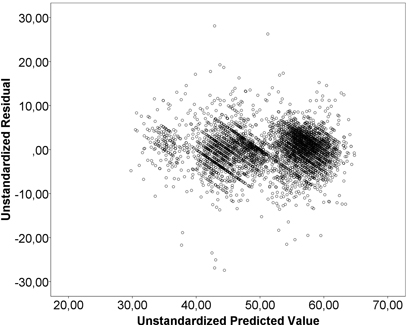
Fig. 4. Residuals and predicted values from the sawlog model.
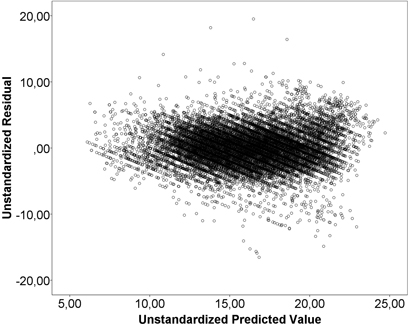
Fig. 5. Residuals and predicted values from the pulpwood model.
No strong signs of correlation between explanatory variables or multicollinearity were detected, and variance inflation factors (VIF) were below 4 for quarterly dummy variables and below 2 for all other variables. An analysis of the normality plots of residuals showed that the models tended to overestimate the lowest stumpage prices and underestimate the highest stumpage prices. Partly, this may be caused by lacking variables, such as quality and tree size. For prices closer to the average the residuals are at a visual inspection close to normal. The normality of residuals is rejected at a 0.001 level in all models (Kolmogorov-Smirnov test of normality). This was, however, expected because the tests are sensitive at large sample sizes, and a slight deviation from normality is not considered problematic for large samples (cf. Lumley et al. 2002).
The residuals displayed a negative skew (–0.258) for sawlogs and was close to zero for pulpwood (–0.029). Therefore, the residuals did not show the positive skew that Munn and Palmquist (1997) predicted for consultant sales. For sawlogs the skewness of residuals was close to normal for three Forest Management Associations, but negative for Kalajokilaakso and Kuusamo. In these two associations there were low prices that the model could not take into account, but few exceptionally high prices. Prices were usually limited from above rather than below: buyers do not pay stumpage prices above their maximum willingness to pay, whereas sellers can accept low stumpage prices for poor quality timber or for small assortments that form only a small share of the whole sale. For pulpwood the prices were limited also from below because no assortment was assigned a negative price: if the pulpwood, in fact, has a negative value to the buyer, it will instead lower the stumpage prices offered for the other assortments.
Correcting stumpage prices with the parameters for harvest restrictions, forest damage, total volume, forest haulage distance (pulpwood), assortment and sawlog percentage, and thinnings (pulpwood) reduced the volatility by 9 % for sawlogs and 22 % for pulpwood. The performance was heavily dependent on the year: at most the volatility was reduced by 27 % for sawlogs and 38 % for pulpwood. The unexplained part of the volatility is down to stochastic variations, variations in the market price during the year, location within the Forest Management Association, average tree size, timber quality, and other factors not included in the models. The total volatility was on average 7.5 % for pine and spruce sawlogs and the market volatility 6.8 %. For pulpwood the total volatility was on average 20.4 % and the market volatility 16.0 %. The volatility of birch sawlog prices were excluded from all calculations above because there were not enough cases for meaningful comparisons.
The effects of various variables are presented and discussed below. Results are also compared to other studies, and results from yearly as well as Forest Management Association-specific models are reported in comparison to the general models. The R² for association-specific models were 0.694–0.824 for sawlogs and 0.533–0.684 for pulpwood. For the yearly models, the R² was 0.570–0.774 for sawlogs and 0.538–0.702 for pulpwood. No results from the model for sawlogs are reported for Kuusamo because the number of cases from regeneration felling was low (59 cases).
3.1 Timber assortment
A higher percentage of both sawlogs and the assortment raised stumpage prices for sawlogs and pulpwood. The coefficients for the sawlog percentage are approximately the same both in the sawlog and pulpwood models, while the price effect of the assortment percentage is larger for sawlogs. The assortment percentage for birch sawlogs had a much larger effect than for other assortments. For birch pulpwood, the assortment percentage did not differ significantly from other pulpwood assortments and the variable for birch percentage was excluded from the model.
In the association-specific models for sawlogs (640–1421 cases), we found that either the product percentage or the log percentage was statistically significant, while both were statistically significant for most pulpwood models (1572–6841 cases). The coefficients ranged from 0to 0.08 for pulpwood, while for birch sawlog the combined effect of the coefficients ranged from 0.10 to 0.30.
The results reflect the fact that adding more products to the assortment slows down the processing time when harvesting. Nurminen et al. (2006) found that there was a difference between extracting only one or two assortments, with mixed pulpwood and sawlog loads being the least effective. Load volumes in transport have also been found to be on average lower for pulpwood than for sawlogs (Nurminen and Heinonen 2007). Sydor and Mendell (2008) also found that a higher percentage of pulpwood within a particular sale lowered stumpage prices.
The assortment was the most important factor explaining the variation of stumpage prices in sawlog sales. Stumpage prices for birch sawlogs were considerably lower than for other species, which explains the large effect of assortment on prices. The coefficient of the dummy variable for birch sawlog was consistently around –14 for all associations and varied between –10 and –16 depending on the year. The prices of pine and spruce sawlogs did not differ in all associations or during all years. In Länsi-Uusimaa, there was a large difference between pine and spruce pulpwood, with spruce pulpwood on average being valued at 5.7 € m–3 less. In Kuusamo prices were not found to differ between pine and spruce pulpwood, and in Päijänne they did not differ between pine and birch pulpwood.
3.2 Thinnings
The pulpwood model included cases from the first thinning and subsequent thinnings. Prices paid for wood originating from thinnings were considerably lower. This was expected, because the time consumption of harvesting is greater for thinning compared to regeneration felling (Kuitto et al. 1994; Nurminen et al. 2006), and the average tree size is also different. Data on tree size would have made it possible to explore how much of the price difference is due to differences in harvesting techniques and how much due to differences in tree size, but unfortunately data on tree size were not available.
3.3 Time
We chose to use quarterly coefficients for price changes over time. Quarterly coefficients explained prices better than a combination of yearly coefficients and coefficients for the season of sale. Using regional average delivery sale prices to explain stumpage prices was attempted, but results for 2008 suggested that delivery prices lagged behind stumpage prices. As such, past delivery prices cannot be used to estimate how stumpage prices will develop in the future. It is possible that factors such as the small share of delivery sales of the whole timber trade in Finland make standing timber sales more prominent in setting market prices, or that uncertainties in the market were first reflected in stumpage sales, which will be harvested in the future.
Fig. 6 shows how sawlog and pulpwood prices changed over time. The coefficients were larger for sawlogs than pulpwood. Running a regression on only quarterly dummies gave an R² of 0.167 for sawlogs and 0.065 for pulpwood when including only regeneration felling for comparability purposes. The quarterly variation in prices was the second most important factor explaining stumpage prices for sawlogs, after assortment (pine/spruce/birch) which alone explained 48.5% of the variations in stumpage prices. Pulpwood prices were more stable, and factors such as assortment, thinning and regional location had a larger effect than time.
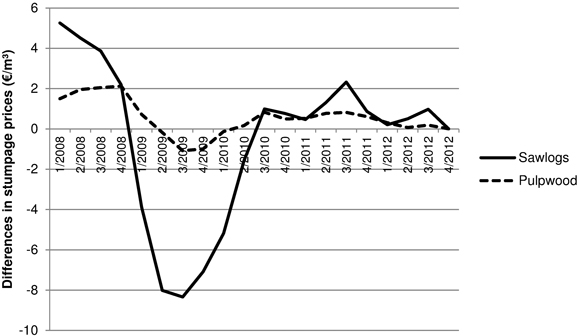
Fig. 6. Quarterly changes in stumpage prices for sawlogs and pulpwood as expressed in €/m3, 4/2012 = 0.
Strong price variations over time were expected. Stumpage prices vary depending on the end-product market and general economic conditions. The Finnish forest industry is heavily dependent on exports, and changes in the demand for forest products affect the demand for sawlogs (Hetemäki et al. 2004). The volume of the Finnish timber trade also varies greatly: in 2009 only 16.5 million m³ were sold, compared to 33.2 million m³ in 2010 (Finnish Forest Research Institute 2012). In 2009, the stumpage prices were also lowest, following high prices in 2008.
3.4 Harvest restrictions
Stands are marked as being harvestable only in winter, as being summer harvestable also, or as having no seasonal harvest restrictions. In the sample, 37% of stands were marked as winter harvestable only and 56% were marked as summer harvestable. Summer harvestability and no seasonal harvest restrictions had an expected positive effect on prices. Stands with seasonal harvest restrictions have to be harvested during suitable weather conditions, while stands with no seasonal harvest restrictions can be harvested according to demand. MacKay and Baughman (1996), Sydor and Mendell (2008) and Brown et al. (2012) also found that harvest restrictions lowered the willingness to pay for standing timber.
3.5 Volume of sale
Selling a larger volume at one time leads to higher stumpage prices. However, the effect of the sale volume on prices was expected to decrease for large tracts rather than remain linear. Therefore, we used a natural logarithm of the total volume as expressed in cubic metres. Doubling the volume was associated with a rise of 1.03 € m–3 in stumpage prices for sawlogs (95% confidence interval, 0.93 to 1.13 € m–3) and 0.51 € m–3 for pulpwood (95% confidence interval, 0.48 to 0.54 € m–3). Fig. 7 shows the relative effect of the total volume on stumpage prices. The relative effect is larger for pulpwood. The total volume expressed in cubic metres explained size differences better than stand area.
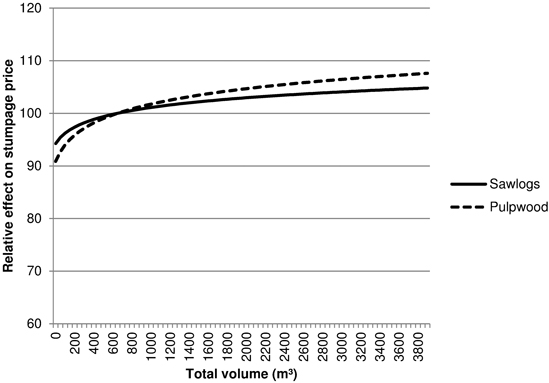
Fig. 7. The relative effect of the total volume of the sale on stumpage prices (€/m3), 750 m3 = 100.
We also found that the variable for volume was significant in all association-specific and yearly models. An attempt to include interaction terms between the logarithm of the total volume and Forest Management Association dummy variables showed that for sawlogs the effect did not significantly differ between associations. For pulpwood, however, the effect of the total volume was smaller in Pohjois-Karjala (0.674) and Länsi-Uusimaa (0.529) than in the other associations (0.822). The volume coefficients seemed to get larger over time, with the smallest coefficients occurring in 2009 when prices were also the lowest. The largest coefficients were approximately twice as large as those for 2009: they were 1.9 for sawlogs in 2012 and 0.9 for pulpwood in 2011.
Mey Huang and Buongiorno (1986), Sydor and Mendell (2008) and Brown et al. (2012) also found that larger sales lead to higher prices, reflecting economies of scale. Huebschmann et al. (2004) found that this only applied to the total sawtimber volume, while a larger pulpwood volume lowered the total bid. Large, complex sales can, however, lead to lower prices if large sales are associated with higher development costs, or if the size discourages small companies from bidding. This has been the case especially for stumpage sellers such as the US Forest Service (Jackson 1987; Sendak 1992). The size of the sales in this study was considerably smaller than in most North American studies focusing mainly on analysing public sales, so increased prices were expected.
Harvest density (m³ ha–1), while statistically significant, was not found to significantly improve the model and so we excluded it. The coefficient for the variable was approximately 0.001 and it did not improve the coefficient of determination. The harvest density was also heavily correlated with thinning and sawlog percentage, which explained prices better than harvest density. To a large extent these describe the same phenomena as harvest density. Furthermore, the harvest density was affected by cases where the harvest slash had been sold as energy wood. Huebschmann et al. (2004) also found that increases in the harvest density corresponded to only small differences in stumpage prices. Brown et al. (2012) found larger effects of harvest density, but included price differences between regeneration felling and thinning in the harvest density. Other studies found that harvest density had no significant effect on stumpage prices (Buongiorno and Young 1984; Leefers and Potter-Witter 2006; Niquidet and van Kooten 2006), but it is unclear why this was the case. Nurminen et al. (2006) showed that the time consumption of harvesting is lower for higher timber densities.
The timber value per cubic metre has also been found to increase with tree size (Nautiyal et al. 1995; Huebschmann et al. 2004; Sydor and Mendell 2008), but the unavailability of data on tree volume or diameter means that this effect could not be estimated. Studies have shown that cutting productivity increases non-linearly with stem size, at least up to the optimal stem size for the machine being used (Kuitto et al. 1994; Nurminen et al. 2006).
3.6 Regional location
The results show that prices differed between locations, with Kalajokilaakso and Päijänne having the highest prices and Kuusamo the lowest. Forest Management Association-specific models also suggested that prices differed between certain municipalities within the same association, in particular in the large Pohjois-Karjala association. The different price levels in regions may be due to differences between sales, geography, the distance to purchasers and variations in the level of competition. Kuusamo exhibits a combination of these factors: a northern location with long distances and few buyers. Buongiorno and Young (1984) found that location did not affect stumpage prices in the studied area, while others (e.g. Leefers and Potter-Witter 2006; Niquidet and van Kooten 2006; Brown et al. 2012) found that prices differed between locations.
3.7 Forest haulage distance
For sawlogs, the average forest haulage distance was not statistically significant at any normal levels in any of the models. The coefficient was also sensitive to changes in the data: when including 5 cases with forest haulage distances above 2 km the coefficient was –1.113 and statistically significant (p-value 0.002). These cases were, however, excluded, because they gave a false sense of security to the coefficient and they reflected a haulage distance over water rather than in forest. For pulpwood, the forest haulage distance was statistically significant in the general model as well as in all yearly and association-specific models, apart from in Länsi-Uusimaa. The coefficients ranged from –0.9 € m–3 to –2.7 € m–3 when the forest haulage distance was expressed in kilometres, with the effect being the largest in Päijänne. Fig. 8 shows the relative effect of forest haulage distance on stumpage prices for pulpwood. The pulpwood model was also not as sensitive to including cases with a forest haulage distance above 2 km. A logarithmic transformation of the forest haulage distance did not improve the models.
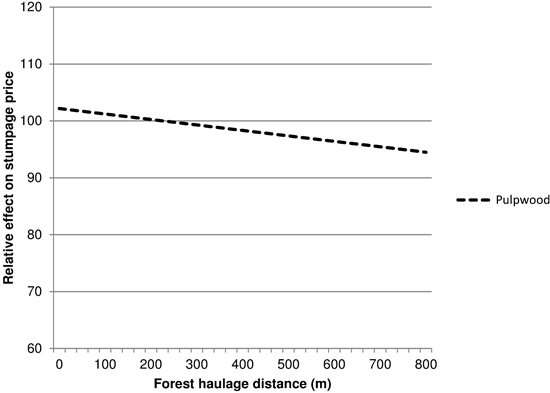
Fig. 8. The relative effect of forest haulage distance on stumpage prices (€/m3) of pulpwood, 225 m = 100.
We had expected that the forest haulage distance would affect prices. A longer transportation distance leads to higher costs for harvesting and hauling, affecting the buyer’s willingness to pay for stumpage. Both the forest haulage distance from the place of harvest to the nearest landing (Kuitto et al. 1994; Nurminen et al. 2006), and the distance from the landing to the mill (Nurminen and Heinonen 2007) can have an impact on the time consumption and costs, and therefore also on stumpage prices. For pulpwood, the estimated coefficients roughly corresponded to the results from other time consumption studies (Kuitto et al. 1994; Väkevä et al. 2001) when using an hourly cost of 59.5 € (Väätäinen et al. 2008), but they were lower than those based on the findings by Nurminen et al. (2006). For sawlogs, the estimated coefficient was considerably smaller.
American studies have also been inconclusive regarding the effect of the transportation distance on stumpage prices. Researchers have found that a longer transportation distance lowers prices (Puttock et al. 1990; MacKay and Baughman 1996; Niquidet and van Kooten 2006) or else has no effect on stumpage prices (Jackson and McQuillan 1979; Nautiyal et al. 1994). Jackson (1986) found that the unpaved transportation distance and the forest haulage distance did not affect stumpage prices. Generally seen, transportation distances have been found to lower prices whenever they can be correctly estimated and when there is a large variation in the distances in the sample. This is reflected also in our study; small variations in the forest haulage distance made the estimation of this coefficient difficult, even with a relatively large sample size.
3.8 Other factors
Fire and storm damage or other quality indices have been found to affect stumpage prices (Mey Huang and Buongiorno 1986; Puttock et al. 1990; Niquidet and van Kooten 2006). In this study, storm and other damages recorded on at least part of the trees in the sale lowered prices on average by 0–3 € m–3. This effect, however, depends on the extent of the damage and the amount of damaged stumpage within the transaction.
This study included only sales through the local Forest Management Association. One-fifth of all forest owners sell timber with the assistance of the local Forest Management Association (Hänninen et al. 2011). Owners of small properties, those who only sell timber rarely and owners above 55 years of age are more likely to market their timber through the Forest Management Association, while owners of large properties usually sell their timber straight to the buyers (Kurki et al. 2012). This means that smaller properties are likely to be overrepresented in the sample, whereas properties above 100 hectares are underrepresented. Furthermore, Sydor and Mendell (2008) show that stumpage prices could also differ between ownership groups, so the results do not necessarily apply to sales by private companies and the government. Price differences between ownership groups and consultant and non-consultant sales could, however, not be analysed, because we had no data on other sales.
4 Discussion and conclusions
Stumpage prices in standing timber sales are affected by the market situation and also by harvesting costs. We used data gathered from local Forest Management Associations to create regression models providing an estimate of the influence of sale-specific factors on stumpage prices. The results show that buyers take differences in harvest costs into account when making purchase offers. The results also suggest that buyers are more interested in stands with a high percentage of sawlogs. A higher percentage of sawlogs increased the stumpage prices both for sawlogs and for pulpwood. The stumpage prices paid for an assortment were also higher if the assortment responded to a larger part of the sale. When the volume of a product was small, it was sometimes priced together with another assortment, or given a symbolic price.
The economies of scale were, expectedly, reflected in stumpage prices. Variations in the coefficient between years, however, suggest that other factors, such as the market situation, affect to what degree the economies of scale are displayed in stumpage prices. When there is a high demand for timber there is more competition for large sales, which raises prices. On the other hand, no or little premium is paid for large sales when demand is low, as in 2009. As such, not only harvest costs but also market conditions and competition affect how the different characteristics of a sale get valued.
The average forest haulage distance was significant for pulpwood but not for sawlogs. It is possible that other factors determine the stumpage prices for sawlogs in regeneration felling. Additionally, most cases had a relatively short forest haulage distance (average approximately 200 metres), making the coefficient sensitive to changes in the cases that had a long forest haulage distance. This was the case especially in the model for sawlogs, where prices seemed to behave as expected around the average forest haulage distance but not for long distances. It is possible that stands with a long forest haulage distance were only sold when they had a high value, and that the model could not fully account for this. Stands marked as being located next to a road also meant that some tracts had unrealistically short average forest haulage distances (minimum 0.36 metres). The sign of the coefficient is, nevertheless, as predicted.
Short-term variations in stumpage prices add uncertainty to the models, which only account for quarterly changes in the price level. The lack of data on timber quality and the average size per tree also means that the price effects of these factors could not be estimated. Further variability is added in cases where timber had been separated into different price categories due to different quality or stand characteristics. Data on these differences could, however, not be combined.
Large variations in the quarterly price levels mean that the timing of sales becomes the most important decision affecting the income earned from the forest. Other important factors, such as location and felling type, cannot be changed. Forest management association-specific models and yearly models also suggest that coefficients to some extent differ between regions and change over time. The largest differences are, however, to be found in the coefficients for assortments, indicating that the market situation for different assortments varies between locations and over time. The strong effect of the market conditions on stumpage prices complicates the use of historical market data for predicting future prices. This cannot either be overcome by using past delivery prices for predicting stumpage prices, because results suggested that these lagged behind stumpage prices.
The results can still be used as estimates of the impact of various factors on stumpage price. The regression coefficients can be used to compare how stumpage prices can be expected to differ between sales with different characteristics. Correcting prices for factors included in the models explained up to 38 % of the variations in stumpage prices paid during a year for an assortment within the same Forest Management Association. The results can also be used to analyse how the design of the sale can affect the price. The seller can influence especially the size of sales and the mix of assortments when planning a timber transaction. Offering larger volumes at a time could raise stumpage prices. A large-scale diversification of the assortment could, however, cancel price effects gained through offering a larger volume.
The sale volume and assortment mix are also factors that could be influenced by a move from even-aged forest management towards alternative management and harvest methods. For example, a change in the total volume of a sale from 500 m³ to 200 m³ due to group selection felling (cf. Imponen et al. 2003) would lower stumpage prices in that sale with 1.4 € m–3 for sawlogs and 0.7 € m–3 for pulpwood. Imponen et al (2003) calculated that applying group selection felling would raise the average timber acquisition costs for mills with 0.5 to 1.5 € m–3, depending on how large part of harvests are affected. This study, however, suggests that a large part of the rise in harvest costs would be transferred as a decrease in stumpage prices.
Some site-specific factors can also be changed through improvements of the forest road network and through land consolidation. The regression coefficients could be used for estimating increases or decreases in future stumpage prices, caused by a decrease in the forest haulage distance or a change in the average sale volume due to the project. This, rather than a focus on changes in harvest costs, enables the estimation of benefits to the majority of private forest owners who do not harvest themselves but sell standing timber. In North America, regression models for stumpage prices are also used when valuing real estate (Klemperer 1996). Stumpage prices used as input in forest valuation could be corrected with estimated factors if the stands differ from the average stand.
Acknowledgements
This study was part of the project “Need and impacts of forest land consolidation”, funded by the Finnish Ministry of Agriculture and Forestry and the National Land Survey of Finland. We wish to thank the Forest Management Associations for providing the necessary data. We would also like to thank the reviewers for their valuable comments.
References
Brown R., Kilgore M., Coggins J., Blinn C. (2012). The impact of timber-sale tract, policy, and administrative characteristics on state stumpage prices: an econometric analysis. Forest Policy and Economics 21: 71–80. http://dx.doi.org/10.1016/j.forpol.2011.10.001.
Buongiorno J., Young T. (1984). Statistical appraisal of timber with an application to the Chequamegon National Forest. Northern Journal of Applied Forestry 1: 72–76.
Dahal P., Mehmood S. (2005). Determinants of timber bid prices in Arkansas. Forest Products Journal 55(12): 89–94.
Finnish Forest Research Institute. (2012). Finnish statistical yearbook of forestry 2012. 387 p.
Hänninen H., Karppinen H., Leppänen J. (2011). Suomalainen metsänomistaja 2010. Working Papers of the Finnish Forest Research Institute 208. 94 p. http://www.metla.fi/julkaisut/workingpapers/2011/mwp208.htm.
Hetemäki L., Hänninen R., Toppinen A. (2004). Short-term forecasting models for the Finnish forest sector: lumber exports and sawlog demand. Forest Science 50(4): 461–472.
Huebschmann M., Lynch T., Lewis D., Tilley D., Guldin J. (2004). A bid price equation for national forest timber sales in Western Arkansas and Southeastern Oklahoma. Southern Journal of Applied Forestry 28(2): 100–108.
Imponen V., Keskinen S., Linkosalo T. (2003). Monimuotoisuus talousmetsän uudistamisessa – kuusikoiden käsittelyvaihtoehtojen vaikutukset puuntuotannon ja -hankinnan talouteen. Metsätehon raportti 163.
Jackson D. (1987). Why stumpage prices differ between ownerships: a statistical examination of state and forest service sales in Montana. Forest Ecology and Management 18: 219–236. http://dx.doi.org/10.1016/0378-1127(87)90162-9.
Jackson D., McQuillan A. (1979). A technique for estimating timber value based on tree size, management variables, and market conditions. Forest Science 25(4): 620–626.
Klemperer W.D. (1996). Forest resource economics and finance. McGraw-Hill, New York. 551 p.
Kuitto P.-J., Keskinen S., Lindroos J., Oijala T., Rajamäki J., Räsänen T., Terävä J. (1994). Puutavaran koneellinen hakkuu ja metsäkuljetus. Summary: Mechanised cutting and forest haulage. Metsäteho Report 410. 38 p.
Kurki P., Mutanen A., Mikkola E., Leppänen J., Hänninen R. (2012). Puumarkkinoiden toimivuus ja kehittämiskohteet. Working Papers of the Finnish Forest Research Institute 242. 72 p.
Leefers L., Potter-Witter K. (2006). Timber sale characteristics and competition for public lands stumpage: a case study from the Lake States. Forest Science 54(4): 460–467.
Linden M., Uusivuori J. (2000). Modelling timber price forecasts and stumpage price expectations in Finland 1900–1997. Journal of Forest Economics 6(2): 131–149.
Lumley T., Diehr P., Emerson S., Chen L. (2002). The importance of the normality assumption in large public health data sets. Annual Review of Public Health 23: 151–169. http://dx.doi.org/10.1146/annurev.publhealth.23.100901.140546.
MacKay D., Baughman M. (1996). Multiple regression-based transactions evidence timber appraisal for Minnesota’s State Forests. Northern Journal of Applied Forestry 13(3): 129–134.
Malaty R., Toppinen A., Viitanen J. (2007). Modelling and forecasting Finnish pine sawlog stumpage prices using alternative time-series methods. Canadian Journal of Forest Research 37: 178–187. http://dx.doi.org/10.1139/x06-208.
Mey Huang F., Buongiorno J. (1986). Market value of timber when some offerings are not sold: Implications for appraisal and demand analysis. Forest Science 32(4): 845–854.
Munn I., Palmquist R. (1997). Estimating hedonic price equations for a timber stumpage market using stochastic frontier estimation procedures. Canadian Journal of Forest Research 27(8): 1276-1280. http://dx.doi.org/10.1139/x97-088.
Munn I., Rucker R. (1995). An economic analysis of the differences between bid prices on Forest Service and private timber sales. Forest Science 41(4): 823–840.
Nautiyal J., Kant S., Williams J. (1995). A transaction evidence based estimate of the stumpage value of some southern Ontario forest species. Canadian Journal of Forest Research 25: 649–658. http://dx.doi.org/10.1139/x95-072.
Niquidet K., van Kooten C. (2006). Transaction evidence appraisal: competition in British Columbia’s stumpage markets. Forest Science 54(4): 451–459.
Nurminen T., Heinonen J. (2007). Characteristics and time consumption of timber trucking in Finland. Silva Fennica 41(3): 471–487. http://dx.doi.org/10.14214/sf.284.
Nurminen T., Korpunen H., Uusitalo J. (2006). Time consumption analysis of the mechanized cut-to-length harvesting system. Silva Fennica 40(2): 335–363.
Omwami R. (1986). A theory of stumpage appraisal. Silva Fennica 20(3): 189–203. http://dx.doi.org/10.14214/sf.a15452.
Puttock G.D., Prescott D.M., Meilke K.D. (1990). Stumpage prices in Southwestern Ontario: a hedonic function approach. Forest Science 36(4): 1119–1132.
Rosen S. (1974). Hedonic prices and implicit markets: product differentiation in pure competition. The Journal of Political Economy 82(1): 34–55. http://dx.doi.org/10.1086/260169.
Sendak P. (1992). State and federal timber stumpage prices in Vermont. Northern Journal of Applied Forestry 9: 97–101.
Sydor T., Mendell B.C. (2008). Transaction evidence analysis; stumpage prices and risk in central Georgia. Canadian Journal of Forest Research 38: 239–246. http://dx.doi.org/10.1139/X07-126.
Uotila E., Viitala E.-J. (2000). Tietiheys metsätalouden maalla. Metsätieteen aikakauskirja 1/2000: 19–33.
Väätäinen K., Lappalainen M., Asikainen A., Anttila P. (2008). Kohti kustannustehokkaampaa puunkorjuuta – puunkorjuuyrittäjän uusien toimintamallien simulointi. Working Papers of the Finnish Forest Research Institute 73. 52 p. http://www.metla.fi/julkaisut/workingpapers/2008/mwp073.htm.
Väkevä J., Kariniemi A., Lindroos J., Poikela A., Rajamäki J., Uusi-Pantti K. (2001). Puutavaran metsäkuljetuksen ajanmenekki. Metsätehon raportti 123. 41 p.
Viitala E.-J., Saarinen V.-M., Mikkola A., Strandström M. (2004). Metsäteiden lisärakentamistarpeen määrittäminen paikkatietoaineistojen avulla. Metsätieteen aikakauskirja 2/2004: 175–192.
Total of 34 references
