Pavel Škvor  ,
Martin Jankovský,
Pavel Natov,
Jiří Dvořák
,
Martin Jankovský,
Pavel Natov,
Jiří Dvořák
Evaluation of stress loading for logging truck drivers by monitoring changes in muscle tension during a work shift
Škvor P., Jankovský M., Natov P., Dvořák J. (2023). Evaluation of stress loading for logging truck drivers by monitoring changes in muscle tension during a work shift. Silva Fennica vol. 57 no. 1 article id 10709. https://doi.org/10.14214/sf.10709
Highlights
- This study compared the workload of drivers when driving different types of vehicles
- The combination of a truck and trailer exposes the driver to a significantly greater workload than trucks without trailers
- The workload of drivers varied during a work shift i.e. drivers experienced significantly more workload in the middle of their work shifts.
Abstract
Our research aimed to quantify and evaluate the stress loading of drivers by monitoring the loading of the radial extensor muscle at the wrist joint (musculus extensor carpi radialis) when they drove different types of timber trucks. We monitored changes in the electric potential of skeletal muscles with electromyographic measurements and measurements of changes of heart rate using the Biofeedback 2000 x-pert device. The drivers were observed throughout their work shifts during normal operation of logging trucks and logging trucks with trailers. As a reference, muscle load was measured when driving a passenger car. We evaluated the normality of the measured data and obtained descriptive statistics from the individual measurements. The differences in stress load associated with driving the different types of vehicles increased whilst driving on lower-class roads. Results showed a high stress load for drivers of loaded vehicles when driving on narrow roads. It was more challenging to control a loaded logging truck with a trailer than driving a logging truck, with the difference in muscular loading reaching 22.5%. Driving a logging truck with a trailer produced 46.5% more muscle loading compared to driving a loaded passenger car. For preventive health and safety reasons, it would be reasonable to alternate between drivers when operating various vehicles, thus minimizing the development of possible health issues.
Keywords
timber transportation;
biofeedback;
driver;
electromyography;
physical load
-
Škvor,
Department of Forestry Technologies and Construction, Faculty of Forestry and Wood Sciences, Czech University of Life Sciences Prague, Kamýcká 129, 165 21 Prague 6 - Suchdol, Czech Republic
 https://orcid.org/0000-0001-7540-4761
E-mail
skvorp@fld.czu.cz
https://orcid.org/0000-0001-7540-4761
E-mail
skvorp@fld.czu.cz
- Jankovský, Department of Forestry Technologies and Construction, Faculty of Forestry and Wood Sciences, Czech University of Life Sciences Prague, Kamýcká 129, 165 21 Prague 6 - Suchdol, Czech Republic E-mail jankovskym@fld.czu.cz
- Natov, Department of Forestry Technologies and Construction, Faculty of Forestry and Wood Sciences, Czech University of Life Sciences Prague, Kamýcká 129, 165 21 Prague 6 - Suchdol, Czech Republic E-mail natov@fld.czu.cz
-
Dvořák,
Department of Forestry Technologies and Construction, Faculty of Forestry and Wood Sciences, Czech University of Life Sciences Prague, Kamýcká 129, 165 21 Prague 6 - Suchdol, Czech Republic
https://orcid.org/0000-0002-5986-8002
E-mail
dvorakj@fld.czu.cz
Received 28 January 2022 Accepted 22 February 2023 Published 21 March 2023
Views 60389
Available at https://doi.org/10.14214/sf.10709 | Download PDF

1 Introduction
According to the Yearbook of the Czech Statistical Office, in 2020 a total of 35.7 million m3 of wood was transported by truck i.e. approximately 17.85 million tonnes. In the same year, 459 million tonnes of goods were transported by road freight in the Czech Republic, of which 159 million tonnes were natural raw minerals (CZSO 2021). When considering transporting timber from a roadside landing to various destinations, we usually choose a logging truck or a truck with a trailer (Fig. 1) based on its size and load capacity, the commodity being transported, and the technical parameters of the roads used (Allman et al. 2021). A qualified (i.e. possessing the legally required documents that declare their ability to operate the vehicle and its devices) and experienced driver (i.e. those with a developed awareness who can predict and react appropriately to the road conditions) is required for operating such a vehicle. Truck drivers are regularly exposed to different types of loading throughout their work. The loading affects their physical and mental states and, in turn, their work performance (Wasmund et al. 2002; Zużewicz et al. 2013). After long-term exposure, common types of health issues can develop. Stress, muscle loading, periods of intense focus and quick reactions are the key factors influencing a professional driver’s work. The workload intensity depends on the vehicle used, its mode of operation, the type of timber being transported, and the road parameters.
Scientists have shown a keen interest in the issue of professional truck drivers and their work conditions, as well as the stress load they experience. The studies published so far have mostly dealt with drivers’ working conditions (physical load caused by, for example, posture at the steering wheel, driver seat ergonomics, accessibility of control units and their positioning, vibrations, temperature, noise). These studies have focused on drivers’ work environment, workload, and work type from the physical perspective (Cardoso et al. 2017). They have also investigated the parameters of the driver’s seat and its required properties and quality (Cardoso et al. 2017, 2018; Fröhlich et al. 2018). The experiments carried out thus far have evaluated the impacts of driving, particularly the impact of vibrations on the drivers’ myoskeletal and cardiovascular systems. The ergonomics of the driver’s seat, namely its division into adjustable sections, positively impact the driver’s posture and peripheral circulation, decrease the risk of cramp, and reduce the pressure in the sagittal plane, thus reducing discomfort (Cardoso et al. 2017). Research has also focused on the uneven distribution of working time (long-distance routes, night driving, weekend shifts) (Lemke 2016; Hege et al. 2017), work away from home (transcontinental and international transport), irregular family time (Alterman et al. 2013; Krieger 2010; Landsbergis 2010), fatigue (Dahlgren et al. 2016; Mellner et al. 2016), stress load related to shift work and the significant work-life imbalance (Apostolopoulos 2016; Marmot 2015; Ahonen et al. 2018; Landsbergis 2014).
Research results presented from these studies have shown the impact of social, family and economic factors on the intensity of mental stress, affecting truck drivers’ performance. Puttonen (2010) claimed that the combination of excessive work requirements and work-related stress is associated with poorer sleep (both its duration and quality) due to inadequate work-life balance or recovery time. Prolonged work shifts lead to increased stress, conflict with personal life and decreased sleep quality. Truck drivers frequently work such prolonged shifts, are under strict deadlines for goods transport, work under stressful conditions and are subject to irregular work and sleep patterns (Hege et al. 2019). Extended work shifts lead to higher work stress, conflicts between work and private life and reduced sleep quality. Statistical analyses of accidents indicate that there are good reasons to consider fatigue as one of the common causes of road accidents (McDonald 1984; Haworth 1989; Åkerstedt 1995; Zuzewicz 2013). Fatigue can result from excessive loading due to static work and mental loading (overload or monotony) (Davson 2001). Lack of alertness results from several factors, namely inattentiveness, drowsiness and fatigue-related mistakes (Bekiaris 2001).
The effect of mental loading on the musculoskeletal system can be observed in work carried out using a relatively low force while undertaking monotonous and repetitive tasks (Bongers 2002; Van Galen 2002), which is true particularly for continuous driving. Any given set of work conditions affects the quality of work performance. Monitoring and evaluating workload can be achieved using methods based on subjective perceptions e.g. surveying the target driver groups with a questionnaire focused on visual loading generated when drivers monitored an area surrounding the vehicle, and dealt with noise and vibration, over a long period (Chen et al. 2015). Another approach is to process recorded changes in the physiological parameters of the drivers e.g. evaluate visual loading based on the speed of response to a change in the situation while factoring in the length or intensity of the visual stimuli. Simultaneous application of both methods is also an option e.g. comparing the description of the subjective perception of the visual load with the measured speed of response to the visual stimulus (Chen et al. 2015). Monitoring the changes in physiological functions can be carried out using invasive methods, requiring medical personnel , or non-invasive body surface scanning, currently the preferred method. Historically, research has focused on the feasibility of automated stress recognition based on recorded signals (e.g. electrocardiography (EKG), electromyography (EMG), galvanic skin response (GSR), and heart rate (HR)). For example, EMG can be sampled at a frequency of 15.5 Hz after the first pass through an averaging filter for 0.5 s. A built-in computer then collects the signals in the vehicle (Chen et al. 2015). The main advantage of multi-dimensional measurement models is that they address several issues, improving doctors’ treatment of patients (Zheng et al. 2015). The concept of interactions between physiological signals must therefore be well-formulated and analysed. In this context, a strategy needs to be developed to analyse interactions between biomedical signals to devise the proper diagnostic approach (Li and Chung 2013).
Our study aimed to compare the muscle loading of timber truck drivers, driving with or without a trailer, by measuring EMG and the changes in heart rate, from which we derived the stress intensity. We observed the relationship between the physiological variables (EMG and heart rate) and length of experience, body height and body weight of the drivers, and the type of vehicle being operated. The difficulty of driving a logging truck with or without a trailer during the work was compared to the muscle loading whilst driving a passenger car in identical situations.
2 Material and methods
Data were gathered by observing the workload of seven truck drivers during their work shifts. All the truck drivers worked in similar working conditions (e.g. route, location, weather type). However, because this was a field study, we could not ensure that conditions were identical (e.g. the ambient air pressure or the ambient illumination inside the cabs of the vehicles could have fluctuated slightly throughout the study). To quantify the workload of the truck drivers, we observed the changes in the action potentials of their musculus extensor carpi radialis brevis muscles using electromyography and changes in heart rate using photoplethysmography on the drivers’ extremities. The research was carried out on land belonging to the University forest enterprise of the Czech University of Life Sciences Prague, University forest enterprise of the Mendel University in Brno, and commercial forests owned by Countess Stenberg, located in the Eastern Bohemia region. The experimental measurements of stress loading took place between October 2019 and February 2021. For the experiment, truck drivers aged between 46 and 54 years, with 5–25 years of truck driving experience, were selected. The health status of the truck drivers was, at the least good, meaning they were not on permanent medication. The latter criterion was applied to prevent the possible pharmacological impact of medication on the drivers’ physiological functions. All of these indicators were determined from a questionnaire survey of drivers.
Tatra 815 (Fig. 1A), Tatra Phoenix I Generation (Fig. 1C), and Tatra Phoenix II Generation (Fig. 1B and 1D) trucks modified for timber trucking were used in the experiment. The vehicles were configured as logging trucks without trailers, trailer trucks, and semitrailer trucks. The reference passenger car (a Toyota ProAce, model 2019) was occupied by the driver and the researcher who carried out the measurements. All vehicles were equipped with ergonomic driver’s seats with a high backrest, integrated headrest, air-cushioned, and adjustable both longitudinally and for height. The passenger car was equipped with an ergonomically shaped seat with a high backrest and an integrated headrest, with both height and length adjustable. All vehicles had manual transmission, and the engine power ranged from 325 kW for the Tatra 815, and 340 kW for the Tatra Phoenix I (used both as a truck, and a truck and trailer combination, with a two-axle trailer), to 390 kW for the Tatra Phoenix II. All Tatra vehicles used in the experiment had all axles driven in a 6 × 6 scheme. The technical parameters of the used vehicles are listed in Table 1.
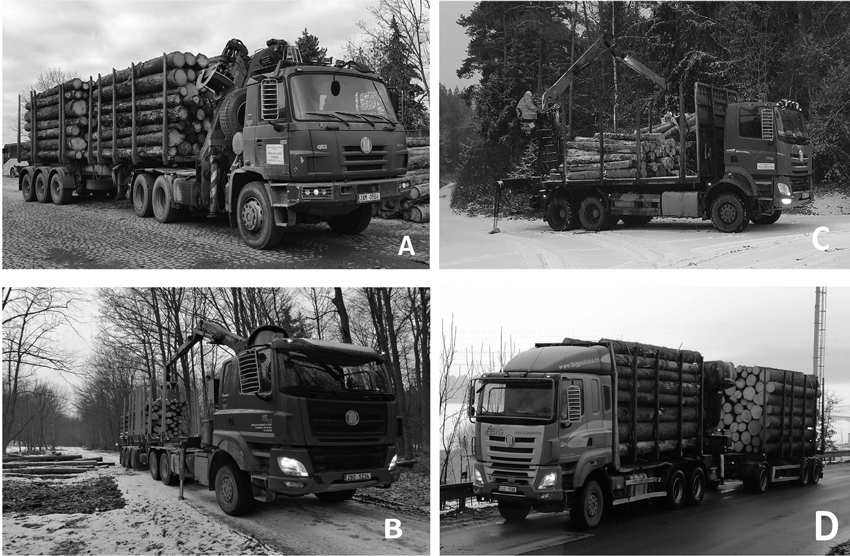
Fig. 1. Vehicles used in the experiment to evaluate the load environment of truck drivers. From top left A. Tatra 815, C. Tatra Phoenix I and down B. and D. Tatra Phoenix II.
| Table 1. Overview of the trucks’ technical parameters related to the truck drivers’ work environment. | |||||||||||
| Driving vehicle | Type of vehicle | Vehicle length / m | Vehicle weight / t | Load weight / t | Trailer length / m | Trailer weight / t | Load weight / t | Semi-trailer length / m | Semi-trailer weight / t | Load weight / t | Total length / m |
| Tatra 815 | truck with semi-trailer | 7.60 | 14.20 | 11.38 | 6.27 | 19.53 | 16.25 | ||||
| Tatra 815 | truck with trailer | 9.75 | 16.20 | 8.50 | 8.15 | 3.80 | 11.00 | 17.65 | |||
| Tatra Phoenix I | truck | 9.78 | 17.50 | 8.50 | 9.78 | ||||||
| Tatra Phoenix I | truck with trailer | 9.78 | 16.50 | 8.50 | 8.23 | 3.80 | 10.7 | 17.80 | |||
| Tatra Phoenix II | truck with semi-trailer | 8.06 | 14.94 | 11.23 | 7.27 | 17.79 | 16.45 | ||||
During the experiment, operators covered the same, predetermined routes to ensure comparability. The drivers carried out standard work operations, including loading and unloading of timber. The routes included standard forest and other road classes found in the Czech Republic, particularly paved forest roads of type 1L or 2L (year-round maintained forest roads with a solid surface and a width of 4 metres). Roads used outside of forests were third-class roads (intended for interconnection of municipalities or their connection to higher class roads), and sometimes poor-quality second-class roads, which ran through the landscape along the historical divisions between land estates. During work shifts, all potential risk situations were monitored, marked in the database, recorded on the route (GPS coordinates and photographic evidence) and compared with biosignals measured during the operation of the vehicle.
Recordings of critical situations were marked by the researcher during measurements in the vehicle. The researcher also recorded GPS coordinates and photographed the situation. The merging of the various data sources was based on time coordinates. The measurements took place in different seasons over 21 days (i.e. 21 measured cycles) and lasted at least six hours per shift. They included work operations carried out during a work shift, from the moment of starting the vehicle (when muscle load measurements were started), to arriving at the roadside landing, driving along forest roads, exiting to a regular road, transporting timber to the log yard, and returning to the roadside landing or parking the vehicle when the work shift was over. All drivers worked non-standard day shifts between 5 a.m. and 1 p.m. The average weight of the transported load of timber was 18.7 tonnes. The average driving distance was 23.6 km. Each of the vehicles was the subject of measurements in repeated measuring cycles. Data collected at the beginning, middle and end of work shifts were used in the evaluation. Reference measurements were carried out every day actual measurements were made in similar conditions (clear or semi-clear weather without rain and wind) at similar temperatures as to when the trucks were driven (between 10 and –5 °C). Values obtained from measuring the EMG of the radial extensor muscle at the wrist joint (musculus extensor carpi radialis) were compared in relation to the vehicle used – logging truck without a trailer, truck and trailer combination and the passenger car – and to the route covered.
To monitor the physiological loading during work, we used a Biofeedback x-pert 2000 device (Schuhfried AT 2004), a multi-media system consisting of modules which monitor and record physiological functions. The device enabled continuous monitoring of drivers over their work shifts using non-invasive scanning of biosignals from the body’s surface. The system is designed not only for physiological function diagnostics but has therapeutical applications (biofeedback) as well (Škvor 2018). Changes in biosignals were recorded with Ag+ electrodes (EMG module) and a heart rate sensor (MULTI module) and then transmitted to radio modules. All measurements were made according to the methodologies established by the Biofeedback device supplier to guarantee transparency and comparability of data with other measurements.
Before starting measurements, the measuring unit’s electrodes were carefully attached to the driver’s body. Incorrect application of the electrodes would have resulted in incorrect EMG readings. Prior to attaching the electrodes, the correct placement of the electrodes was verified directly on the forearm by locating the individual sections of the working muscle by touch and marking them with a non-toxic marker. The centres of the electrodes were then attached to the marked points (Škvor 2020).
The EMG module required a disposable electrode to be first attached to the muscle belly (venter musculi – the largest part of the muscle) as a reference prior to attaching both measuring electrodes at equal distances from the reference electrode at both ends of the muscle in the area of fascial tissue. The reference and measuring electrodes were connected to the EMG module by a cable. The MULTI sensor was attached to the distal phalanx of the middle finger of the right hand. Its cable was attached to the medial phalanx of the finger or to the wrist. The key point at this stage was the precise placement of the sensors, and a firm and stable connection to the measuring sensors.
During driving, drivers predicted and assessed the situation on the roads based on the current conditions and their existing experience. They adjusted their driving mode to the road surface and surrounding conditions well ahead, considering load weight and vehicle dimensions. Each work operation was coordinated, and tasks following each other were adjusted to the requirements of any given scenario. Loading intensity was not visually apparent and could be evaluated only based on measured values.
Field measurements provided a total of 15 407 356 measured biosignals. Of this dataset, 3 851 839 readings represented muscle load. Out of the total number of muscle load measurements, 1 139 772 readings represented muscle load in logging trucks, 1 263 608 in trucks and trailers, and 1 448 459 represented muscle load when driving a passenger car. The measurements of muscle load took place at a frequency of 50 Hz.
The experimentally obtained data were aggregated using the Schuhfried software (a software suite used to manage the measurements by the Biofeedback x-pert 2000 device data recording, storage and processing). Prior to further data processing, visual checks of the graphic outputs were carried out to ensure that no signal outages had occurred during measurements. Individual measurements were then assigned to individual drivers, stages of work shifts, type of vehicle, and the real routes taken. The measured data were sorted and the normality of the data distribution was visually checked using a histogram. The measured data were then processed in STATISTICA CZ software, version 12, developed by TIBCO Software, Inc. using basic statistical operations. Descriptive statistics were calculated using basic statistical operations. The data thus checked were subjected to analysis of variance (ANOVA). The measured values of drivers’ muscle load in different types of vehicles used for transporting timber were compared for the same routes and climate.
3 Results
The muscle loading values measured for each driver showed differences in muscular tensions while driving particular vehicles and on different road classes. A higher workload was observed when driving logging trucks or trucks with trailers, compared to driving a passenger car (Table 2). Dark shading represents routes covered predominantly on second and third-class roads (over 60%). The light shading represents predominant driving on forest roads 1L and 2L (over 60%). We compared the muscle loading associated with driving a loaded logging truck to driving a passenger car, and determined that operating a logging truck increased the muscle tension of the drivers by 19.6% compared to driving a passenger car. Driving a logging truck with a trailer produced muscular loading 46.5% higher than that associated with driving a passenger car. Driving a logging truck with a trailer resulted in muscular loading 22.5% higher than driving logging trucks without a trailer attached.
| Table 2. Muscle loading whilst driving a particular vehicle type at a particular point in a shift, and workdays. | |||
| Measuring cycle | Type of vehicle used | ||
| Logging truck with trailer | Logging truck | Passenger car | |
| % | |||
| Measuring cycle No. 1 | 170.8 | 101.0 | 100.0 |
| Measuring cycle No. 2 | 136.6 | 119.2 | 100.0 |
| Measuring cycle No. 3 | 136.7 | 119.2 | 100.0 |
| Measuring cycle No. 4 | 149.0 | 136.1 | 100.0 |
| Measuring cycle No. 5 | 151.9 | 101.4 | 100.0 |
| Measuring cycle No. 6 | 141.9 | 116.8 | 100.0 |
| Measuring cycle No. 7 | 147.1 | 121.0 | 100.0 |
| Measuring cycle No. 8 | 143.9 | 131.2 | 100.0 |
| Measuring cycle No. 9 | 146.4 | 144.3 | 100.0 |
| Measuring cycle No. 10 | 168.2 | 100.2 | 100.0 |
| Measuring cycle No. 11 | 138.9 | 121.1 | 100.0 |
| Measuring cycle No. 12 | 135.9 | 117.2 | 100.0 |
| Measuring cycle No. 13 | 149.8 | 135.8 | 100.0 |
| Measuring cycle No. 14 | 153.2 | 100.5 | 100.0 |
| Measuring cycle No. 15 | 142.5 | 117.6 | 100.0 |
| Measuring cycle No. 16 | 144.3 | 119.0 | 100.0 |
| Measuring cycle No. 17 | 156.1 | 128.1 | 100.0 |
| Measuring cycle No. 18 | 138.5 | 118.7 | 100.0 |
| Measuring cycle No. 19 | 134.2 | 121.6 | 100.0 |
| Measuring cycle No. 20 | 151.4 | 118.4 | 100.0 |
| Measuring cycle No. 21 | 140.5 | 123.7 | 100.0 |
| The table shows the differences in the muscle load of drivers when driving different types of vehicles in each measurement cycle. Routes using a significant proportion of roads class II and class III (over 60%) are marked with a dark background, routes using a significant proportion of driving distances on forest roads 1L and 2L (over 60%) are marked with a light background. | |||
Table 3 shows the observed differences in muscle load when driving the compared types of vehicles on forest roads and on lower class roads. Driving on forest roads caused an increase in the drivers’ muscular loading. Muscular loading increased 21.1% when driving a logging truck compared to a passenger car, 41.2% when driving a logging truck with trailer compared to a passenger car, and 16.6% when driving a logging truck with trailer compared to a logging truck. Driving on lower-class roads outside of the forest also caused an increase in the drivers’ muscular loading. Muscular loading increased 4.3% when driving a logging truck compared to a passenger car, 59.1% when driving a logging truck with trailer compared to a passenger, and 52.5% when driving a logging truck with trailer compared to a logging truck.
| Table 3. Differentiated relative comparison of muscle loading when driving a vehicle type according to road type. | ||||||
| Type of vehicle | Relative muscle load compared to a car | |||||
| Total in % | Purpose-built roads 1L and 2L in % | On roads class II and III in % | ||||
| Logging truck with trailer | 146.5 | 122.5 | 141.2 | 116.6 | 159.1 | 152.5 |
| Logging truck | 119.6 | 121.1 | 104.3 | |||
| Passenger car | 100.0 | 100.0 | 100.0 | |||
| The table shows the differences in the muscle load of drivers when driving different types of vehicles on different types of roads used in the experiment. Routes using a significant proportion of roads class II and class III (over 60%) are marked with a dark background, routes using a significant proportion of driving distances on forest roads 1L and 2L (over 60%) are marked with a light background. | ||||||
Fig. 2 shows an example of mental and physical load, depicting the reactions of a driver to controlling and operating the vehicle on a forest road and a regular road. Driving a logging truck with a trailer initially took place on a third-class road (0:00–2:30), followed by a very narrow, slightly sloped bituminous forest road with broken edges covered with fresh snow. On the way up, the wheels sometimes slipped on the icy road, presenting a hazardous situation (at 6:00 and 6:30). Fig. 3 provides a graphic comparison of differences in drivers’ muscle loading in relation to the type of vehicle used. Higher muscle loads were measured when using a logging truck with a trailer.
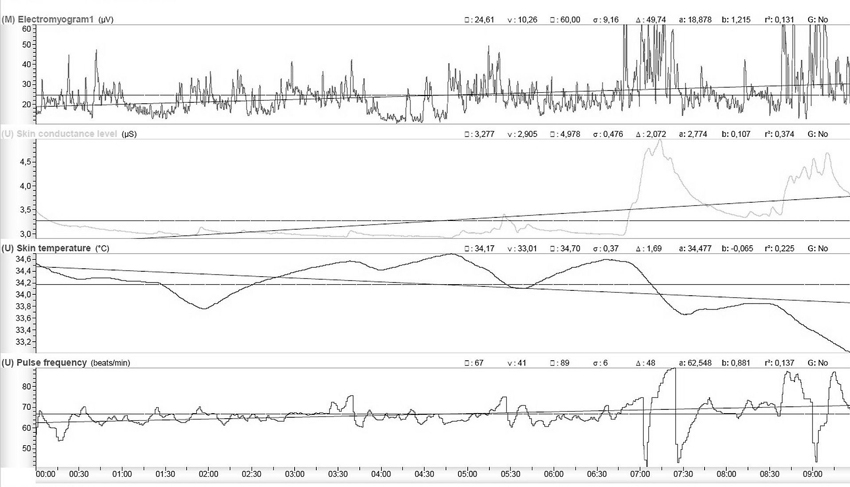
Fig. 2. Example record obtained physiological biosignals from electromyogram (EMG), galvanic skin response (SCL) measured on the hands, body temperature measured peripherally (ST) and heart rate (PF) - Example from measuring cycle No. 12. View larger in new window/tab.
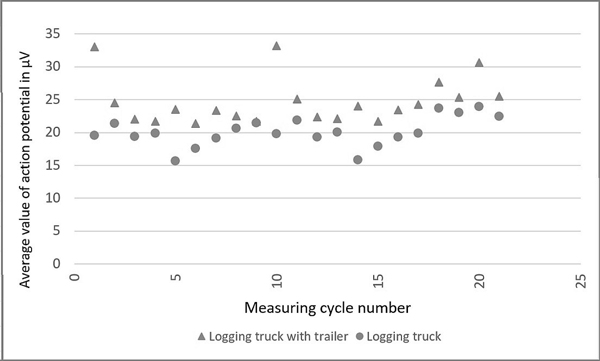
Fig. 3. Comparison of the course of the change in muscle load expressed in μV of electric potential in order of working routes when driving a timber truck with trailer and a logging truck without trailer.
Analysis of variance (ANOVA) of the dependence of the values of muscle load on the type of vehicle used (Fig. 4a) revealed noticeable differences. For logging trucks with trailers, muscle loading ranged between 24.2 μV and 25.6 μV, for logging trucks without trailers between 19.6 μV and 21.0 μV, and for reference measurements in a passenger car between 17.5 μV and 18.8 μV. The analysis of variance of the dependence of heart rate on the type of vehicle used (Fig. 4b) revealed similar results. For logging trucks with trailers, the number of beats per minute ranged between 90.3 and 92.0, for logging trucks without trailers between 85.4 and 87.0, and for the passenger car between 82.3 and 84.9. Analysing the results showed that muscle loading was high while driving logging trucks with trailers. The impact of vehicle type on muscle loading and heart rate (Table 4) was statistically significant (p-value 0.00).
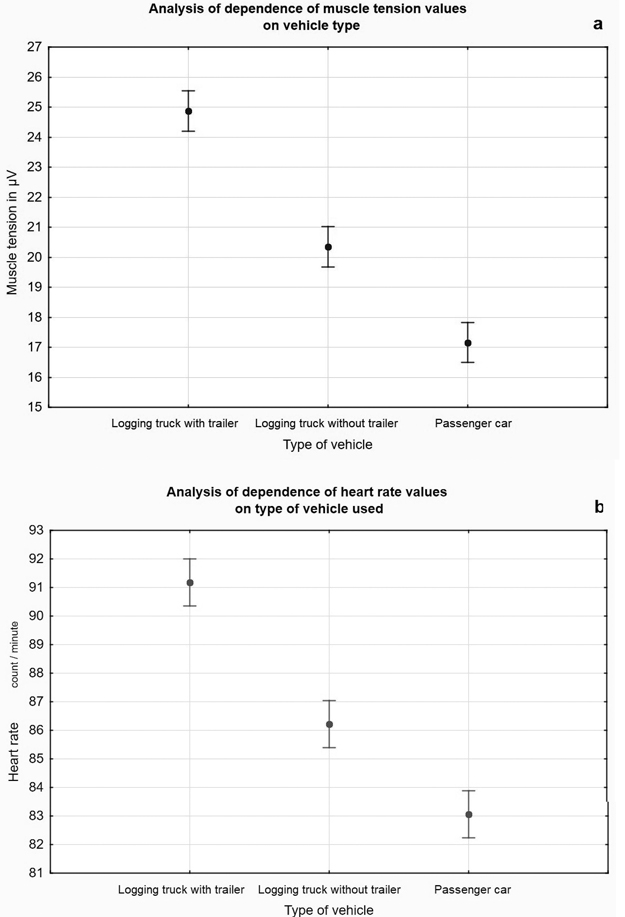
Fig. 4. Analysis of variance of dependence of values of muscle load (a) and heart rate (b) on type of vehicle used. Driving a logging truck with trailer increases muscle strain by approximately 22% and heart rate by approximately 6% compared to driving a logging truck. The average and limit values for the monitored vehicle types are displayed. The variance of the limits of measured values is ±2.8% for both muscle load and heart rate.
| Table 4. Analysis of variance of values of the dependence of muscle load and heart rate on the type of vehicle used, on the number of years’ experience, on body height, on the body weight and on the phase of the work shift. Gray text indicates statistical significance. | ||||||
| Effect | Sum of squares | Degrees of freedom | Meansquare | F-value | p-level of significance | |
| Type of vehicle | EMG | |||||
| Intercept | 81692.88 | 1 | 81692.88 | 11320.67 | 0.00 | |
| Type of vehicle | 1891.67 | 2 | 945.83 | 131.07 | 0.00 | |
| Error | 1342.22 | 186 | 7.22 | |||
| HEART RATE | ||||||
| Intercept | 1424631 | 1 | 1424631 | 130166.3 | 0.00 | |
| Type of vehicle | 2106 | 2 | 1053 | 96.2 | 0.00 | |
| Error | 2036 | 186 | 11 | |||
| Number of years‘ experience | EMG | |||||
| Intercept | 75885.56 | 1 | 75885.56 | 4699.469 | 0.00 | |
| Number of years’ experience | 262.72 | 4 | 65.68 | 4.067 | 0.003 | |
| Error | 2971.17 | 184 | 16.15 | |||
| HEART RATE | ||||||
| Intercept | 1297780 | 1 | 1297780 | 59923.58 | 0.00 | |
| Number of years’ experience | 157 | 4 | 39 | 1.81 | 0.128 | |
| Error | 3985 | 184 | 22 | |||
| Body height | EMG | |||||
| Intercept | 66450.07 | 1 | 66450.07 | 3991.386 | 0.00 | |
| Body height | 153.94 | 3 | 51.31 | 3.082 | 0.028 | |
| Error | 3079.95 | 185 | 16.65 | |||
| HEART RATE | ||||||
| Intercept | 1162537 | 1 | 1162537 | 53869.32 | 0.00 | |
| Body height | 149 | 3 | 50 | 2.31 | 0.078 | |
| Error | 3992 | 185 | 22 | |||
| Body weight | EMG | |||||
| Intercept | 75885.56 | 1 | 75885.56 | 4699.469 | 0.00 | |
| Body weight | 262.72 | 4 | 65.68 | 4.067 | 0.003 | |
| Error | 2971.17 | 184 | 16.15 | |||
| HEART RATE | ||||||
| Intercept | 1297780 | 1 | 1297780 | 59923.58 | 0.00 | |
| Body weight | 157 | 4 | 39 | 1.81 | 0.128 | |
| Error | 3985 | 184 | 22 | |||
| The driver’s muscle load is statistically significantly influenced by the type of vehicle used – especially its length and also the number of years of experience, but with regard to physical age. Body height, body weight and shift phase do not have a statistically significant effect on muscle load and heart rate. | ||||||
Analysis of variance of muscle load based on number of years’ experience (Fig. 5a) showed clear differences, with muscle tension decreasing over five, eight, and 12 years and then slowly increasing with age (Table 4, Table 5). Similarly, the heart rate was also affected by the experience of the drivers (Fig. 5b). The impact of number of years’ experience on heart rate was not significant.
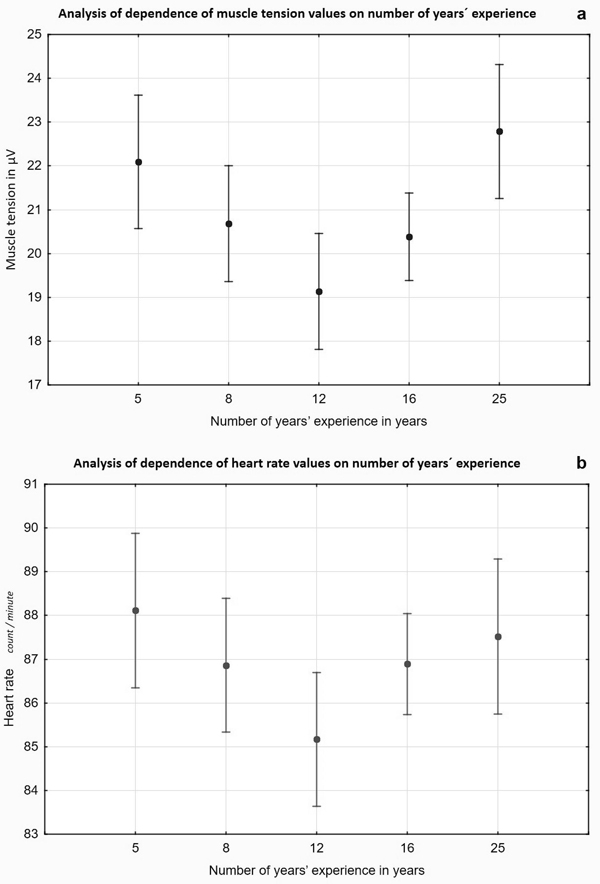
Fig. 5. Analysis of variance of dependence of values of muscle load (a) and heart rate (b) on number of years’ experience. The number of years’ experience significantly reduces muscle load and heart rate, but only until the moment when the effect of long-term hard work on the organism begins to manifest itself and subsequently the physical and mental load on the organism increases, up to the level of load with little years’ experience. The average and limit values for the monitored number of years’ experience displayed. Differences in muscle load range in the variance of the average values are up to 18% (the variance of the limits of measured values is ±6.8%); for heart rate, the variance is up to 3.6% (the variance of the limits of measured values is ±2.1%).
| Table 5. Post-hoc test to analyse the variance of values of the dependence of muscle load values on the number of years’ experience, the driver’s height and the driver’s body weight. Gray numbers indicates statistical significance. | ||||||
| Scheffe‘s test; EMG variable Probabilities for post-hoc tests Error: intermediate. SS = 16.148, AS = 184.00 | ||||||
| Number of years’ experience | 5 | 8 | 12 | 16 | 25 | |
| Number of years’ experience | 5 | |||||
| 8 | 0.752 | |||||
| 12 | 0.083 | 0.617 | ||||
| 16 | 0.494 | 0.998 | 0.694 | |||
| 25 | 0.982 | 0.377 | 0.014 | 0.155 | ||
| Body height | 171 | 176 | 178 | 182 | ||
| Body height | 171 | |||||
| 176 | 0.604 | |||||
| 178 | 0.749 | 0.963 | ||||
| 182 | 0.046 | 0.463 | 0.115 | |||
| Body weight | 72 | 87 | 89 | 93 | 94 | |
| Body weight | 72 | |||||
| 87 | 0.752 | |||||
| 89 | 0.083 | 0.617 | ||||
| 93 | 0.982 | 0.377 | 0.014 | |||
| 94 | 0.494 | 0.998 | 0.694 | 0.155 | ||
| The measured values for the individual monitored parameters were compared in the groups of the number of years of experience, body height and body weight of the driver. | ||||||
The dependence of muscle load on drivers’ height (Fig. 6a) showed a significant difference in muscle tension (Table 4), even though the height of the drivers was within a relatively small range of 11 cm. The highest variance in muscle loading and heart rate was monitored in a driver with the smallest height of 171 cm. The increased muscle loading was likely the result of the anthropometric dimensions of the given driver, in relation to the ergonomic layout of the vehicle’s controls. The results showed a similar distribution when drivers’ heart rates were considered (Fig. 6b), though the differences were not significant (Table 4).
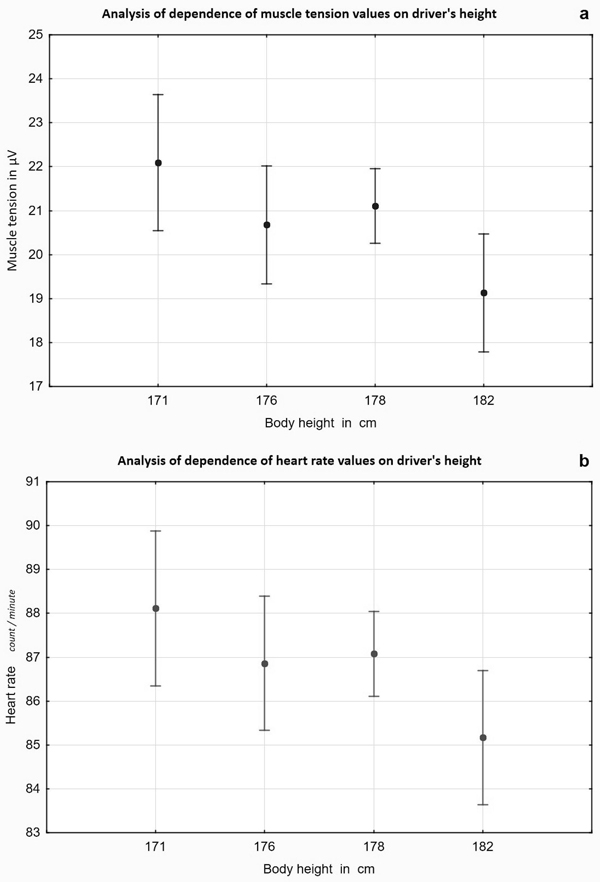
Fig. 6. Analysis of variance of dependence of values of muscle load (a) and heart rate (b) on height of operator. The dependence of muscle load and heart rate on body height is related to the relationship between body height and workplace ergonomics. A shorter driver will expend more energy reaching for controls and steering. The average and limit values for the monitored body heights displayed. Differences in muscle load range in the variance of the average values are up to 15% (the variance of the limits of measured values is ±6.6%); for heart rate, the variance is up to 3.6% (the variance of the limits of measured values is ±1.7%).
Analysis of variance between muscle load and drivers’ weight (Fig. 7a) showed a significant difference in muscle tension (Table 4), particularly between 89 and 93 kg (Table 5). Unlike height, the range in weight of the monitored drivers was relatively wide – 22 kg. Analysis of variance of dependence of heart rate on drivers’ weight (Fig. 7b) yielded a similar distribution of results, though the differences were not significant. The highest variance of muscle load and heart rate was found in a driver with the lowest weight of 72 kg. Similarly, his mean heart rate was the highest and his muscle loading was the second highest. The values measured correspond to the interaction between the ergonomics of the workplace and the driver’s weight. Larger weights of individual body parts likely decreased the energy expended during downward movements. On the other hand, more energy was required for movements in the opposite direction.
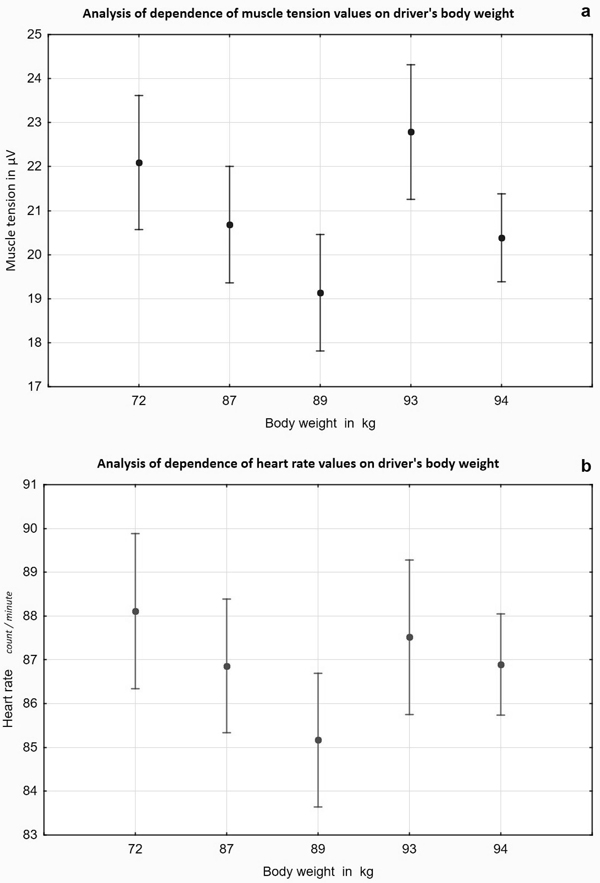
Fig. 7. Analysis of variance of dependence of values of muscle load (a) and heart rate (b) on weight of operator. The dependence of muscle load and heart rate on body weight is related to the relationship between body weight and workplace ergonomics. The lower weight of the driver increases their physical workload when controlling the vehicle i.e. the need to use more force to control the vehicle. The average and limit values for the monitored body weights displayed. Differences in muscle load range in the variance of the average values are up to 15.2% (the variance of the limits of measured values is ±7.3%); for heart rate, the variance is up to 3.6% (the variance of the limits of measured values is ±1.9%).
Analysis of variance of the dependence of muscle load at different stages of work shifts (Fig. 8a) showed that the differences between muscle loading during the shifts were not significant. The highest variance of measured muscle loading was found in the first two stages of the work shift, showing an upward trend. The end of a shift showed lower muscle loading, likely caused by the distribution of the tasks throughout the work shifts – the more demanding tasks were regularly carried out at the beginning of the shifts. A similar distribution of results was seen for the analysis of variance of the heart rates of the drivers on a given work shift stage (Fig. 8b). The variance of heart rate was also higher in the first two stages of the work shifts, with an upward trend (Table 4). As with the muscle loading results, the differences were not significant.
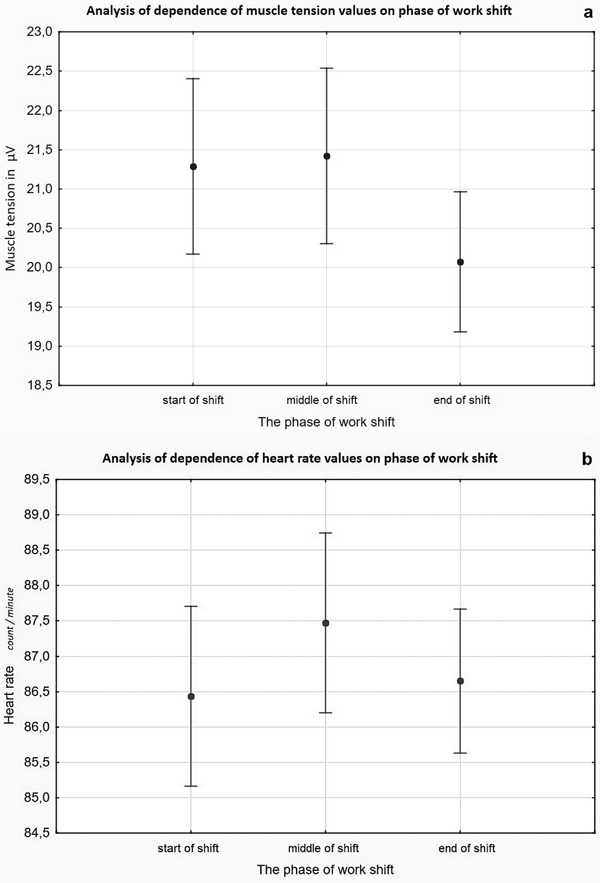
Fig. 8. Analysis of variance of dependence of values of muscle load (a) and heart rate (b) on phase of work shift. The dependence of muscle load and heart rate on the phase of the work shift did not show significant differences in load. The average and limit values for the monitored phases of work shift displayed. Differences in muscle load range in the variance of the average values are up to 6.4% (the variance of the limits of measured values is ±5.4%); for heart rate, the variance is up to 1.2% (the variance of the limits of measured values is ±1.5%). The middle part of the work shift, when work performance is at full capacity, shows the expected highest load. The loads at the beginning and at the end of the shift were lower because, at these times, empty vehicles were moved to the pick-up points or the empty vehicle was returned from the dispatch warehouse to the parking area.
4 Discussion
Several studies have focused on methods of objective monitoring of the current stress load and the possible practical applications of the results (Barfield and Dingus 1998; Vicente et al. 2016). Evaluating drivers’ workload using physiological parameters provides valuable information (Berntson et al. 1991). For example, one study focused on monitoring the electromyographic activity of the driver’s back muscles when sitting in a seat without lumbar support, a risk factor for lower back pain (Makhsous et al. 2006). On the other hand, research has indicated that a single parameter, such as heart rate, is insufficient for monitoring the dependence of physiological changes in an organism.
Professional publications have listed several effective methods for monitoring driver behavioural patterns and mental states. These approaches can be summarized as contact measurements extracted from physiological signals (Healey and Picard 2005; Lee and Chung 2012; Li and Chung 2013; Correa et al. 2014; Chen et al. 2015; Zheng et al. 2015; Fu et al. 2016; Vicente et al. 2016; Chen et al. 2017). The popularity of modern methods that use physiological signal analyses has increased, due to the high accuracy with which they can detect such signals. The use of these methods has been enhanced by developments in instrumentation and software, allowing researchers to move laboratory research into the field, with improved noise suppression and considerations of the interpersonal variability of participants. According to Vicente et al. (2016) and Zheng et al. (2015), analyses of data obtained through measurements of physiological (bio)signals that detect changes in driver status can also be applied in research focusing on drivers’ stress load. All these results may be used to develop suitable regulatory frameworks for occupational health and safety.
In our study, the data were gathered from surface electrodes attached to the forearm. Their use has been verified theoretically, the method has several advantages (Basmajian and De Luca 1985), and has often been implemented in practical situations (Westgaard 1988; Grieco et al. 1989; Sundelin and Hagberg 1992). Preparation of the skin and correct electrode placement are vital to achieving accurate biosignal readings. On the other hand, a drawback of using surface electrodes is that their position can change due to the physical movement of the skin over the working muscle. Therefore, more accurate results can be obtained by intramuscular wire electrodes, as used in clinical research (Duque et al. 1995). The downside is that the intramuscular electrodes are cumbersome for use in field studies. In our study, the drivers retained the horizontal position of their forearm during our experiments, so the inaccuracies resulting from the sliding of the skin from muscles were relatively small and their effects on the validity of the study were limited.
Our study expands on the studies that use measurements of bioindicators to observe the workload of forest harvester operators (Macků and Dvořák 2011; Jankovský et al. 2013, 2018; Škvor 2018) and forwarder operators (Škvor 2020) to making observations of logging truck drivers. Similar studies have been carried out for long-distance transportation of goods (long and time-consuming journeys, mostly on motorways) (Hege et al. 2019) and for the transport of goods by smaller vans (short routes, mostly in urban areas) (Romeo et al. 2018). Hege et al. (2019) stated that 62.6% of drivers had a moderate or high stress level. We discovered that timber trucking is also physically and mentally demanding. Driving a logging truck resulted in muscle loading that was almost one fifth higher than driving a passenger car, while driving a logging truck with a trailer increased the muscle loading by almost one half compared to driving a passenger car. Analysis of variance revealed that the drivers’ muscular and mental loading were significantly affected by the type of vehicle they drove.
The results showed that drivers were under significantly greater mental loading while driving a truck equipped with a trailer than when they drove logging trucks without a trailer. The drivers had to monitor the track of the last axle at all times, consequently adjusting the speed and cornering while predicting the presence of an oncoming vehicle of similar dimensions. The muscle tensions and heart rates observed while driving on forest roads were similar for all vehicle types, though the expected loading rating was observed to increase from the least demanding (passenger car) to the most demanding (logging truck with a trailer). However, when driving outside of the forest, on second and third-class roads, the difficulty level of operating a logging truck with a trailer increased sharply. Driving such vehicles through municipalities, where roads followed the original unpaved roads built for horse-drawn carriages and pedestrians, was significantly more demanding. Around curves surrounded by houses in built-up areas, passenger cars and logging trucks drove with relative ease. Conversely, when logging trucks with trailers drove there, the drivers had to slow down considerably and stay alert for the possible presence of oncoming vehicles while guiding the trailer in the opposite direction to keep its last axle within the road boundaries. The width and radii of curves, especially in built-up areas, required more frequent braking and downshifting, followed by accelerating and shifting to higher gears, thus increasing muscle loading. Driving logging trucks with trailers through such sections of road was significantly more physically and mentally demanding than driving shorter, lighter vehicles. Abdelkareem et al. (2018) reached a similar conclusion in their study assessing the impact of vibrations on drivers’ comfort.
Experimental measurements in an operating environment revealed that muscle tension in individual muscle groups responded to the specific stimuli, and its extent changed both in relation to the locomotor system loading and the person’s mental state. The response of the mental state to external stimuli was verified by the evaluation of heart rate variability. In more demanding conditions, such as travelling on narrow forest roads lined with deep ditches, in freezing temperatures, or through historic villages, the truck drivers’ muscle loading and heart rate increased significantly. However, the mental and muscular loading, especially for more demanding tasks or operations, was lower for more experienced drivers. Our findings are similar to those of Dvořák et al. (2008), who found an increase in the efficiency of movements by up to 57%.
Due to the nature of their profession, which combines moderate to strenuous physical work, drivers approached adjustments to their daily regime with utmost care. Our survey showed that they did not suffer from sleep disorders or insomnia. Their daily regime was stable and natural in relation to their circadian rhythms i.e. the drivers successfully adjusted their daily regimes to their body’s requirements. The requirement to start a work shift early, at around 5 a.m., was facilitated by adjusting bedtime to around 8 p.m. The desire to deal with stress using techniques such as legal stimulants was minimal. Their eating or work/rest habits (drinking regime, number of work breaks, including meal breaks) were in line with current standards for people who work 8-hour shifts. These findings are contrary to those of Hege et al. (2019), who reported that a substantial difference was found in drivers’ sleep length on working days (6.95 h) compared to non-working days (8.27 h). In addition to sleep duration, the drivers reported much better sleep quality on non-working days compared to working days. Specifically, 38.2% of the drivers reported that they never, or rarely, had a good night’s sleep on workdays, while only 16.7% did so on non-workdays. Delivery van drivers suffer similar problems (Romeo et al. 2018), though they notice stress not only during driving but also in a set of heterogeneous situations, such as handling parcels, handing the parcels over to customers, when working with computers for picking and payment, and in various urban area scenarios – on the street, sidewalk, in shops, on truck shop ramps, and parking lots. The study confirmed that for more than 75% of drivers, the risk of injury increases during the work shift due to non-standard demanding working conditions in the field.
A weakness of our research is the interplay of several circumstances we observed in the drivers’ group – the height of the smallest driver correlated with his weight and years of experience. In our observations of muscle loading and heart rate, we therefore stress that workload depends on the interaction between anthropometric parameters e.g. body height, and the ergonomics of a truck cab, designed to fit 90% of the population. When observing the relationship between the higher workload measured and the years of experience or body weight, we must state that the obtained results could be a false positive. The key factor, again, was the body height in the context of truck cab ergonomics.
5 Conclusions
In this study, we compared the workloads of professional logging truck drivers. The workload was high, particularly for drivers of trucks with trailers and was affected by the type of vehicle and the condition and class of road. Driver workload increased with vehicle weight and dimensions, with almost one-quarter higher muscle loading of the drivers while driving trucks with trailers than when driving pure trucks. As for road class, on lower-class roads outside of the forest, the muscle loading was over twice the average. The null hypothesis concerning the non-existence of differences between vehicle types with respect to the monitored variables was rejected. There were significant differences in the muscular and mental loading caused by driving individual types of timber transporting vehicles. We, therefore, recommend regular rotation of drivers to different types of vehicles or their rotation to other work types e.g. combining manual work in the log yard with timber trucking to prevent occupational neuromuscular diseases. That being said, this study needs to be followed by more extensive research, which would broaden the scope to other road types, include a more diverse array of drivers, vehicles or natural conditions to make the results more generalizable and applicable to regulatory changes.
Availability of research materials and data
Datasets generated and analysed for the current study are not publicly available due to confidentiality agreements between partners. These files contain sensitive personal data for the drivers participating in the experiment, who requested non-disclosure. Information and data of a non-personal nature are available upon request from the corresponding author (skvorp@fld.czu.cz).
Authors’ contributions
Conceptualization: Škvor, Jankovský, Dvořák, Natov; Formal analysis: Škvor, Jankovský; Funding acquisition: Škvor; Investigation and data collection: Škvor; Methodology: Škvor, Jankovský, Natov, Dvořák; Validation: Škvor, Jankovský, Dvořák; Writing-original draft: Škvor; Writing-review & editing: Škvor, Jankovský, Natov, Dvořák. All authors have read and agreed to the published version of the manuscript.
Funding
The research was funded by the author.
Acknowledgements
We would like to thank the Training Forest Enterprise in Kostelec nad Černými lesy of Czech University of Life Sciences Prague, Training Forest Enterprise Křtiny of Mendel University in Brno and the company SPRÁVA MAJETKU HS Ltd. owned by Diana Philipp Stenberg, all of whom kindly allowed us to collect data from their drivers.
References
Abdelkareem MAA, Makrahy A, Mostafa M, Abd-el-Tawwab M, Ali M (2018) An analytical study of the performance indices of articulated truck haulage rig during three different cases to improve the driver comfort. Proc Inst Mech Eng S J 232: 84–102. https://doi.org/10.1177/1464419317709895.
Ahonen E, Fujishiro K, Cunningham T, Flynn M (2018) Work as an inclusive part of population health inequities research and prevention. Am J Pub H 108: 306–311. https://doi.org/10.2105/AJPH.2017.304214.
Åkerstedt T (1995) Work hours and slippiness. Clin Neurophysiol 25: 367–375. https://doi.org/10.1016/0987-7053(96)84910-0.
Allman M, Dudakova Z, Jankovsky M, Merganic J (2021) Operational parameters of logging trucks working in mountainous terrains of the western Carpathians. Forests 12, article id 718. https://doi.org/10.3390/f12060718.
Alterman T, Luckhaupt S, Dahlhamer J, Ward B, Calvert G (2013) Job insecurity, work-family imbalance, and hostile work environment, prevalence data from the 2010 national health interview survey. Am J Ind Med 56: 660–669. https://doi.org/10.1002/ajim.22123.
Apostolopoulos Y, Lemke M, Hege A, Sonmez S, Sang H, Oberlin D, Wideman L (2016) Work and chronic disease: comparison of cardiometabolic risk markers between truck drivers and the general US population. J Occup Environ Med 58: 1098–1105. https://doi.org/10.1097/JOM.0000000000000867.
Barfield W, Dingus TA (1998) Human factors in intelligent transportation systems. Lawrence Erlbaum Associates. https://doi.org/10.4324/9781315806624.
Basmajian JV, De Luca CJ (1985) Muscle alive: Their functions revealed by electromyography. Williams & Wilkins.
Bekiaris E; Nikolau S (2001) State of the art on driver hypovigilance monitoring and warning systems. AWAKE system for effective assessment of driver vigilance and warning according to traffic risk estimations, IST-2000-28062.
Bernston G, Cacioppo JT, Quigley KS (1991) Autonomic determinism: the modes of autonomic control, the doctrine of autonomic space, and the laws of autonomic constraint. Psychol Rev 98: 459–487. https://doi.org/10.1037/0033-295X.98.4.459.
Bongers PM, Kremer AM (2002) Are psychosocial factors, risk factors for symptoms and signs of the shoulder, elbow, or hand/wrist? A review of the epidemiological literature. Am J Ind Med 41: 315–342. https://doi.org/10.1002/ajim.10050.
Cardoso M, McKinnon C, Viggiani D, Johnson MJ, Callaghan JP, Albert WJ (2017) Biomechanical investigation of prolonged driving in an ergonomically designed truck seat prototype. Ergonomics 61: 367–380. https://doi.org/10.1080/00140139.2017.1355070.
Cardoso M, Fulton F, Callghan J P, Johnson M, Albert W J (2018) A pre–post evaluation of fatigue, stress and vigilance amongst commercially licensed truck drivers performing a prolonged driving task. Int J Occup Saf Ergo 61: 129–136. https://doi.org/10.1080/10803548.2018.1491666.
Chen LL, Zhao Y, Ye PF, Zhang J, Zou JZ (2015) Detecting driving stress in physiological signals based on multimodal feature analysis and kernel classifiers. Expert Syst Appl 85: 279–291. https://doi.org/10.1016/j.eswa.2017.01.040.
Chen LL, Zhao Y, Zhang J, Zou JZ (2017) Automatic detection of alertness/drowsiness from physiological signals using wavelet-based nonlinear features and machine learning. Expert Syst Appl 42: 7344–7355. https://doi.org/10.1016/j.eswa.2015.05.028.
Correa A G, Orosco L, Laciar E (2014) Automatic detection of drowsiness in EEG records based on multimodal analysis. Med Eng Phys 36: 244–249. https://doi.org/10.1016/j.medengphy.2013.07.011.
Crain T, Hammer L, Bonder T, Olson R, Kossek E, Moen P, Buxton O (2019) Sustaining sleep: results from the randomized controlled work family and health study. J Occup Health Psych 24: 180–197. https://doi.org/10.1037/ocp0000122.
CSZO (2021) Statistical yearbook of the Czech Republic. Dryad [Dataset] https://www.czso.cz/csu/czso/statisticka-rocenka-ceske-republiky-lxnk9quszp. Accessed 14 May 2022.
Dahlgren A, Trucker P, Gustavsson P, Rudman A (2016) Quick returns and night work as predictors of sleep quality, fatigue, work-family balance and satisfaction with work hours. Chronobiol Int 33: 759–767. https://doi.org/10.3109/07420528.2016.1167725.
Davson D, Fletcher A (2001) A quantitative model of work-related fatigue, background and definition. Ergonomics 44: 144–163. https://doi.org/10.1080/00140130119399.
Duque J, Masset D, Malchaire J (1995) Evaluation of handgrip force from EMG measurements. Appl Ergon 26: 61–66. https://doi.org/10.1016/0003-6870(94)00003-H.
Dvořák J, Malkovský Z, Macků J (2008) Influence of human factor on the time of work stages of harvesters and crane-equipped forwaders. J For Sci 54: 24–30. https://doi.org/10.17221/790-JFS.
Fröhlich P, Sackl A, Trösterer S, Meschtscherjakov A, Diamond L, Tscheligi M (2018) Acceptance factors for future workplaces in highly automated trucks. Proceedings of the 10th International conference on automotive user interfaces and interactive vehicular applications, pp 129–136. https://doi.org/10.1145/3239060.3240446.
Fu R, Wang H, Zhao W (2016) Dynamic driver fatigue detection using hidden Markov model in real driving condition. Expert Syst Appl 63: 397–411. https://doi.org/10.1016/j.eswa.2016.06.042.
Germeys L, Leineweber C (2018) Divergent concurrent and lagged effects of the reciprocal relation between work-nonwork interactions and sleep disturbance. Sleep 42, article id 255. https://doi.org/10.1093/sleep/zsy255.
Grieco A, Ocehipinti E, Colombmi D, Menoni O, Bulgheroni M, Frigo C, Bneeardi S (1989) Muscular effort and musculoskeletal disorders in piano students: electromyographic, clinical and preventive aspects. Ergonomics 32: 697–716. https://doi.org/10.1080/00140138908966837.
Haworth NL, Heffernan CJ, Horne EJ (1989) Fatigue in truck accidents. Report no. 3. Victorian road freight industry council, Melbourne. ISBN 0-7326-0002-2.
Healey JA, Picard RW (2005) Detecting stress during real-world driving tasks using physiological sensors. IEEE T Intell Transp 6: 156–166. https://doi.org/10.1109/TITS.2005.848368.
Hege A, Lemke M, Apostolopoulos Y, Perko M, Sonmez S, Strack R (2017) Long-haul truck driver work organization and the association with cardiometabolic disease risk. Arch Environ Occup Health 72: 303–310. https://doi.org/10.1080/19338244.2016.1242468.
Hege A, Lemke M, Apostopoulos Y (2019) Work-life conflict among U.S. long-haul truck drivers: influences of work organization, perceived job stress, sleep, and organizational support. Int J Env Res Pub He 16, article id 984. https://doi.org/10.3390/ijerph16060984.
Holmgreen L, Tirone V, Gerhart J, Hobfoll S (2017) Conservation of resources theory. In: Cooper CL, Campbell Quick J (eds) The Handbook of stress and health: a guide to research and practice. Chapter 27. John Wiley & Sons Ltd, New York. https://doi.org/10.1002/9781118993811.ch27.
Jankovský M, Hnilica R, Dvořák J, Dado M, Natov P (2013) Utilization of Biofeedback devices in determination of learning curves of harvester operations. ICERI2013 Proceedings.
Jankovský M, Merganič J, Allman M, Ferenčík M, Messingerová V (2018) The cumulative effects of work-related factors increase the heart rate of cabin field machine operators. Int J Ind Ergonom 65: 173–178. https://doi.org/10.1016/j.ergon.2017.08.003.
Krieger N (2010) Workers are people too: societal aspects of occupational health disparities – an ecosocial perspective. Am J Ind Med 53: 104–115. https://doi.org/10.1002/ajim.20759.
Landsbergis P (2010) Assessing the contribution of working conditions to socioeconomic disparities in health: a commentary. Am J Ind Med 53: 95–103. https://doi.org/10.1002/ajim.20766.
Landsbergis P, Grzywacz J, LaMontage A (2014) Work organization, job insecurity, and occupational health disparities. Am J Ind Med 57: 495–515. https://doi.org/10.1002/ajim.22126.
Lee B, Chung WY (2012) Driver alertness monitoring using fusion of facial features and bio-signals. IEEE Sens J 12: 2416–2422. https://doi.org/10.1109/JSEN.2012.2190505.
Lemke M, Apostolopoulos Y, Hege A, Sonmez S, Wideman L (2016) Understanding the role of sleep quality and sleep duration in commercial driving safety. Accident Anal Prev 97: 79–86. https://doi.org/10.1016/j.aap.2016.08.024.
Li G, Chung WY (2013) Detection of driver drowsiness using wavelet analysis of heart rate variability and a support vector machine classifier. Sensors 13: 16494–16511. https://doi.org/10.3390/s131216494.
Macků J, Dvořák J (2011) The comparative analysis of eye muscles load on cut-to-length harvester operators, data collection methodology. 4th International science conference on woodworking techniques, Prague.
Makhsous M, Lin F, Hendrix RW, Hepler M, Zhanq LQ (2006) Sitting with adjustable ischial and back supports: biomechanical changes. Spine 28: 1113–1121. https://doi.org/10.1097/01.BRS.0000068243.63203.A8.
Marmot M (2015) The health gap: the challenge of an unequal world. Lancet 386: 537–546. https://doi.org/10.1016/S0140-6736(15)00150-6.
Mathiowetz V, Rennels C, Danhoe L (1985) Effect of elbow position on grip and key pinch strength. J Hand Surg 10: 694–697. https://doi.org/10.1016/S0363-5023(85)80210-0.
McDonald N (1984) Fatigue, safety and the truck driver. Taylor & Francis, London. ISBN 0-85066-207-9.
Mellner C, Kecklund G, Kompier M, Sariaslan A, Aronsson G (2016) Boundaryless work, psychological detachment and sleep: does working anytime-anywhere equal employees are always on? New Ways of Working Practices 16, Emerald Group Publishing Limited, Bingley, pp 29–47. https://doi.org/10.1108/S1877-636120160000016003.
Romeo J, Manuel J, Reiman A, Delgado J (2018) Delivery truck drivers’ work outside the cab, psychosocial discomforts and risks based on participatory video analyses. Eur Transp Res Rev 10, article id 27. https://doi.org/10.1186/s12544-018-0299-3.
Schuhfried (2004) Biofeedback 2000 x-pert – the multi-media system from Schuhfried. Dryad [Dataset] https://schuhfried.com/biofeedback/. Accessed 21 June 2019.
Škvor P (2018) Vliv pracovního prostředí na operátora harvestoru – analýza elektromyogramu svalů zápěstí a předloktí. [Influence of working environment on harvester operator – analysis of electromyogram of wrist and forearm muscles]. Czech University of Life Sciences Prague, Prague.
Škvor P (2020) Vyhodnocení vybraných biometrických ukazatelů u obsluhy těžebně dopravního zařízení. [Evaluation of selected biometric indicators for the operator of mining and transport equipment]. Czech University of Life Sciences Prague, Prague.
Sundelin G, Hagberg M (1992) Electromyographic signs of shoulder muscle fatigue in repetitive arm work paced by the methods-time measurement system. Scand J Work Environ Health 18: 262–268. https://doi.org/10.5271/sjweh.1579.
Vicente J, Laguna P, Bartra A, Bailon R (2016) Drowsiness detection using heart rate variability. Med Biol Eng Comput 54: 927–937. https://doi.org/10.1007/s11517-015-1448-7.
Wasmund WL, Westrholm EC, Watenpaugh DE, Wasmund SL, Smith ML (2002) Interactive effects of mental and physical stress on cardiovascular control. J Appl Physiol 92: 1828–1834. https://doi.org/10.1152/japplphysiol.00019.2001.
Westgaard RH (1988) Measurement and evaluation of postural load in occupational work situations. Eur J Appl Physiol 57: 291–304. https://doi.org/10.1007/BF00635987.
Zheng R, Yamabe S, Nakano K, Suda Y (2015) Biosignal analysis to assess mental stress in automatic driving of trucks: palmar perspiration and masseter electromyography. Sensors 15: 5136–5150. https://doi.org/10.3390/s150305136.
Zlatuška K, Bystrický R, Ježek J, Natov P, Sekanina A, Tománek J (2020) Technická doporučení pro projektování lesní dopravní sítě. [Technical recommendations for the design of the forest transport network]. Ministry of Agriculture of the Czech Republic & Czech University of Life Sciences in Prague, Prague. Dryad [Dataset] http://eagri.cz/public/web/file/658791/Technicka_doporuceni_projektovani_lesni_dopravni_site_A4_WEB.pdf. Accessed 13 November 2020.
Zuzewicz K, Roman-Liu D, Konarska M, Bartuzi P, Matusiak K, Korczak D, Guzek M (2013) Heart rate variability (HRV) and muscular system activity (EMG) in cases of crash threat during simulated driving of a passenger car. Int J Occup Med Env 26: 710–723. https://doi.org/10.2478/s13382-013-0148-5.
Total of 56 references.
Send to email
