Caroline Mary Adrianne Franklin  ,
Karen A Harper,
Liam Kyte Murphy
,
Karen A Harper,
Liam Kyte Murphy
Structural dynamics at boreal forest edges created by a spruce budworm outbreak
Franklin C. M. A., Harper K. A., Murphy L. K. (2015). Structural dynamics at boreal forest edges created by a spruce budworm outbreak. Silva Fennica vol. 49 no. 3 article id 1267. https://doi.org/10.14214/sf.1267
Highlights
- Insect outbreak edges were 10 m wide with different canopy cover, stem density and tree structural diversity than adjacent ecosystems
- Although edge influence on forest structure was weak, forest influence was stronger and extended further, creating an edge zone skewed towards the disturbed area
- After thirty years, high-contrast and structurally-diverse transition zones persist on the landscape.
Abstract
Natural disturbances such as insect outbreaks create boundaries that influence vegetation patterns and ecological processes. To better understand the effects of natural edge creation on relatively intact forests and adjacent disturbed areas, we investigated forest structure on both sides of 30 year-old forest edges created by a spruce budworm (Choristoneura fumiferana Clemens) outbreak in the boreal forest of Cape Breton Highlands National Park, Canada. Our objectives were: 1) to determine edge influence (compared to interior forest) and forest influence (compared to disturbed areas) on vegetation structure, and 2) to gain insight into the structural development of the edges. Canopy cover, tree density, radial growth and deadwood were sampled in 5 m x 20 m plots along 120 m transects across six edges. Randomization tests were used to estimate the magnitude and distance of edge and forest influence. Narrow transition zones approximately 10 m wide characterized the spruce budworm-induced edges. Edge influence did not extend into the forest; however, forest influence on structure was detected up to 40 m from the edge into the disturbed area. We found evidence of the insect outbreak in the form of reduced radial growth during the disturbance across the entire disturbed area-forest gradient, which indicates that spruce budworm activity may not have ceased directly at the edge. Tree mortality caused by the insect outbreak resulted in snags, many of which have transformed into logs since the outbreak collapsed. Spruce budworm outbreak-induced forest edges are narrow but dynamic boundaries separating two distinct vegetation communities in the boreal landscape.
Keywords
edge influence;
balsam fir;
insect disturbance;
structure;
forest influence
-
Franklin,
Department of Renewable Resources, University of Alberta, 751 General Services Building, Edmonton, Alberta, T6G 2H1, Canada
E-mail
cfrankli@ualberta.ca
- Harper, School for Resource and Environmental Studies, Dalhousie University, Suite 5010, 6100 University Ave., Halifax, Nova Scotia, B3H 3J5, Canada E-mail Karen.Harper@dal.ca
- Murphy, Department of Environmental Science, Saint Mary’s University, 923 Robie St., Halifax, Nova Scotia, B3H 3C3, Canada E-mail liamkmurphy@gmail.com
Received 21 October 2014 Accepted 29 May 2015 Published 11 June 2015
Views 154549
Available at https://doi.org/10.14214/sf.1267 | Download PDF

Supplementary Files
1 Introduction
Forest edges, defined as boundaries between disturbed areas and adjacent intact forests, play a significant ecological role by regulating flows of organisms across adjoining communities (Cadenasso et al. 2003) and contribute to widespread spatial heterogeneity in boreal forests (Jansson et al. 2011). In addition to anthropogenic activities such as clearcutting, landscape heterogeneity is also caused by large-scale natural disturbances such as insect outbreaks and wildfire (Bonan and Shugart 1989). While forest edges induced by wildfire have gained recent attention in landscape ecology (e.g. Hanson and Stuart 2005; Beghin et al. 2010; Braithwaite and Mallik 2012), the impact of insect outbreak-induced forest edges on vegetation in adjacent forests and disturbed areas has not been examined. Contrasts in vegetation structure between adjoining ecosystems can ultimately influence ecological processes such as tree growth (McDonald and Urban 2004) and decomposition (Riutta et al. 2012). As insect outbreaks are naturally occurring phenomena worldwide, research on vegetation structure at their created forest edges can be used to better understand the spatiotemporal dynamics of terrestrial ecosystems.
A major insect disturbance agent affecting millions of hectares of forest in eastern Canada is the spruce budworm (Choristoneura fumiferana Clemens) (Fleming 2000). Extensive tree mortality caused by the insect defoliator results in up to 60% timber yield reductions (MacLean 1990; Hennigar et al. 2007) and great economic loss (Chang et al. 2012). The spruce budworm feeds mainly on mature balsam fir (Abies balsamea (L.) Mill.) and also spruce (Picea spp. Mill.). The insect is of particular importance to forest dynamics because periodic outbreaks enable forest succession (Royama 1984; Morin 1994). Ecological consequences of the spruce budworm include tree mortality (Belyea 1952), reduced tree growth (MacLean 1984) and increased structural diversity (Belle-Isle and Kneeshaw 2007). Although a substantial amount of research has focused on the direct effects of spruce budworm outbreaks on vegetation in disturbed areas (e.g. D’Aoust et al. 2004; Bouchard et al. 2006; Bouchard et al. 2007), we seek to quantify insect outbreak-induced edge effects on vegetation in opposing directions (i.e., the influence of disturbed areas on vegetation in adjacent intact forests and of the forests on disturbed openings).
The wide variability in spruce budworm outbreak patterns (Zhao et al. 2014) results in high ratios of edge to interior conditions hence large portions of boreal forests may be experiencing edge influence. If edge influence is extensive, insect outbreaks could be affecting the landscape in ways that extend beyond their boundaries. Unlike many edge studies that have only collected on one side of the boundary (Harper et al. 2005), we collected data on both sides to detect a distinct zone of transition characterized by vegetation structure that is significantly different than both adjacent community interiors. In contrast to edge influence, which refers to the effects of the disturbed area on response variables in adjacent intact forest, forest influence is known as the effects of relatively undisturbed forest on disturbed areas (Keenan and Kimmins 1993). Edge and forest influence may result in opposite effects on the same response variables and, consequently, differences in the relative magnitudes and distances of responses (Baker et al. 2013).
Primary responses to edge creation include increased tree mortality, deadwood abundance and lower canopy cover compared to interior forest (Harper et al. 2005). Edge influence on such structural variables extends from the edge up to 20 m into the forest at clearcut edges (Harper and Macdonald 2002) and up to 5 m at fire edges (Harper et al. 2014) when compared to interior forest. Similar to natural forest edges created by fire, edge influence on vegetation at edges created by insect disturbance may also be minimal. Nevertheless, insect outbreaks are inherently different than wildfire as they are host-specific and tree death occurs over a relatively longer time. The effects of insect outbreaks on landscape patterns and processes must also be assessed in relation to forest fragmentation by logging and edge influence.
We compared vegetation structure at forest edges to that of the disturbed area and forested interiors to determine whether spruce budworm outbreak-induced forest edges affect vegetation in adjacent communities three decades post-disturbance. Our objectives were: 1) to estimate the magnitude and extent of edge and forest influence on forest structure at spruce budworm-induced edges; and 2) to gain insight into the structural development of the edges by examining radial growth of residual canopy trees, deadwood decay stages and structural diversity along the disturbed area-forest gradient.
2 Materials and methods
2.1 Study area
The study was conducted in Cape Breton Highlands National Park (46°50´N, 60°30´W), which was established in 1936 and encompasses 950 km2 of northern Cape Breton Island, Nova Scotia, Canada. The surrounding Atlantic Ocean to the east and the Gulf of St. Lawrence to the west of the island contribute to the park’s maritime climate. Climatic normals (1971–2000) from nearby Pleasant Bay (46°49´N, 60°46´W) reported a mean January temperature of –5.3 ± 1.8 °C, a mean July temperature of 18.1 ± 1.8 °C, a mean annual rainfall of 1069 mm and a mean annual snowfall of 381 cm (Environment Canada 2013). The region is characterized by a plateau, which ranges in elevation from 350 to 500 m above sea level and contains underlying Precambrian granitic and volcanic bedrock (Webb and Marshall 1999). The plateau experiences heavy snowfall, high winds and frequent fog (Webb and Marshall 1999).
The boreal land region, which dominates approximately 50% of Cape Breton Highlands National Park, consists mainly of Abies balsamea interspersed with Picea glauca (Moench) Voss and Betula papyrifera Marsh. (Parks Canada 2010). Picea mariana (Mill.) BSP and Larix laricina (Du Roi) K. Koch are also present in moist areas. Soils are mostly sandy loams of moderately coarse texture (Neily et al. 2003). Fire is not a common disturbance and logging does not occur within park boundaries.
The latest spruce budworm outbreak, which occurred from 1974 to 1984, was the most severe compared to prior outbreaks in the area (Ostaff and MacLean 1989). Park management refrained from using insecticides to control the outbreak. By the collapse of the outbreak in 1985, affected stands on Cape Breton Island experienced mortality of approximately 87% Abies balsamea (MacLean and Ostaff 1989). Three decades post-disturbance, the area still consists of extensive areas devoid of canopy trees characterized by clear transitions between insect disturbed areas and intact forest as a result of heavy moose (Alces alces andersoni Peterson) browsing (Fig. 1).
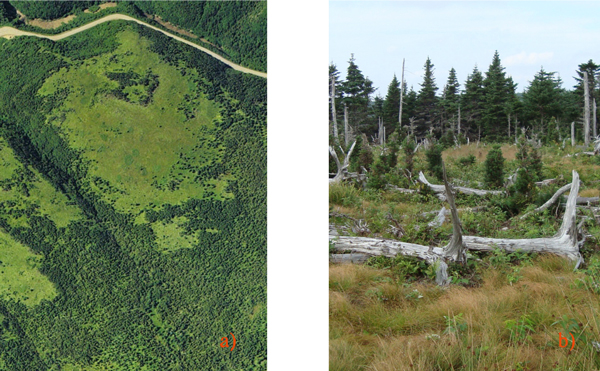
Fig. 1. Examples of spruce budworm-induced edges: a) an aerial photograph of the fragmented landscape and b) an example of an edge at one of our sites. In a), the areas devoid of continuous canopy were the result of tree mortality caused by the last spruce budworm outbreak (1974–1984) in northern Cape Breton, Canada; photography credit to Nova Scotia Department of Natural Resources (2009). In b), the insect disturbed area in the foreground is characterized by deadwood abundance and stunted saplings while the relatively intact forest is in the background; photography credit to Caroline Franklin.
2.2 Site selection and data collection
Historical aerial photographs of Cape Breton Island taken in 1969 were compared to aerial photographs taken in 2010 to identify areas of forest canopy reduction caused by the 1974–1984 outbreak. Ground surveys were subsequently used to select six spruce budworm induced-forest edges (Fig. 2; Table 1) that were in fir-spruce dominated forests over relatively uniform terrain. Photographs taken in 1969 (pre-outbreak) did not reveal any type of vegetation or topography discontinuity at selected edges suggesting that the study area was uniform in relation to forest composition and structure prior to the beginning of the spruce budworm outbreak. Both the forest area and the disturbed area extended at least 80 m from the edge and edge sites were located at least 100 m away from any other edges.
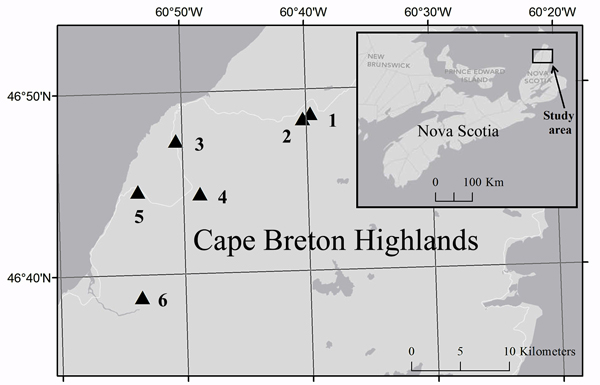
Fig. 2. Location of study sites (triangles) in Cape Breton Highlands National Park and the corresponding location in Nova Scotia (inset). Cartography credit to Caroline Franklin, Esri, DeLorme, NAVTEQ.
| Table 1. Characteristics of spruce budworm-induced forest edges and adjacent areas disturbed by a spruce budworm outbreak 30 years earlier in boreal forest of northern Cape Breton Island, Nova Scotia, Canada. | |||
| Transect | Edge orientation facing the disturbed area | Elevation (m) | Size of disturbed area (ha) |
| 1 | 234° | 438 | 4.46 |
| 2 | 292° | 465 | 5.18 |
| 3 | 341° | 352 | 4.96 |
| 4 | 60° | 422 | 3.17 |
| 5 | 270° | 381 | 6.81 |
| 6 | 12° | 459 | 4.86 |
We established a single 120 m long transect perpendicular to each of the six forest edges, which extended 60 m into both the forest and the disturbed area. The distance of 60 m was chosen to detect edge influence, which usually dissipates within 50 m from the edge in boreal forests (Harper et al. 2005). The forest edge in the middle of the transect at 0m was defined as the point at which the intact forest transitioned into the insect disturbed area based on the limit of continuous stems. Along each transect, we established 5 m x 20 m plots (length parallel to the forest edge) centered at the following distances from the edge: –60, –40, –20, –10, 0, 10, 20, 40 and 60 m (negative distances represent the insect disturbed side of the edge). In addition to these edge plots, three plots representing reference conditions were located in the nearby disturbed area at five sites and three in the nearby forest area at four sites. The patchiness of the landscape restricted us from sampling reference plots at all edge transect locations. Most of these reference plots were located at least 100 m away from the spruce budworm-induced forest edge; however, due to spatial constraints some were only 70 m away from the edge.
Data were collected from June to August 2012. Average canopy cover was calculated from four measurements taken facing each cardinal direction using a spherical densiometer at the centre of each plot. Species, relative canopy position (suppressed, intermediate, co-dominant, dominant, Côté 2000) and diameter at breast height (DBH, 1.3 m) of each tree (DBH ≥ 5 cm) growing in the plots were recorded. The heights of the three tallest trees in each plot were measured using a laser rangefinder. Decay stage, relative canopy position, presence or absence of broken tops and diameter at breast height of each snag ( ≥ 5 cm DBH) located in the plots were recorded. The decay stage of snags was determined by using an adapted version of a classification system from Maser et al. (1979). Class I (lightly decayed) snags had most of their bark intact and branches with twigs were present, class II (moderately decayed) snags had some branches attached and bark was detached or absent and class III (severely decayed) snags were hollow with no branches. Snag breakage was calculated as the percentage of snags with broken tops in each plot. The line intercept method was used to sample log ( ≥ 5 cm in diameter) decay class along the 20 m centre line of each plot and log diameter was measured at the point of line intersection. A classification system specific for logs was adapted from Maser et al. (1979) and used to determine the decay stage of downed wood. Class I logs had intact bark with branch system present with twigs, class II logs had mostly intact bark with branches and minimal vegetation, class III logs had detached bark with no branch system, class IV logs were soft and covered with vegetation and class V logs were very soft and hidden as lumps on the forest floor. Classes I and II were combined and considered lightly decayed, classes III and IV were considered moderately decayed and class V was severely decayed. The three individual Abies balsamea trees with the largest diameters in each plot were cored at breast height (~ 1.3 m above ground). An increment core sample was taken from each opposite side of each individual tree (2 cores/tree) and then processed using a standard dendrochronological approach (Holmes et al. 1986). Three of the sites were omitted due to low sample sizes after problems with improper mounting.
2.3 Dendrochronological analysis
Annual tree ring widths were measured using a Velmex Stage system in combination with a microscope. Data from individual tree cores were compiled for each plot at a specific distance from the edge and cross-dated using the program COFECHA (Holmes et al. 1986). Ring width data were standardized using ARSTAN to develop the ring width index of each site, which removed age-related growth trends. Average annual radial growth was calculated for four distinct eleven-year intervals corresponding to the years prior to the beginning of the outbreak (1963–1973), during the outbreak (1974–1984), immediately after the outbreak collapse (1985–1995) and a decade after the collapse (1996–2006). We then calculated the difference between the average growth rate prior to the outbreak with the average growth rate during, immediately after and a decade after the outbreak.
2.4 Data analysis
We assessed edge influence for the following variables: canopy cover, live stem density of all trees together and of individual tree species (Abies balsamea, Picea glauca, Betula papyrifera, Larix laricina), tree species diversity, maximum tree height, snag and log densities of three different decay classes (light decay, moderate decay, severe decay), snag breakage and structural diversity. Tree species diversity was based on stem density by species and was calculated using the Shannon-Weiner index. Structural diversity was determined by creating mutually exclusive structural groups based on the frequency of live stems, snags and logs (Supplementary file 1). The structural groups were treated as ‘pseudo-species’ and used to calculate the structural equitability index (structural diversity index = Shannon diversity index/ln(# pseudo-species), which is a more suitable index compared to Shannon’s diversity index (Valbuena et al. 2012).
We calculated the magnitude of edge influence (MEI, the strength of edge influence, Harper et al. 2005) and magnitude of forest influence (MFI) for each response variable when compared to the interior forest and disturbed area reference, respectively. MEI/MFI was calculated as:
where xd = average of a given response variable at distance d from the edge and xi = average of the same response variable in interior forest or disturbed area.
The distance of edge influence (DEI) is defined as the distance over which a given response variable is significantly different from the forest reference (Harper et al. 2005) while the distance of forest influence (DFI) is the distance over which a given response variable is significantly different from the disturbed area reference. DEI and DFI were determined for each of the variables under investigation except for tree growth since the analysis is not advisable for only three transects (Harper and Macdonald 2011). The randomized test of edge influence (RTEI) was used because it is considered one of the most effective methodological approaches to quantify the distance of edge/forest influence as it incorporates randomization of the values in the reference ecosystem as well as of the values at the forest edge (Harper and Macdonald 2011). Because not all of the study sites included reference plots, we used the RTEI method without blocking which randomizes values for all the reference plots together rather than by transect. Using a two-tailed test, the mean edge value was considered to be significantly different than the reference values when the p-value was in the upper 97.5 or lower 2.5 percentiles. The analysis was performed for each distance along the edge transect (–60, –40, –20, –10, 0, 10, 20, 40, 60 m) using the disturbed area reference for forest influence and the forest reference for edge influence. To address the issue of multiple testing, DEI and DFI were only considered significant if there were at least two consecutive significant p-values.
3 Results
Spruce budworm outbreak-forest edges were narrow zones of transition between disturbed areas and relatively undisturbed forest. The transition zone was located between –20 m and –10 m (approximately 10 m in width) where canopy cover, live stem density and tree structural diversity were significantly different than both the forest and disturbed area interiors (Table 2). Edge influence did not extend into the forest for any of the response variables under investigation but forest influence extended from the forest up to 40 m into the disturbed area (Figure 3).
| Table 2. Magnitude and distance of edge influence (MEI, DEI) and magnitude and distance of forest influence (MFI, DFI) for different response variables at spruce budworm outbreak-induced forest edges (n = 6). MEI/MFI is a measure of the strength (–1 to 1) to which the response variable differs at the edge compared to the reference ecosystem, which is the forest for edge influence and disturbed area for forest influence. Positive and negative MEI/MFI indicate higher and lower values at the edge (0 m) compared to the reference interior, respectively. DEI/DFI represents the set of distances from the edge over which the response variable is significantly different compared to the reference ecosystem. Negative values of DEI/DFI refer to distances from the edge into the disturbed area and ‘ns’ = not significant. | |||||
| Response Variable | Edge Influence | Forest Influence | |||
| MEI | DEI (m) | MFI | DFI (m) | ||
| Canopy cover | –0.35 | –60 to 0 | 0.99 | –20 to 60 | |
| Maximum tree height | 0.02 | –40 to –20 | 0.33 | ns | |
| Live stem density | |||||
| Abies balsamea | –0.15 | –60 to –40 | 0.99 | –20 to 60 | |
| Betula papyrifera | 0 | ns | –1 | ns | |
| Picea glauca | –0.78 | –60 to 0 | 0.83 | 0 to 60 | |
| Larix laricina | –1 | ns | 0 | ns | |
| Total | –0.42 | –60 to 0 | 0.88 | –20 to 60 | |
| Tree species diversity | 0.23 | –60 to –20 | 0.67 | 0 to 10 | |
| Snag proportion (of live and dead stems) | |||||
| Lightly decayed | –0.39 | –60 to 0 | 0.01 | ns | |
| Moderately decayed | 0.44 | –10 to 0 | 0.29 | ns | |
| Severely decayed | –0.29 | ns | –0.71 | ns | |
| Total | 0.13 | –60 to –40 | –0.10 | ns | |
| Snag breakage | 0.05 | ns | –0.05 | ns | |
| Log abundance | |||||
| Lightly decayed | –0.71 | ns | –0.33 | ns | |
| Moderately decayed | 0.07 | –40 to –20 | –0.25 | ns | |
| Severely decayed | 0.18 | ns | 0.21 | ns | |
| Total | 0.03 | ns | –0.13 | ns | |
| Structural diversity | |||||
| Tree | –0.05 | –60 to –10 | 1 | –20 to 60 | |
| Snag | –0.11 | –60 to –40 | 0.76 | –40 to 60 | |
| Log | –0.05 | ns | –0.04 | ns | |
| Total | 0 | ns | 0.27 | –10 to 60 | |
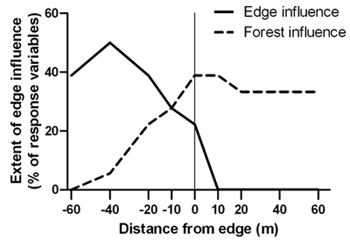
Fig. 3. Percentage of 18 structural response variables with significant edge and forest influence compared to the forest and disturbed area references, respectively, at forest edges created by a spruce budworm outbreak. Sample size was n = 6 transects.
Average canopy cover, maximum tree height and live stem density increased from the disturbed area into the forest, revealing sigmoidal shaped patterns across the edge gradient (Fig. 4). Significant forest influence of greater canopy cover extended 20 m from the edge into the disturbed area (Fig. 4a). Trees were tallest 10 m into the forest from the edge and maximum tree height in the forest reference was almost twice as high than in the disturbed area reference (Fig. 4b). Similar to canopy cover, live stem density was also significantly higher and lower than the disturbed area interior and forest interior, respectively, from 0m to –20 m (Fig. 4c).
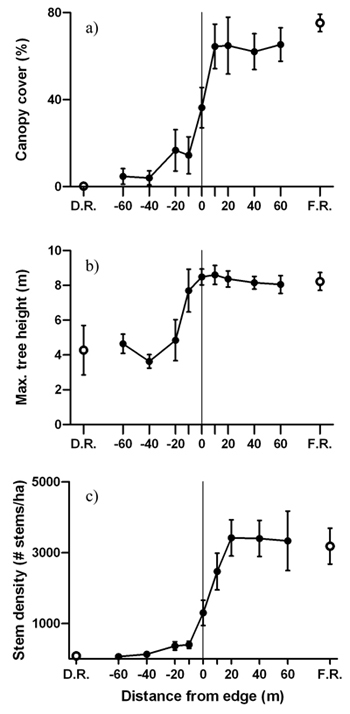
Fig. 4. Mean (± 1 SE) values for a) canopy cover, b) maximum tree height and c) live stem density along the insect disturbed area-forest edge. Open circles represent values for the disturbed area reference (D.R.) and forest reference (F.R.). Sample size was n = 6 transects.
Four tree species were identified in the study area (Abies balsamea, Betula papyrifera, Larix laricina and Picea glauca). Abies balsamea represented the greatest density at every distance from the edge, except in the disturbed area reference where Picea glauca and Betula papyrifera were the dominant species (Table 3). Edge influence on tree species diversity was negative with a DEI of 20 m to 60 m on the disturbed side of the edge; i.e., there was no edge influence on tree species diversity on the forest side of the edge.
| Table 3. Mean (± 1 SE) diameter at breast height, stem density of individual species and species diversity at different distances from the spruce budworm disturbed area-forest edge. Negative values represent the distances from the edge on the disturbed side. | ||||||
| Distance from edge (m) | Diameter at breast height (cm) | Stem density (#/ha) | Tree species diversity | |||
| Abies balsamea | Picea glauca | Betula papyrifera | Larix laricina | |||
| Disturbed reference | 11.2 ± 2.0 | 7 ± 7 | 20 ± 15 | 60 ± 38 | 0 ± 0 | 0.09 ± 0.06 |
| –60 | 10.1 ± 1.4 | 50 ± 50 | 17 ± 17 | 0 ± 0 | 0 ± 0 | 0.00 ± 0.00 |
| –40 | 6.9 ± 0.8 | 100 ± 100 | 33 ± 21 | 0 ± 0 | 0 ± 0 | 0.00 ± 0.00 |
| –20 | 13.6 ± 1.4 | 283 ± 145 | 83 ± 54 | 0 ± 0 | 0 ± 0 | 0.00 ± 0.00 |
| –10 | 15.5 ± 1.6 | 283 ± 101 | 117 ± 83 | 0 ± 0 | 0 ± 0 | 0.10 ± 0.10 |
| 0 | 11.5 ± 0.6 | 1083 ± 376 | 217 ± 75 | 0 ± 0 | 0 ± 0 | 0.46 ± 0.11 |
| 10 | 12.2 ± 0.4 | 1750 ± 530 | 717 ± 341 | 0 ± 0 | 0 ± 0 | 0.43 ± 0.14 |
| 20 | 10.4 ± 0.3 | 2250 ± 706 | 1167 ± 528 | 0 ± 0 | 0 ± 0 | 0.35 ± 0.12 |
| 40 | 9.6 ± 0.2 | 2167 ± 685 | 1183 ± 561 | 0 ± 0 | 50 ± 50 | 0.31 ± 0.13 |
| 60 | 10.0 ± 0.3 | 2067 ± 1037 | 1200 ± 636 | 17 ± 17 | 50 ± 50 | 0.43 ± 0.14 |
| Forest reference | 9.9 ± 0.3 | 1458 ± 545 | 1717 ± 587 | 0 ± 0 | 8 ± 8 | 0.28 ± 0.10 |
Patterns of deadwood abundance generally decreased from the disturbed area into the forest (Fig. 5). Positive edge influence on the proportion of snags only occurred within the disturbed area (DEI = –60 m to –40 m) with no edge influence on the forest side (Fig. 5a). The majority of snags on the forest side of the edge were lightly decayed and had smaller diameters than snags on the disturbed side (Table 4). Meanwhile, the disturbed side of the edge contained more moderately or severely decayed snags (Table 4). The proportion of moderately decayed snags peaked at the edge with positive edge influence 0m to 10 m into the disturbed area (Table 2). None of the snag proportions for separate decay classes were significantly different than the disturbed area reference (Table 2). Despite a general decrease from the disturbed area into the forest, the proportion of broken snags did not experience edge or forest influence (Fig. 5b). Among the three decay classes for logs, moderately decayed was the most dominant across the disturbed area-forest gradient followed by severely decayed and then lightly decayed (Fig. 5c).
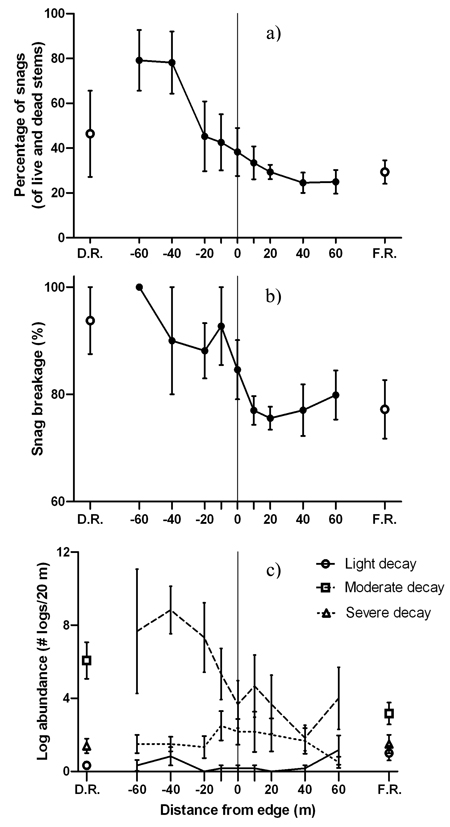
Fig. 5. Mean (± 1 SE) values for a) snags as a percentage of live and dead stems, b) snag breakage and c) log abundance by decay class along the insect disturbed area-forest edge. Open shapes represent values for disturbed area reference (D.R.) and forest reference (F.R.). Sample size was n = 6 transects.
| Table 4. Mean (± 1 SE) percentage of snags (of all snags at that distance) and snag diameter at breast height of each decay class at different distances from the spruce budworm disturbed area-forest edge. Sample size was n = 6 transects. | ||||||
| Distance from edge (m) | Percentage of snags | Snag diameter at breast height (cm) | ||||
| Light decay | Moderate decay | Severe decay | Light decay | Moderate decay | Severe decay | |
| Disturbed reference | 28 ± 16 | 36 ± 22 | 36 ± 22 | 13.1 ± 5.7 | 16.6 ± 6.6 | 17.8 ± 5.8 |
| –60 | 23 ± 17 | 37 ± 20 | 40 ± 20 | 7.0 ± 1.4 | 15.6 ± 4.7 | 12.4 ± 2.1 |
| –40 | 10 ± 10 | 43 ± 19 | 47 ± 23 | 16.5 ± 0.00 | 9.0 ± 1.5 | 16.1 ± 2.4 |
| –20 | 21 ± 11 | 50 ± 15 | 29 ± 11 | 13.1 ± 2.7 | 11.1 ± 1.3 | 14.6 ± 2.0 |
| –10 | 12 ± 8 | 63 ± 10 | 25 ± 10 | 12.3 ± 4.0 | 13.2 ± 1.4 | 14.7 ± 2.1 |
| 0 | 28 ± 9 | 66 ± 11 | 6 ± 4 | 10.7 ± 1.6 | 13.6 ± 1.2 | 12.6 ± 1.7 |
| 10 | 68 ± 6 | 18 ± 5 | 14 ± 6 | 9.6 ± 0.9 | 11.1 ± 1.1 | 16.5 ± 2.0 |
| 20 | 66 ± 9 | 26 ± 7 | 8 ± 3 | 8.3 ± 0.5 | 13.0 ± 1.7 | 13.8 ± 2.2 |
| 40 | 78 ± 7 | 8 ± 4 | 14 ± 4 | 8.1 ± 0.4 | 13.5 ± 3.0 | 17.7 ± 3.3 |
| 60 | 56 ± 10 | 36 ± 12 | 8 ± 5 | 9.6 ± 0.9 | 11.3 ± 1.3 | 18.3 ± 5.5 |
| Forest reference | 64 ± 6 | 25 ± 6 | 11 ± 3 | 8.7 ± 0.4 | 10.0 ± 0.7 | 15.1 ± 2.1 |
The forest side of the edge was characterized by greater tree and snag structural diversities compared to the disturbed side of the edge (Fig. 6). Significant negative edge influence on tree and snag structural diversities was limited to the disturbed side of the edge (Fig. 6a-b). However, forest influence on tree and snag structural diversity extended from the forest 20 m and 40 m into the disturbed area, respectively. Log structural diversity did not experience significant edge or forest influence (Fig. 6c). Forest influence on overall structural diversity was significantly different up to 10 m from the edge into the disturbed area (Fig. 6d). MFI was strongest for tree, intermediate for snag and weakest for log structural diversity (Table 2).
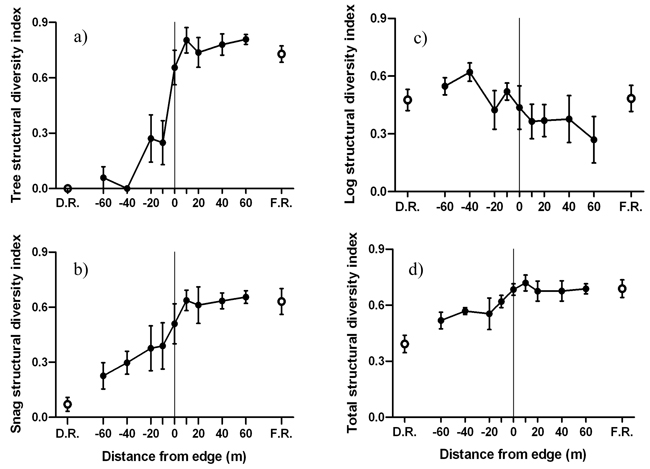
Fig. 6. Mean (± 1 SE) structural diversity index for a) live trees, b) snags, b) logs and d) all structural components combined along the insect disturbed area-forest edge. Open circles represent values for disturbed area reference (D.R.) and forest reference (F.R.). Sample size was n = 6 transects.
Radial tree growth appeared to be affected by the last spruce budworm outbreak at all distances along the disturbed area-forest gradient (Fig. 7). The reduction in mean annual radial growth during the outbreak did not display a consistent pattern across the gradient. After the outbreak subsided, annual radial growth of the surviving trees in the disturbed area exceeded pre-outbreak growth rates. Meanwhile, post-disturbance growth rates for trees growing on the forest side of the edge were not as high as those recorded pre-outbreak, except at 10 m from the edge.
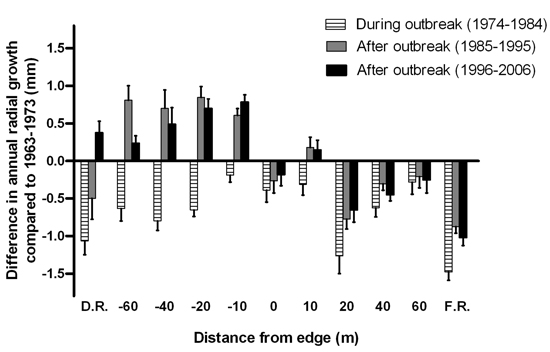
Fig. 7. Mean difference in annual radial growth (+ 1 SE) of Abies balsamea between the eleven-year interval prior to the start of the spruce budworm outbreak (1963–1973) and the eleven-year intervals during the outbreak in 1974–1984, after the outbreak in 1985–1995 and in 1996–2006. Sample sizes were n = 1, 1, 3, 5, 6, 5, 4, 5, 3, 1 and 8 live tree stems for distances D.R, –60, –40, –20, –10, 0, 10, 20, 40, 60 and F.R., respectively.
4 Discussion
4.1 Edge influence and forest influence on vegetation structure
The spruce budworm-induced forest edges were narrow zones of transition separating two communities characterized by distinct structural attributes. As expected, the disturbed side of the edge contained fewer trees and lower canopy cover than the forest side as a result of heavy tree mortality from the insect outbreak. Abies balsamea was most likely the dominant species in every plot except in the disturbed area reference because the effects of the spruce budworm were very strong in the disturbed area interior hence the majority of the host species died. Significant changes in canopy cover, stem density and structural diversity were detected 10 m to 20 m from the edge into the disturbed area, where the variables experienced both edge and forest influence. The narrowness of the transition zone that characterized the spruce budworm outbreak-forest edges suggests that the edges were abrupt as the contrast in vegetation structure between the disturbed area and adjacent forest was apparent over a relatively short distance.
Abruptness of created forest edges could potentially be related to the amount of tree mortality as a consequence of disturbance severity. For example, forest edges were more abrupt when adjacent areas were more intensively managed for agricultural purposes (Chabrerie et al. 2013). Natural forest edges induced by wildfire were more pronounced than those created by a mountain pine beetle outbreak as a result of higher tree mortality in areas disturbed by fire (89%) compared to stands affected by the insect (43%) (McIntire and Fortin 2006). Similar to the more abrupt wildfire boundaries, stands affected by the latest spruce budworm outbreak on Cape Breton Island experienced high mortality of approximately 87% Abies balsamea (MacLean and Ostaff 1989). Therefore, the abruptness of forest edges could possibly depend on the amount of tree mortality in the disturbed area, which affects the structural contrast between adjacent communities rather than the type of disturbance.
Even though the spruce budworm-induced forest edges were abrupt, edge influence on the examined structural variables did not extend into the forest, which suggests that the forest edge was structurally unaffected by the spruce budworm outbreak three decades after the disturbance. Boreal forest edges created by wildfire (DEI = 5 m, Harper et al. 2014) and lakeshore forest edges (DEI = 10 m, Harper and Macdonald 2001) also exhibited comparatively narrow edge influence on forest structure when compared to interior forest. Since large-scale natural disturbances are relatively common in the boreal forest (Bonan and Shugart 1989), vegetation in boreal ecosystems could be more resilient to change and therefore less affected by edge creation compared to temperate and tropical forests (Harper et al. 2005).
As indicated by reduced radial growth across the entire disturbed area-forest gradient, the spruce budworm outbreak may not have stopped directly at the edge; trees in the forest interior also experienced slower growth. As opposed to anthropogenic edges, where human activity ceases directly at the edge and edge influence can extend up to 20 m into boreal forest (Harper and Macdonald 2002), damage from insect outbreaks may permeate the forest if host trees are available and may consequently weaken edge influence on forest structure on this side of the edge.
Forest influence on vegetation structure was generally stronger and more extensive than edge influence. Taller vegetation may have more impact on shorter plant communities than vice versa. This possibility would be an interesting hypothesis for further testing. Alternatively, insect disturbed areas may be more influenced by the adjacent intact forest than vice versa due to different levels of inherent heterogeneity in interior communities. The calculation of DEI/DFI considers the spectrum of variation within the reference plant community (Harper and Macdonald 2011); hence ecological variability in a more heterogeneous community could result in a smaller DEI (Harper et al. 2005). If the insect disturbance under investigation was less severe, the disturbed areas may have been more heterogeneous in terms of forest structure and therefore edge influence may not have been as extensive.
4.2 Structural development since edge creation
The reduction in tree growth not only in the heavily disturbed areas, but also in the adjacent remaining forest stands, suggests that spruce budworm activity occurred all across the insect disturbed area-forest gradient. A first wave of budworm infestation could have defoliated trees in the forest but the population may not have been high enough to inflict significant mortality. After this first wave subsided, a subsequent wave of severe defoliation may have caused high mortality of host trees up to the current edge. Higher annual radial growth rates after outbreak collapse compared to pre-disturbance growth rates on the disturbed side of the edge could be attributed to reduced competition and greater resource availability such as light, water and nutrients. Positive edge effects on tree growth when compared to forest interiors have been documented at anthropogenic forest edges (McDonald and Urban 2004; Lhotka and Stringer 2013) and may be associated with increased light intensity at the forest edge compared to the forest interior (Wicklein et al. 2012).
The temporal dynamics of deadwood at the spruce budworm outbreak-forest edges suggest that the structure and corresponding abruptness could have developed since edge creation. Deadwood input and transformation continued to persist during the three decades after edge creation as standing dead trees resulting from mortality caused by insect defoliation have since fallen and become logs. Greater log abundance and snag breakage in the disturbed area suggest stronger winds compared to the forest. Higher wind speeds have been detected up to 80 m from the edge into the disturbed area compared to the forest side of other forest edges (Davies-Colley et al. 2000). In Cape Breton, approximately 17% of the dead trees had blown down within four years after the collapse of the spruce budworm outbreak (Ostaff and MacLean 1989). Blowdown continues to play an important role in the transformation of snags to logs up to 15 years after outbreak collapse (Spence and MacLean 2012).
Snags in different stages of decay experienced different edge effects that potentially relate to windthrow and decomposition. The edge (–10 m to 0m) contained significantly higher proportions of moderately decayed snags compared to interior forest. Higher proportions of moderately decayed deadwood at the edge compared to interior forest were also found at forest edges created by wildfire (Harper et al. 2014). Compared to the disturbed area, reduced windthrow of snags may occur directly at forest edges, where the snags could be more protected by adjacent canopy and therefore do not transform into logs as quickly as those in the disturbed area (Harper et al. 2014). The pattern of severely decayed snags was not significantly influenced by the forest edge because tree death most likely occurred prior to edge creation (Campbell and Laroque 2007; Angers et al. 2012). Meanwhile, there were fewer lightly decayed snags on the disturbed side of the edge compared to the forest because overall higher stem density in forested areas resulted in self-thinning.
Even though the spruce budworm outbreak contributed a substantial amount of deadwood to the area, the scarcity of live trees lowered total structural diversity in the severely disturbed area. Positive forest influence on structural diversity was stronger than edge influence, which suggests that the spruce budworm outbreak-induced forest edges are more similar to the forest interior than the disturbed area. Edge influence on structural diversity was also limited to the disturbed side of forest edges created by wildfire (Harper et al. 2014). Organisms that depend on structurally diverse habitats may be affected by the lack of particular structural attributes in disturbed areas and may therefore retreat to forest edges post-disturbance.
4.3 Conclusions and implications
The spruce budworm-induced forest edges were distinct boundaries delineating two separate communities. While the forest side of the edge was characterized by greater stem and snag density as well as higher species diversity, the disturbed side of the edge contained more logs and lower structural diversity. Due to inherent differences between disturbances, the structure of spruce budworm outbreak-forest edges differs from that of other edge types. For example, unlike wildfire, the spruce budworm is host specific; hence the disturbed area reference contained non-host trees as the dominant species, a compositional change that would not be expected from fire edges. The spruce budworm-induced forest edges also contained greater amounts of snags but fewer logs compared to 25-year old wildfire forest edges (Harper et al. 2014). Although responses to edge creation by the insect outbreak, including reduced live stem density and increased deadwood abundance, were similar to responses from edge creation by clearcutting (Jönsson et al. 2007), edge influence on deadwood when compared with the forest interior was greater at clearcut forest edges (Dupuch and Fortin 2013). Reduced edge influence and slower deadwood transformation at spruce budworm-induced forest edges compared to cut and burn edges could be explained by insect outbreak damage occurring over a relatively longer time period.
Evidence of the initial effects of edge creation (tree mortality) in addition to structural changes since the insect disturbance (deadwood transformation) reveal that the spruce budworm-induced edges are dynamic features of the landscape. Stand development post-spruce budworm outbreak is slower in areas recovering from a more severe disturbance (MacLean and Andersen 2008); hence, we do not expect forest edges induced by mild disturbances to be as abrupt and persistent as the forest edges created by the severe insect outbreak that were investigated in this study. The width of the current edge zone could diminish as the disturbed area develops over time (Harper et al. 2014).
Our findings suggest that relatively undisturbed forest stands have a greater effect on disturbed areas than disturbed areas have on forests three decades post-disturbance. The impact of spruce budworm outbreaks on remaining forest stands adjacent to disturbed areas may not be as much of a critical concern compared to fragmented landscapes in other ecosystems. Nevertheless, spruce budworm outbreaks have increased in severity, extent and frequency over the last two centuries (Blais 1983), and their interaction with other disturbances will be affected by climate change (Fleming et al. 2002). Consequently, knowledge of the short and long term effects of insect-induced forest edges will become more important to our understanding of forest ecosystems.
Acknowledgements
Thank you to Greg Baker and Jordi Segers for their assistance with map creation and to James Bridgland (Cape Breton Highlands National Park) for logistical support. Funding for this research was provided by the Natural Sciences and Engineering Research Council of Canada.
References
Angers V.A., Bergeron Y., Drapeau P. (2012). Morphological attributes and snag classification of four North American boreal tree species: relationships with time since death and wood density. Forest Ecology and Management 263: 138–147. http://dx.doi.org/10.1016/j.foreco.2011.09.004.
Baker S.C., Spies T.A., Wardlaw T.J., Balmer J., Franklin J.F., Jordan G.J. (2013). The harvested side of edges: effect of retained forests on the re-establishment of biodiversity in adjacent harvested areas. Forest Ecology and Management 302: 107–121. http://dx.doi.org/10.1016/j.foreco.2013.03.024.
Beghin R., Lingua E., Garbarino M., Lonati M., Bovio G., Motta R., Marzano R. (2010). Pinus sylvestris forest regeneration under different post-fire restoration practices in the northwestern Italian Alps. Ecological Engineering 36: 1365–1372. http://dx.doi.org/10.1016/j.ecoleng.2010.06.014.
Belle-Isle J., Kneeshaw D. (2007). A stand and landscape comparison of the effects of a spruce budworm (Choristoneura fumiferana (Clem.)) outbreak to the combined effects of harvesting and thinning on forest structure. Forest Ecology and Management 246: 163–174. http://dx.doi.org/10.1016/j.foreco.2007.03.038.
Belyea R.M. (1952). Death and deterioration of balsam fir weakened by spruce budworm defoliation in Ontario. Part II. An assessment of the role of associated insect species in the death of severely weakened trees. Journal of Forestry 50: 729–738.
Blais J.R. (1983). Trends in the frequency, extent, and severity of spruce budworm outbreaks in eastern Canada. Canadian Journal of Forest Research 13: 539–547. http://dx.doi.org/10.1139/x83-079.
Bonan G.B., Shugart H.H. (1989). Environmental factors and ecological processes in boreal forests. Annual Review of Ecology and Systematics 20: 1–28. http://dx.doi.org/10.1007/BF00131174.
Bouchard M., Kneeshaw D., Bergeron Y. (2006). Forest dynamics after successive spruce budworm outbreaks in mixedwood forests. Ecology 87: 2319–2329. http://dx.doi.org/10.1890/0012-9658(2006)87[2319:FDASSB]2.0.CO;2.
Bouchard M., Kneeshaw D., Messier C. (2007). Forest dynamics following spruce budworm outbreaks in the northern and southern mixedwoods of central Quebec. Canadian Journal of Forest Research 37: 763–772. http://dx.doi.org/10.1139/X06-278.
Braithwaite N.T., Mallik A.U. (2012). Edge effects of wildfire and riparian buffers along boreal forest streams. Journal of Applied Ecology 49: 192–201. http://dx.doi.org/10.1111/j.1365-2664.2011.02076.x.
Cadenasso M.L., Pickett S.T., Weathers K.C., Jones C.G. (2003). A framework for a theory of ecological boundaries. BioScience 53: 750–758. http://dx.doi.org/10.1641/0006-3568(2003)053[0750:AFFATO]2.0.CO;2.
Campbell L.J., Laroque C.P. (2007). Decay progression and classification in two old-growth forests in Atlantic Canada. Forest Ecology and Management 238: 293–301. http://dx.doi.org/10.1016/j.foreco.2006.10.027.
Chabrerie O., Jamoneau A., Gallet-Moron E., Decocq G. (2013). Maturation of forest edges is constrained by neighbouring agricultural land management. Journal of Vegetation Science 24: 58–69. http://dx.doi.org/10.1111/j.1654-1103.2012.01449.x.
Chang W-Y., Lantz V.A., Hennigar C.R., MacLean D.A. (2012). Economic impacts of forest pests: a case study of spruce budworm outbreaks and control in New Brunswick, Canada. Canadian Journal of Forest Research 42: 490–505. http://dx.doi.org/10.1139/X11-190.
Côté M. (2000). Dictionary of forestry. Ordre des ingénieurs forestiers du Québec, Les Presses de l’Université Laval, Québec, Canada. 473 p.
D’Aoust V., Kneeshaw D., Bergeron Y. (2004). Characterization of canopy openness before and after a spruce budworm outbreak in the southern boreal forest. Canadian Journal of Forest Research 34: 339–352. http://dx.doi.org/10.1139/X03-278.
Davies-Colley R.J., Payne G.W., van Elswijk M. (2000). Microclimate gradients across a forest edge. New Zealand Journal of Ecology 24: 111–121.
Dupuch A., Fortin D. (2013). The extent of edge effects increases during post-harvesting forest succession. Biological Conservation 162:9–16. http://dx.doi.org/10.1016/j.biocon2013.03.023.
Environment Canada. (2013). National climate data and information archive: Canadian climate normals or averages 1971–2000. http://www.climate.weatheroffice.gc.ca. [Cited 30 March 2013].
Fleming R.A. (2000). Climate change and insect disturbance regimes in Canada’s boreal forests. World Resource Review 12: 521–555.
Fleming R.A., Candau J.N., McAlpine R.S. (2002). Landscape-scale analysis of interactions between insect defoliation and forest fire in central Canada. Climate Change 55: 251–272. http://dx.doi.org/10.1023/A:1020299422491.
Hanson J.J., Stuart J.D. (2005). Vegetation responses to natural and salvage logged fire edges in Douglas-fir/hardwood forests. Forest Ecology and Management 214: 266–278. http://dx.doi.org/10.1016/j.foreco.2005.04.010.
Harper K.A., Macdonald S.E. (2001). Structure and composition of riparian boreal forest: new methods for analyzing edge influence. Ecology 82: 649–659. http://dx.doi.org/10.1890/0012-9658(2001)082[0649:SACORB]2.0CO;2.
Harper K.A., Macdonald S.E. (2002). Structure and composition of edges next to regenerating clear-cuts in mixed-wood boreal forest. Journal of Vegetation Science 13: 535–546. http://dx.doi.org/10.1111/j.1654-1103.2002.tb02080.x.
Harper K.A., Macdonald S.E. (2011). Quantifying distance of edge influence: a comparison of methods and a new randomization method. Ecosphere 2: art94. http://dx.doi.org/10.1890/es11-00146.1.
Harper K.A., Macdonald S.E., Burton P.J., Chen J.Q., Brosofske K.D., Saunders S.C., Euskirchen E.S., Roberts D., Jaiteh M.S., Esseen P.A. (2005). Edge influence on forest structure and composition in fragmented landscapes. Conservation Biology 19: 768–782. http://dx.doi.org/10.1111/j.1523-1739.2005.00045.x.
Harper K.A., Drapeau P., Lesieur D., Bergeron Y. (2014). Forest structure and composition at fire edges of different ages: Evidence of persistent structural features on the landscape. Forest Ecology and Management 314: 131–140. http://dx.doi.org/10.1016/j.foreco.2013.12.009.
Hennigar C.R., MacLean D.A., Porter K.B., Quiring D.T. (2007). Optimized harvest planning under alternative foliage-protection scenarios to reduce volume losses to spruce budworm. Canadian Journal of Forest Research 37: 1755–1769. http://dx.doi.org/10.1139/X07-001.
Holmes R.L., Adams R.K., Fritts H.C. (1986). Tree-ring chronologies of western North America: California, eastern Oregon and northern Great Basin with procedures used in the chronology development work including users manuals for computer programs COFECHA and ARSTAN. Laboratory of Tree-Ring Research, Tuscon, Arizona, USA. 184 p.
Jansson K.U., Nilsson M., Esseen P-A. (2011). Length and classification of natural and created forest edges in boreal landscapes throughout northern Sweden. Forest Ecology and Management 262: 461–469. http://dx.doi.org/10.1016/j.foreco.2011.04.012.
Jönsson M.T., Fraver S., Jonsson B.G., Dynesius M., Rydgård M., Esseen P-A. (2007). Eighteen years of tree mortality and structural change in an experimentally fragmented Norway spruce forest. Forest Ecology and Management 242: 306–313. http://dx.doi.org/10.1016/j.foreco.2007.01.048.
Keenan R.J., Kimmins J.P. (1993). The ecological effects of clear-cutting. Environmental Reviews 1: 121–144.
Lhotka J.M., Stringer J.W. (2013). Forest edge effects on Quercus reproduction within naturally regenerated mixed broadleaf stands. Canadian Journal of Forest Research 43: 911–918. http://dx.doi.org/10.1139/cjfr-2013-0231.
MacLean D.A. (1984). Effects of spruce budworm outbreaks on the productivity and stability of balsam fir forests. The Forestry Chronicle 60: 273–279.
MacLean D.A. (1990). Impact of forest pests and fire on stand growth and timber yield: implications for forest management planning. Canadian Journal of Forest Research 20: 391–404. http://dx.doi.org/10.1139/x90-057.
MacLean D.A., Andersen A.R. (2008). Impact of a spruce budworm outbreak in balsam fir and subsequent stand development over a 40-year period. The Forestry Chronicle 84: 60–69.
MacLean D.A., Ostaff D.P. (1989). Patterns of balsam fir mortality caused by an uncontrolled spruce budworm outbreak. Canadian Journal of Forest Research 19: 1087–1095. http://dx.doi.org/10.1139/x89-165.
Maser C., Anderson R.G., Cromack Jr. K., Williams J.T., Martin R.E. (1979). Dead and down woody material. In: Thomas J.W. (ed.). Wildlife habitats in managed forests: the Blue Mountains of Oregon and Washington. U.S. Department of Agriculture Forest Service, Portland, Oregon. USA. p. 60–77.
McDonald R.I., Urban D.L. (2004). Forest edges and tree growth rates in the North Carolina Piedmont. Ecology 85: 2258–2266. http://dx.doi.org/10.1890/03-0313.
McIntire E.J.B., Fortin M.J. (2006). Structure and function of wildfire and mountain pine beetle forest boundaries. Ecography 29: 309–318.
Morin H. (1994). Dynamics of balsam fir forests in relation to spruce budworm outbreaks in the boreal zone of Quebec. Canadian Journal of Forest Research 24: 730–741. http://dx.doi.org/10.1139/x94-097.
Neily P.D., Quigley E., Benjamin L., Stewart B., Duke T. (2003). Ecological land classification for Nova Scotia (Volume 1 – Mapping Nova Scotia’s terrestrial ecosystems). Nova Scotia Department of Natural Resources, Halifax, Nova Scotia, Canada. 83 p.
Nova Scotia Department of Natural Resources. (2009). Aerial photography collection. Available from Nova Scotia Department of Natural Resources, Halifax, Nova Scotia, Canada.
Ostaff D.P., MacLean D.A. (1989). Spruce budworm populations, defoliation, and changes in stand condition during an uncontrolled spruce budworm outbreak on Cape Breton Island, Nova Scotia. Canadian Journal of Forest Research 19: 1077–1086. http://dx.doi.org/10.1139/x89-164.
Parks Canada. (2010). Cape Breton Highlands National Park of Canada management plan. Cape Breton Highlands National Park of Canada, Ingonish Beach, Nova Scotia, Canada. 70 p.
Riutta T., Slade E.M., Bebber D.P., Taylor M.E., Malhi Y., Riordan P., Macdonald D.W., Morecroft M.D. (2012). Experimental evidence for the interacting effects of forest edge, moisture and soil macrofauna on leaf litter decomposition. Soil Biology and Biochemistry 49: 124–131. http://dx.doi.org/10.1016/j.soilbio.2012.02.028.
Royama T. (1984). Population dynamics of the spruce budworm Choristoneura fumiferana. Ecological Monographs 54: 429–462. http://dx.doi.org/10.2307/1942595.
Spence C.E., MacLean D.A. (2012). Regeneration and stand development following a spruce budworm outbreak, spruce budworm inspired harvest, and salvage harvest. Canadian Journal of Forest Research 42: 1759–1770. http://dx.doi.org/10.1139/X2012-121.
Valbuena R., Packalen P., Martin-Fernandez S., Maltamo M. (2012). Diversity and equitability ordering profiles applied to study forest structure. Forest Ecology and Management 276: 185–195. http://dx.doi.org/10.1016/j.foreco.2012.03.036.
Webb K.T., Marshall I.B. (1999). Ecoregions and ecodistricts of Nova Scotia. Agriculture and Agri-Food Canada, Truro, Nova Scotia, and Environment Canada, Hull, Quebec, Canada. 39 p. .
Wicklein H.F., Christopher D., Carter M.E., Smith B.H. (2012). Edge effects on sapling characteristics and microclimate in a small temperate deciduous forest fragment. Natural Areas Journal 32:110–116.
Zhao K., MacLean D.A., Hennigar C.R. (2014). Spatial variability of spruce budworm defoliation at different scales. Forest Ecology and Management 328: 10–19. http://dx.doi.org/10.1016/j.foreco.2014.05.020.
Total of 52 references
Send to email
