Andreas Kreutz,
Tuomas Aakala  ,
Russell Grenfell,
Timo Kuuluvainen
,
Russell Grenfell,
Timo Kuuluvainen
Spatial tree community structure in three stands across a forest succession gradient in northern boreal Fennoscandia
Kreutz A., Aakala T., Grenfell R., Kuuluvainen T. (2015). Spatial tree community structure in three stands across a forest succession gradient in northern boreal Fennoscandia. Silva Fennica vol. 49 no. 2 article id 1279. https://doi.org/10.14214/sf.1279
Highlights
- We studied the tree community spatial structure in three 1.2-ha plots representing naturally developed northern boreal forests of varying ages
- Spatial structure showed little differences between the mid-successional, late-successional and old-growth stands
- The occurrence of Picea abies relative to Betula spp. indicated a mosaic-like spatial assembly
- Mosaics are likely maintained by species-specific replacement, not reciprocal replacement as thought earlier.
Abstract
Development of species composition during succession is well studied in natural boreal forests, but empirical assessments of how within-stand spatial structure develops in late-successional stages are few. Here, we quantified spatial patterns in three unmanaged stands consisting of Picea abies (L.) Karst. and Betula pubescens Ehrh. and Betula pendula Roth (hereafter Betula spp.) in northern boreal Fennoscandia. We conducted a comprehensive analysis of small-scale spatial point patterns in three fully mapped 1.2-ha sample plots, representing different forest developmental stages: mid-successional, late-successional and old-growth forest. We used several variants of Ripley’s K-function to analyze the spatial point patterns along the successional gradient. Univariate analyses showed that mature trees of both species were either randomly distributed or clumped. P. abies saplings were clumped, and Betula spp. saplings occurred in a random or clumped manner. In the bivariate analyses, saplings were more likely to be found in the surroundings of mature trees of the same species, but occurred independent of the individuals of other tree species. Mature trees showed interspecific repulsion. Only modest differences occurred in the univariate patterns between the three successional stages, but in the bivariate analyses the most evident patterns, i.e. intraspecific attraction and interspecific repulsion, were stronger in the older successional stages. Overall, the studied stands appear structured as species-specific mosaics. These mosaics, along with mixed species composition, seem to be maintained by species self-replacement, which contrasts with findings from earlier studies.
Keywords
Picea abies;
age structure;
spatial structure;
natural forest;
Betula spp.;
point pattern analysis;
northern boreal;
community composition
- Kreutz, Department of Forest Sciences, University of Helsinki, P.O. Box 27, FI-00014 University of Helsinki, Finland E-mail andreas.kreutz@wald-rpl.de
-
Aakala,
Department of Forest Sciences, University of Helsinki, P.O. Box 27, FI-00014 University of Helsinki, Finland
 http://orcid.org/0000-0003-0160-6410
E-mail
tuomas.aakala@helsinki.fi
http://orcid.org/0000-0003-0160-6410
E-mail
tuomas.aakala@helsinki.fi
- Grenfell, Department of Forest Sciences, University of Helsinki, P.O. Box 27, FI-00014 University of Helsinki, Finland E-mail russell.grenfell@gmail.com
- Kuuluvainen, Department of Forest Sciences, University of Helsinki, P.O. Box 27, FI-00014 University of Helsinki, Finland E-mail timo.kuuluvainen@helsinki.fi
Received 19 November 2014 Accepted 30 March 2015 Published 4 May 2015
Views 204277
Available at https://doi.org/10.14214/sf.1279 | Download PDF

1 Introduction
Spatial patterns of forest trees influence ecological processes, such as tree-tree interactions, and resource and habitat distributions (Pacala and Deutschman 1995; Canham et al. 2004). These patterns are known to change during stand development, but the boreal forest has rarely been subject to spatial analyses of structural attributes during their successional development (Leemans 1991; Bartemucci et al. 2002; Lilja et al. 2006). A better understanding of the long-term spatial dynamics in boreal forests would contribute to understanding factors that affect stand development (Malkinson et al. 2003; Harper et al. 2006), particularly how tree species composition develops late in succession (Doležal et al. 2006). Knowledge concerning these driving factors is needed for developing tools and guidelines for nature conservation (Davis et al. 2000), restoration, and forest management that aims to mimic the natural range of variability in the structural characteristics of forested ecosystems (Angelstam 1998).
Current understanding of stand structural development maintains that, following a stand-replacing disturbance, characteristics of the colonizing plant community depend on the availability of substrates, growth resources, and the seed production and regeneration strategies of constituent plant species (Oliver and Larson 1990; Franklin et al. 2002). Soon following the initial colonization stage, tree individuals enter a competitive stage in which competition between trees is the main process driving patterns of stand development. This has been suggested to result in a regular pattern in the plant community, especially in single-species communities (Kershaw 1963; Kenkel 1988; however, see Lepš and Kindlmann 1987). As the stand matures, tree senescence and disturbances gain in importance as drivers of stand dynamics and spatial structure, i.e. gap dynamics (McCarthy 2001). Given sufficient time without stand-replacing disturbances, new regeneration in gaps and competition among these newly established younger trees begin to shape the stand structure. These gap-phase processes should then result in clumped tree distributions (Bormann and Likens 1979). However, there are few empirical tests of these general ideas of spatial structure development, and hence little agreement on the development of spatial tree patterns at different successional stages (Greig-Smith et al. 1963; Kershaw 1963; Szwagrzyk 1990; Szwagrzyk and Czerwczak 1993; Antos and Parish 2002).
Forests growing on Hylocomium-Myrtillus site type (sensu Cajander 1926) cover large areas of mesic sites in northern Fennoscandia. In late-successional stages, these forests are characterized by a thick poorly decomposed humus layer, and tend to form structurally diverse mixed stands dominated by Picea abies (L.) Karst. and Betula pubescens Ehrh. and Betula pendula Roth (hereafter Betula spp.) (Lakari 1920). The development of the tree species composition is generally known from earlier studies: Following a stand-replacing disturbance (usually fire), these stands are dominated by Betula spp. This high proportion of Betula spp. decreases with time and the understory P. abies gains in dominance (Sirén 1955). However, Betula spp. is able to maintain its presence even in the oldest stands, especially through its capability for vegetative reproduction, i.e. sprouting (Heikinheimo 1922). In late-successional stages, gap dynamics begin to dominate and contribute to the relative stability of these forests (Fraver et al. 2008; Aakala et al. 2009). Even if stands in the late-successional stages are structurally diverse and often locally sparse, competition continues to play a role in structuring these populations in the harsh northern environment (Fraver et al. 2014).
Although numerous studies have described how species composition develops with succession in species-poor boreal forests, the development of their spatial structure has remained much more elusive, compared to more southern, closed-canopy forests. This is in part due to the strong horizontal heterogeneity in stand structure; regeneration appears primarily dependent on small-scale disturbances creating suitable seedbeds in the thick raw humus layer (Aaltonen 1919; Kuuluvainen and Ylläsjärvi 2011), and less on the changes in the understory light environment following the death of overstory trees (Bartemucci et al. 2002), as suggested by the classical gap dynamics theory (McCarthy 2001). Hence, it is unclear how well the generalities of spatial pattern development suggested for closed-canopy forests apply to these more open boreal forest types. Among the few studies conducted, Doležal et al. (2006) concluded that with time, unmanaged Hylocomium-Myrtillus stands develop into a mosaic of small monospecific patches of Betula spp. and P. abies trees that undergo reciprocal replacement (i.e., P. abies regenerates under Betula spp., and versa).
Here, we focus specifically on the differences in spatial structure within- and among tree species in stands with varying time since fire occurrence from mid-successional to old-growth forests. Using large (1.2 ha) fully mapped plots in unmanaged Hylocomium-Myrtillus type stands, we quantified (1) the spatial structure of the overall tree community, (2) the spatial patterns of saplings and mature trees, and (3) the spatial relationships between P. abies and Betula spp. We then (4) assessed whether these patterns differ between the stands of different successional stages.
2 Material and methods
2.1 Study area and site characteristics
The study was carried out in the Värriö Strict Nature Reserve in the northern boreal zone in northeastern Finland (67°44´N, 29°38´E, Fig. 1). The average annual temperature (measured at the nearby Värriö Subarctic Research Station) of the last 20 years has been –0.5 °C. Gneiss complexes dominate the bedrock in the reserve (Korsman et al. 1997). The forests in the reserve have never been logged, and access to the reserve is prohibited with the exception of local residents and reindeer herders. The main anthropogenic impact is due to reindeer herding, which can influence the composition of ground vegetation and tree regeneration (Susiluoto et al. 2008). Although the impact of reindeer specifically in our study area has not been documented, casual field observations suggested that reindeer grazing hampers the regeneration and survival of seedlings and saplings of deciduous species.
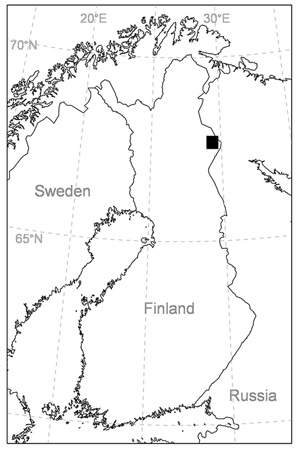
Fig. 1. Study area location in the Värriö strict nature reserve in northern Finland.
Within the reserve, we used Metsähallitus (formerly the Finnish Forest and Park Service) stand compartmental data derived from aerial photographs for a preliminary selection of candidate stands that could serve as a chronosequence, by defining different successional stages of the forest based on the proportion of Betula spp. trees (cf. Sirén 1955). Based on field visits, we selected three of these candidate stands for sampling in summer 2011. The selected stands were located on flat terrain, and were visually judged to be edaphically homogeneous. Stand A was dominated by Betula spp., stand B was a mixed P. abies-Betula spp. stand and stand C was dominated by P. abies. All stands were classified in the field as growing on Hylocomium-Myrtillus site type according to the Finnish site classification system based on ground- and bottom-layer species composition (Cajander 1926).
2.2 Field sampling
We initially ranked the stands into three different successional stages, based on their species composition. To verify that these indeed represented a sequence of successional stages, we collected increment cores to determine the minimum time since the last stand-replacing disturbance (henceforth: stand age), usually fire in these forests. We extracted samples from dominant (2/3rd of the sample) trees within the stands. Co-dominant and intermediate (1/3rd of the sample) trees in close proximity to the dominant trees were also cored to account for the shade tolerance of P. abies. As forest fires are the typical stand-replacing disturbance, we searched the nearby area for fire scars on pines that might have survived past fires.
We established a randomly located and aligned plot of 1.2 ha (40 m × 300 m) in the interior of each stand. We chose to use such large elongated plots to capture the variability typical to structurally heterogeneous boreal forests. Within these plots, we measured all standing living trees with a height of at least 1.3 m and a diameter at breast height (DBH) of at least 1 cm. Dead trees were included if their DBH was at least 10 cm. We recorded the coordinates of each tally tree as the distance along the bisect line from the starting point and the perpendicular distance from the bisect line of the transect. Tally tree measurements included species, DBH (measured 1.3 m aboveground to the closest cm; the DBH of stumps was measured using the log), height, lower crown limit, and crown radii (estimated to the closest 0.5 m). We furthermore classified the trees according to structural classes (intact standing, snapped ≥ 1.3 m or stumps) and health status (living or dead). We assigned stems that sprouted from one stump the same x- and y-coordinates as the mother tree. We considered stump sprouts with a DBH < 5 cm as part of the mother trees. The tree’s perpendicular distance from the bisect line, height and lower crown limit were measured using a Vertex device (Haglöf AB, Långsele, Sweden).
To characterize the vegetation composition of the studied stands by species cover, we sampled four 20 m × 20 m subplots from within the larger plots for vegetation data (Zhu et al. 2009). We conducted a complete floristic inventory for the bottom and field stratum (0 to 0.5 m height), shrub stratum (0.5 to 5 m height) and tree stratum (> 5 m height) in each of these vegetation subplots. The cover of each species was visually estimated as percent canopy/floor cover within each subplot/quadrat to the nearest 5%.
2.3 Data analyses
To determine the minimum stand ages, we mounted the collected increment cores and sanded them to a fine polish, using standard methods (Phillips 1985). For each core, we measured ring widths to the nearest 0.01mm, using a stereomicroscope and a sliding stage (Velmex, Inc., Bloomfield, USA). For cores missing the pith, we determined the number of missing rings based on the average growth of the 15 innermost rings, and the curvature of the last ring (Applequist 1958). We visually cross-dated the tree-ring series (Yamaguchi 1991), using master chronologies from northern Fennoscandia (Aakala et al. 2009; Wallenius et al. 2010), and verified measurement quality statistically, using the COFECHA-program (Holmes 1983). Since P. abies-dominated boreal forest stands are prone to severe forest fires, we assumed the oldest verified tree age within a stand to represent the minimum time since the last stand-replacing fire (Wallenius et al. 2005). We added five years to the year of the innermost ring, as a conservative estimate of the time it takes to reach the sampling height. Betula spp. ages were based on ring counts, as we lacked a proper master chronology to cross-date them to the year. In addition to the tree age-samples, we found a Pinus sylvestris L with two fire scars located near stands A and B.
We analyzed the fully mapped plot data, using common uni- and multivariate spatial point pattern analyses. For these analyses, we divided the trees into two groups: mature trees (DBH > 10 cm), and saplings (DBH ≤ 10 cm). Maximum inter-tree distance in the analyses was 10 m, to reduce the edge effects due to the elongated shape of the sample plot. We assumed stationarity and isotropy of the observed point processes, based on our stand selection procedure that aimed to avoid apparent edaphic gradients, and visual examination (see also Fig. 2). For isotropy (i.e. the distance in one direction that has the same effect as a distance in another direction), we assumed that the processes involved in determining the spatial structure of these populations (regeneration, growth, survival) have no directional components. We discarded P. sylvestris from the analyses due to its very low proportion in the total stem number (< 2%) in all three stands. For all spatial analyses, we used R and the package SPATSTAT (Baddeley and Turner 2005); R version 2.12.0, (R Development Core Team 2011).
As a first step in the spatial pattern analysis we used the Kolmogorov-Smirnov (KS) test, to test against complete spatial randomness (CSR) of the data (Baddeley 2008). Rejection of the null hypothesis (αcrit = 0.05, p = 0.027, p < 0.0001 and p = 0.024 in stands A, B and C respectively) warranted further analysis of the data.
For the point pattern analyses, we used the square root transformation of the univariate K(t)-function L(t), with isotropic edge correction (Ripley 1977; Diggle 2003). We further analyzed bivariate point patterns (mature trees vs. saplings, within and between species), using the square root transformation Lij(t) of the bivariate Kij(t)-function (Goreaud and Pelissier 2003).
To test for the significance of departures from random (for univariate analyses) and departures from population independence (in bivariate analyses; e.g. Goreaud and Pelissier 2003) we compared the functions generated from the point pattern data with corresponding theoretical functions under CSR generated by 999 Monte Carlo simulations (Diggle 2003). Critical values for the hypothesis test, represented by global significance envelopes, were created for a significance level α = 0.05. An observed process is assumed to be different from the uniform Poisson point process if the results exceed the envelope at any distance t (Loosmore and Ford 2006). To account for a possible underestimation of the type I error as brought forward by Loosmore and Ford (2006), we calculated the significance envelopes in a simultaneous manner in R (Baddeley and Turner 2005). The probability that the result exceeds the simultaneous confidence envelope at any distance t is exactly α (Baddeley and Turner 2005).We visualized the structure of the examined stands (Fig. 2), using the Stand Visualization Software (McGaughey 1999), which is a freeware provided by the USDA Forest Service, Pacific Northwest Research Station. The system generates graphic realistic images of log and plant components based on a list of individual stand components.
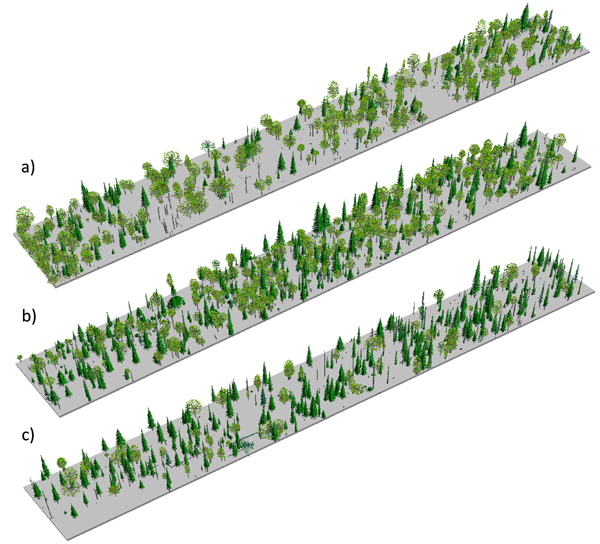
Fig. 2. Stand visualizations for the mid-successional (a), late-successional (b), and old-growth (c) stands.
3 Results
3.1 Age and size structure of the stands and time since the last fire
The studied stands were characterized by fairly open canopies (Fig. 2), and the species compositions measured in the field were consistent with preliminary stand selection criteria (Fig. 3). All three stands were uneven-aged (Fig. 3). In stand B we found a single P. abies tree that was clearly older than the rest of the population (approximately the same age as the old trees in stand C; Fig. 3a), but otherwise the three stands were distinguishably of different age (Fig. 3b); based on tree ring analyses, the minimum times since the last stand-replacing disturbance were 180 (stand A), 270 (stand B) and 350 years (stand C). Thus, we will refer to stands A, B and C hereafter as mid-successional, late successional and old-growth, respectively. These estimates of time since the last stand-replacing disturbance were complemented with the two fire scar dates from the solitary P. sylvestris found close to the mid- and late-successional stands. We dated the two fires to 1700 and 1831. Due to patchiness common to forest fires, it is uncertain whether these fires burnt our study sites, but the former age is consistent with a delayed regeneration of P. abies under a pioneer Betula spp. in the late-successional stand, and the age of the oldest trees in the Betula spp.-dominated mid-successional stand coincides with the latter fire. We found no evidence of fires in or near the old-growth stand and it is likely that the stand is much older than the estimated 350 years, which is usually considered the maximum age attainable to P. abies.
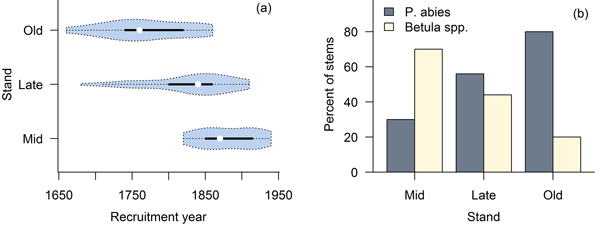
Fig. 3. Violin plots (Hintze and Nelson 1998) combining a boxplot and density trace of age distributions (a), and species compositions in the three stands (b).
The shape of P. abies diameter distributions varied between the three stands (Fig. 4 a–c). In the mid-successional stand, small saplings (< 5 cm DBH) were the most abundant, and tree numbers dropped in the larger size classes (although with a local maxima at the 10–15 cm class). In the late-successional stand tree numbers were high up to 15 cm DBH, and dropped in larger classes. In the old-growth stand tree numbers were fairly constant up to 30 cm DBH. Diameter distributions in the late-successional and old-growth stand hence resembled a rotated sigmoid (i.e., with a plateau or an increase in the mid-diameter distribution range), whereas the mid-successional stand was something between a reverse-J and a rotated sigmoid.
Betula spp. showed a unimodal distribution in all stands (Fig. 4 d–f), with maximum frequencies in mid-sized trees (between 10 and 20 cm classes, depending on the stand). Large Betula stems were rare, and saplings (DBH < 10 cm) were also clearly scarcer than mid-sized trees. Dead tree sizes were normally distributed for both species and all three stands. The numbers of dead P. abies stems increased from mid-successional to old-growth, while the pattern for Betula spp. was the opposite.
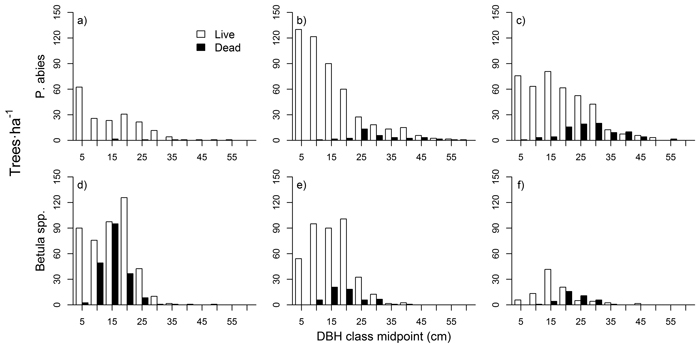
Fig. 4. Tree diameter distributions for P. abies in mid-successional (a), late-successional (b), and old-growth (c) stands, and for Betula spp. in mid-successional (d), late-successional (e), and old-growth stands (f).
3.2 Spatial patterns
Overall, the univariate analyses showed a tendency for clumped distributions (Fig. 5). Whether this clumping deviated significantly from the random, varied according to the data subset analyzed. Living P. abies trees were significantly clumped (Table 1; n = 199, n = 553, n = 466 in mid-, late-successional and old-growth stands, respectively). When analyzed separately, mature P. abies trees were randomly distributed in the mid-successional (n = 99) and late-successional (n = 273) stands, but were clumped at short distances (1–4.5 m) in the old-growth stand (n = 306). Mature P. abies trees in the mid-successional stand showed the only deviations towards a regular distribution in any of the data subsets analyzed. These deviations were confined to small inter-tree distances, but did not differ significantly from the random. In contrast to mature trees, P. abies saplings were significantly clumped, except for the smallest inter-tree distances (Fig. 5 and Table 1; n = 100, n = 280, n = 160 in mid-, late-successional and old-growth stands, respectively).
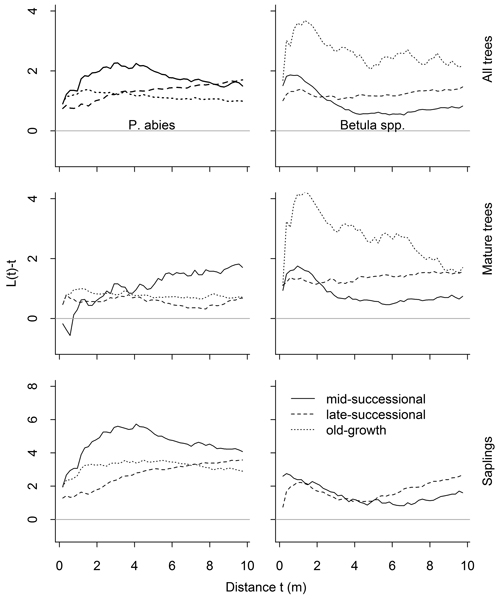
Fig. 5. Results of the univariate spatial point pattern analyses L(t), for all trees, mature trees and saplings, and separately for both species. The expected value under complete spatial randomness is zero. Positive deviations indicate clustering, negative regularity. Significant deviations are shown in Table 1. There were only 13 Betula spp. saplings in the old-growth forests so we dropped them from the analyses.
| Table 1. Results of the point pattern analyses. Values in parentheses represent distances at which departures from the observed pattern deviated significantly from the random (univariate analyses) or independent (bivariate analyses). Alternatives were clumping (cl) for univariate analyses, and attraction (at) or repulsion (re) for bivariate analyses. There were only 13 Betula spp. saplings in the old-growth stand, which were thus dropped from the analyses (NA). | ||||
| Analysis | Groups | Mid-successional | Late-successional | Old-growth |
| Univariate | ||||
| All P. abies | cl (1–10) | cl (0–10) | cl (0–10) | |
| All Betula spp. | cl (0–3.5; 9–10) | cl (0–10) | cl (0.5–2.5) | |
| Mature P. abies | - | - | cl (1–4.5) | |
| Mature Betula spp. | cl (0–2.5) | cl (0–10) | - | |
| P. abies saplings | cl (1–10) | cl (1–10) | cl (1–10) | |
| Betula spp. saplings | - | cl (0.5–2.5; 6.5–10) | NA | |
| Intraspecific | ||||
| P. abies mature saplings | - | at (1–10) | at (0–10) | |
| Betula spp. mature saplings | at (0–3.5) | at (0–10) | NA | |
| Interspecific | ||||
| All P. abies – all Betula spp. | at (7–10) | - | - | |
| Mature P. abies – mature Betula spp. | - | re (3–8) | re (2–2.5) | |
| Mature P. abies – Betula spp. saplings | re (1–2) | - | NA | |
| P. abies saplings – mature Betula spp. | - | - | - | |
When size classes were pooled, Betula spp. were significantly clumped. This clumping was strongest in the old-growth stand (n = 82), but was significant only at short inter-tree distances (0.5–2.5 m; Fig. 5). When we analyzed mature Betula spp. separately, similar tendencies towards clumping were evident in the mid-successional (n = 236) and late-successional stands (n = 235). The number of Betula spp. in the old-growth stand was lower (n = 69), and they were randomly distributed. Betula spp. saplings, on the other hand, were randomly distributed in the mid-successional stand (n = 105). In the late-successional stand (n = 135), the distributions were clumped at distances of 0.5–2.5 m and then again from 6.5–10 m (Fig. 5, and Table 1). We recorded only 13 Betula spp. saplings from the old-growth stand precluding meaningful point pattern analyses.
Intraspecific analyses between size-classes (i.e. P. abies trees vs. saplings, and Betula spp. trees vs. saplings) showed significant attraction between trees and saplings up to 10-m inter-tree distances in late-successional and old-growth stands (Fig. 6). This attraction was confined to small scales (up to 3.5 m) in the mid-successional stand for Betula spp., while P. abies saplings were distributed independent of mature trees (Fig. 6).
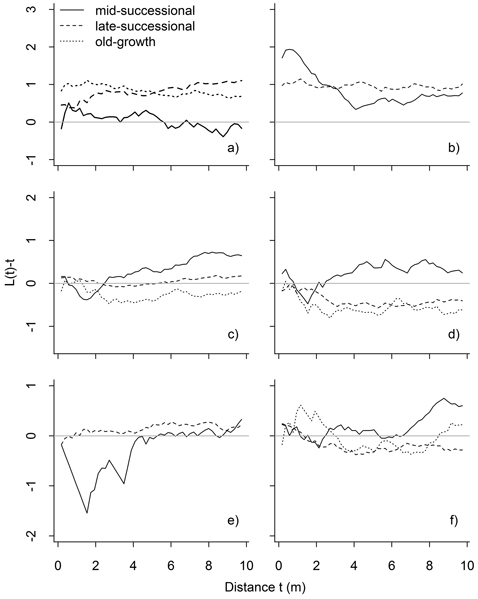
Fig. 6. Results of bivariate point pattern analyses, in which the expected value under population independence is zero. Values above zero indicate attraction, and below zero repulsion: mature P. abies vs. P. abies saplings (a), mature Betula spp. vs. Betula spp. saplings (b), all P. abies vs. all Betula spp. (c), mature P. abies vs. mature Betula spp. (d), mature P. abies vs. Betula spp. saplings (e), and mature Betula spp. vs. P. abies saplings (f). Significant deviations are shown in Table 1.
Interspecific patterns varied between stands and size classes. Mature P. abies and mature Betula spp. occurred independent of one another in the mid-successional stand, but these patterns were different in late-successional and old-growth stands: in both stands mature trees showed significant interspecific repulsion in the late-successional (3–8 m) and old-growth stand (significant at 2–2.5 m, but also with a non-significant tendency later on: Fig. 6). Saplings of both species occurred independent of the mature individuals of the other species. The exceptions to this were Betula spp. saplings in the mid-successional stand that were repulsed from mature P. abies at short inter-tree distances (1–2 m).
4 Discussion
The successional development of natural boreal forests has previously been described especially in terms of tree species composition changes (Sirén 1955; Lilja et al. 2006). These changes are driven to a large extent by varying life-history strategies of different species and are hence qualitatively rather predictable in the tree species-poor boreal forest. The development of other tree community properties, especially spatial patterns, but also to some extent the development of tree size distributions, is much less straightforward and results have varied in earlier studies.
Our findings on tree size distributions differ from the traditional reverse-J distribution expected in natural old-growth forests (Linder et al. 1997; Linder 1998; McCarthy and Weetman 2006). However, they fit the findings from a number of recent studies from the Fennoscandian boreal forest: diameter distributions of living P. abies mostly resembled the rotated sigmoid distribution (Linder et al. 1997; Doležal et al. 2006; Lilja et al. 2006). These types of diameter distributions for live trees are often explained by variable mortality rates between trees of different sizes: medium-diameter classes represent a stage in which the trees have escaped the competition stage and are not yet vulnerable to size-related mortality (Goff and West 1975; Linder 1998; Fraver et al. 2008). However, another less-acknowledged factor is the differing diameter growth rates between trees of different sizes: even if biomass increment rates tend to increase with tree size (Stephenson et al. 2014), diameter increase is the fastest with smallest trees owing to a rapidly changing diameter compared to basal area. Hence, the residence times in various size classes differ. Residence time-differences related to wood decomposition also explain the detected unimodal distribution of dead trees: even if mortality rates for mid-sized trees were lower than for smaller trees, mid-sized trees are more persistent compared to rapidly disappearing finer woody debris.
Betula spp. diameter distributions were, visually judged, best characterized by a unimodal distribution in all successional stages, as also described by Ylläsjärvi and Kuuluvainen (2009) in the same forest type. For Betula spp., the lower number of saplings is consistent with the species’ pioneer strategy and the absence of large-scale disturbances in the area, as the proportion of Betula spp. has been shown to decrease with time since the last stand-replacing disturbance (Sirén 1955). The high reindeer density in the region is further likely to keep Betula spp. seedling and sapling populations low.
Spatial tree distributions were primarily clumped in all three stands of different successional stages. Our sampling was limited to only a single stand in each successional stage, thus limiting the possibility to make generalizations concerning successional development. The univariate analyses nevertheless revealed no such differences in spatial patterns between the stands that would be expected based on idealized models of stand development (i.e., increased clumping with stand age; Busing 1991). A tendency towards stronger clumping was observed in the late-successional and old-growth stands for Betula spp. compared to the mid-successional stand, but the decreasing sample size hampered the power of these analyses.
The spatial distribution of saplings and young trees is the combined result of successful regeneration and early survival. In our sites, P. abies saplings (DBH ≤ 5 cm) were clumped throughout the analyzed inter-tree distances. This clumping of young trees was similar to results of Grenfell et al. (2011) in the same forest type in northwestern Russia and northwestern Finland. A potential explanation for these findings is the availability of regeneration microsites: as the thick humus layer outside the disturbed microsites is a poor seedbed (Johnstone and Chapin 2006), sites with a disturbed raw humus layer, highly decayed logs as well as the crown periphery around large trees can function as important regeneration microsites (Aaltonen 1919; Sirén 1955; Grenfell et al. 2011). High regeneration rates per unit area on these disturbed microsites results in clumped patterns in regeneration (Manabe et al. 2000).
The clumping of Betula spp. saplings was less pronounced in our results than the clumping of P. abies saplings. Vegetative reproduction is important in high-latitude forests, especially for Betula spp. in Hylocomium-Myrtillus -type forests (Heikinheimo 1922). Stump sprouts would naturally lead to clumped patterns, and hence our findings partly reflect the exclusion of stump sprouts from the spatial analyses that focused on individual stems (i.e., saplings sprouting from the stump of the mother tree were considered part of the mother tree). Similar to P. abies, Betula spp. regeneration from seeds in these forests tends to require disturbed microsites, such as exposed mineral soil or decayed logs. Although the two species appear to have some separation in their regeneration niches (Grenfell et al. 2011), Betula spp. regeneration in these forests faces an additional constraint in the form of intensive browsing by reindeer. How this browsing pressure influences the development of spatial patterns over the long-term is unknown (i.e. which trees survive), but the primarily random spatial distribution, as well as the relative rareness of Betula spp. in the old-growth stand is to some extent probably attributable to reindeer influence on early tree survival.
The spatial distribution of mature trees is the result of the same initial process as for saplings, but additionally includes later growth and survival in competition with neighboring trees. When we analyzed mature trees separately the results varied between the populations analyzed, but were consistent with earlier studies (Kuuluvainen et al. 1996; Doležal et al. 2006): distributions of mature P. abies in natural stands varied between random and small-scale clumping.
Mature Betula spp. were clumped in mid- and late-successional stands, but occurred randomly in the old-growth stand. It is likely that clumping at small scales is attributable to the vegetative regeneration strategy: if this is the dominant regeneration strategy it should result in clumped regeneration, and subsequently maintain the clumping of mature trees over the long-term. The random pattern in the old-growth stand is at least partly related to the low number of observations, which could result from long-term thinning in the absence of new regeneration.
Permanent plot data sets that would allow properly testing the influence of specific processes, such as competition on spatial patterns, are rare or non-existent in northern boreal old-growth forests. The findings from our one-time measurement nevertheless offered little support for the classical idea of competition as a major structuring process. This idea holds that a significant regular distribution is the result of density-dependent mortality and is considered an indicator of competition between tree individuals, especially in monospecific stands (Kershaw 1963; Kenkel 1988; Doležal et al. 2006), but none of the analyses we conducted indicated deviations from the random towards regularity. We consider it conceivable that when regeneration is limited to specific substrates, such as exposed mineral soil or decomposed logs, it leads to highly clumped regeneration, and competitive interactions thus operate primarily at very small scales. With elapsing time, competitive interactions may steer this pattern towards regularity within these clumps (Kenkel 1988). Between these small-scale clumps, due to the low overall stand density, there is a lack of sufficient density-dependent mortality (Getzin et al. 2006), so that competitive interactions, although present (Fraver et al. 2014), are not strong enough to be the main determinant of spatial distribution.
In the intraspecific bivariate analyses, the attraction between Betula spp. saplings and mature Betula spp. detected in all three stands was consistent with the vegetative regeneration strategy. However, similar intraspecific attraction between trees and saplings was also clear for P. abies in the late-successional and old-growth stands. Attraction without vegetative regeneration can result from a number of non-exclusive processes, such as seed dispersal close to the mother tree, or facilitation (i.e., a process whereby the presence of an individual enables the establishment and growth of further individuals; Armesto et al. 1986). Facilitation could result for instance from the mother tree’s influence on nutrient availability in the close surroundings (Hirabuki 1991). In sparse, high-latitude forests, Kullman (2007) has suggested an additional mechanism: the so-called black body effect, by which larger trees influence snow melt in their vicinity, which increases growing season length locally. That we detected attraction between mature trees and saplings also explains the shape of the univariate L-function for mature P. abies: the pronounced clumping at small inter-tree distances may have its origins in saplings regenerating close to mature trees, and as they grow in size, result in the clumping of mature trees, which becomes more pronounced with time.
In interspecific analyses, mature P. abies and Betula spp. trees showed a tendency towards repulsion, meaning that it is less likely to find a mature P. abies around a Betula spp. than expected by chance. This repulsion was weakest in the mid-successional stand, intermediate in the late-successional stand, and strongest in the old-growth stand. Predominantly clumped distributions in univariate analyses of mature P. abies and Betula spp., and repulsive interactions between mature P. abies and Betula spp. combined suggests the species tend to occur closer to their conspecifics. This finding is similar to Doležal et al. (2006), who reported a mosaic of small patches of P. abies and Betula spp. in Hylocomium-Myrtillus -forests, and is also in line with the intraspecific attraction detected for both species.
Although our results on patch formation (i.e., that it is more likely to find both species close to their conspecifics) were in line with earlier findings, our results contradicted with those concerning the likely development of these patches: Doležal et al. (2006) suggested reciprocal replacement with time, deduced from the observed attraction between P. abies saplings and mature Betula spp. This is considered a result of resource facilitation, where Betula spp. with its fast decomposing litter locally improves nutrient status, allowing P. abies to colonize the site (Perala and Alm 1990; Doležal et al. 2006). However, our results suggest species self-replacement: in addition to conspecifics (including mature trees and saplings) occurring close to one another, the saplings of one species were either independent or likely found close to mature trees of the other species.
5 Conclusions
In this study we described the small-scale spatial patterns of trees in three unmanaged northern boreal forests, representing different successional stages. The observed patterns were predominantly clumped for both P. abies and Betula spp., and saplings of both species were predominantly attracted to mature trees of the same species. This attraction between saplings and mature trees and the repulsion between mature P. abies and mature Betula spp. suggests single-species clumps, i.e. a small-scale mosaic structure consisting of small patches of P. abies and Betula spp. Although our analysis was limited to a single stand in each of the three successional stages, the results challenge earlier findings by suggesting that the mosaic structure is maintained through species self-replacement, not reciprocal replacement. The mosaic structure was weakest in the youngest stand and strongest in the oldest stand, but otherwise there were little differences between the studied stands that could be attributed to successional change.
Acknowledgements
We thank two anonymous reviewers for their constructive comments. The study was financially supported by the Academy of Finland (proj. no. 252629 and 276255). Tree data is available online at http://dx.doi.org/10.6084/m9.figshare.1360178.
References
Aakala T., Kuuluvainen T., Wallenius T., Kauhanen H. (2009). Contrasting patterns of tree mortality in late-successional Picea abies stands in two areas in northern Fennoscandia. Journal of Vegetation Science 20: 1016–1026. http://dx.doi.org/10.1111/j.1654-1103.2009.01100.x.
Aaltonen V.T. (1919). On the natural regeneration of dry heath forests in Finnish Lapland. Communicationes Instituti Forestalis Fenniae 1. 319 p.
Angelstam P.K. (1998). Maintaining and restoring biodiversity in European boreal forests by developing natural disturbance regimes. Journal of Vegetation Science 9: 593–602. http://dx.doi.org/10.2307/3237275.
Antos J.A., Parish R. (2002). Dynamics of an old-growth, fire-initiated, subalpine forest in southern interior British Columbia: tree size, age, and spatial structure. Canadian Journal of Forest Research 32: 1935–1946. http://dx.doi.org/10.1139/x02-116.
Applequist M. (1958). A simple pith locator for use with off-center increment cores. Journal of Forestry 56: 141.
Armesto J., Mitchell J., Villagran C. (1986). A comparison of spatial patterns of trees in some tropical and temperate forests. Biotropica 18: 1–11. http://dx.doi.org/10.2307/2388354.
Baddeley A. (2008). Analysing spatial point patterns in R. Workshop notes, version 3. http://www.csiro.au/resources/Spatial-Point-Patterns-in-R.html.
Baddeley A., Turner R. (2005). Spatstat: An R package for analyzing spatial point patterns. Journal of Statistical Software 12: 1–42.
Bartemucci P., Coates K.D., Harper K.A., Wright E.F. (2002). Gap disturbances in northern old-growth forests of British Columbia, Canada. Journal of Vegetation Science 13: 685–696. http://dx.doi.org/10.1111/j.1654-1103.2002.tb02096.x.
Bormann F.H., Likens G.E. (1979). Pattern and process in a forested ecosystem. Springer Verlag, New York, USA.
Busing R. (1991). A spatial model of forest dynamics. Vegetatio 92: 167–179. http://dx.doi.org/10.1007/BF00036037.
Cajander A.K. (1926). The theory of forest types. Acta Forestalia Fennica 29. 108 p.
Canham C., LePage P., Coates K. (2004). A neighborhood analysis of canopy tree competition: effects of shading versus crowding. Canadian Journal of Forest Research 34: 778–787. http://dx.doi.org/10.1139/x03-232.
Davis L.S., Johnson K.N., Bettinger P., Howard T. (2000). Forest management. McGraw-Hill, Series in Forest Resources, New York, USA.
Diggle P.J. (2003). Statistical analysis of spatial point pattern. Arnold, London, UK.
Doležal J., Srutek M., Hara T., Sumida A., Penttila T. (2006). Neighborhood interactions influencing tree population dynamics in nonpyrogenous boreal forest in northern Finland. Plant Ecology 185: 135–150. http://dx.doi.org/10.1007/s11258-005-9090-3.
Duncan R. (1989). An evaluation of errors in tree age estimates based on increment cores in kahikatea (Dacrycarpus dacrydioides). New Zealand Natural Sciences 16: 31–37.
Franklin J.F., Spies T.A., Van Pelt R., Carey A.B., Thornburgh D.A., Berg D.R., Lindenmayer D.B., Harmon M.E., Keeton W.S., Shaw D.C., Bible K., Chen J. (2002). Disturbances and structural development of natural forest ecosystems with silvicultural implications, using Douglas-fir forests as an example. Forest Ecology and Management 155: 399–423. http://dx.doi.org/10.1016/S0378-1127(01)00575-8.
Fraver S., Jonsson B.G., Jönsson M., Esseen P. (2008). Demographics and disturbance history of a boreal old-growth Picea abies forest. Journal of Vegetation Science 19: 789–798. http://dx.doi.org/10.3170/2008-8-18449.
Fraver S., D’Amato A.W., Bradford J.B., Jonsson B.G., Jönsson M., & Esseen P.A. (2014). Tree growth and competition in an old‐growth Picea abies forest of boreal Sweden: influence of tree spatial patterning. Journal of Vegetation Science 25: 374–385. http://dx.doi.org/10.1111/jvs.12096.
Getzin S., Dean C., He F., Trofymow A.J., Wiegand K., Wiegand T. (2006). Spatial patterns and competition of tree species in a Douglas-fir chronosequence on Vancouver Island. Ecography 29: 671–682. http://dx.doi.org/10.1111/j.2006.0906-7590.04675.x.
Goff F.G., West D. (1975). Canopy-understory interaction effects on forest population structure. Forest Science 21: 98–108.
Goreaud F., Pelissier R. (2003). Avoiding misinterpretation of biotic interactions with the intertype K12 -function: population independence vs. random labelling hypotheses. Journal of Vegetation Science 14: 681–692. http://dx.doi.org/10.1111/j.1654-1103.2003.tb02200.x.
Gray L., He F. (2009). Spatial point-pattern analysis for detecting density-dependent competition in a boreal chronosequence of Alberta. Forest Ecology and Management 259: 98–106. http://dx.doi.org/10.1016/j.foreco.2009.09.048.
Greig-Smith P., Kershaw K., Anderson D. (1963). The analysis of pattern in vegetation: a comment on a paper by DW Goodall. The Journal of Ecology 51: 223–229. http://dx.doi.org/10.2307/2257515.
Grenfell R., Aakala T., Kuuluvainen T. (2011). Microsite occupancy and the spatial structure of understorey regeneration in three late-successional Norway spruce forests in northern Europe. Silva Fennica 45: 1093–1110. http://dx.doi.org/10.14214/sf.89.
Harper K.A., Bergeron Y., Drapeau P., Gauthier S., De Grandpré L. (2006). Changes in spatial pattern of trees and snags during structural development in Picea mariana boreal forests. Journal of Vegetation Science 17: 625–636. http://dx.doi.org/10.1111/j.1654-1103.2006.tb02486.x.
Heikinheimo O. (1922). Pohjois-Suomen kuusimetsien hoito. Referat: Über die Bewirtschaftung der Fichtenwälder Nord-Finnlands. Communicationes Instituti Forestalis Fenniae 5. 132 p.
Hintze J.L., Nelson R.D. (1998). Violin plots: a box plot-density trace synergism. The American Statistician 52: 181–184. http://dx.doi.org/10.1080/00031305.1998.10480559.
Hirabuki Y. (1991). Heterogeneous dispersal of tree litterfall corresponding with patchy canopy structure in a temperate mixed forest. Vegetatio 94: 69–79. http://dx.doi.org/10.1007/BF00044917.
Holmes R.L. (1983). Computer-assisted quality control in tree-ring dating and measurement. Tree-Ring Bulletin 43: 69–78.
Johnstone J.F., Chapin III F.S. (2006). Effects of soil burn severity on post-fire tree recruitment in boreal forest. Ecosystems 9: 14–31. http://dx.doi.org/10.1007/s10021-004-0042-x.
Kenkel N.C. (1988). Pattern of self-thinning in jack pine: testing the random mortality hypothesis. Ecology 69: 1017–1024. http://dx.doi.org/10.2307/1941257.
Kershaw K.A. (1963). Pattern in vegetation and its causality. Ecology: 377–388. http://dx.doi.org/10.2307/1932185.
Korsman K., Koistinen T., Kohonen J., Wennerström M., Ekdahl E., Honkamo M., Idman H., Pekkala Y. (1997). Suomen kallioperäkartta – berggrundskarta över Finland – Bedrock map of
Finland 1 : 1 000 000, Helsinki, Finland.
Kullman L. (2007). Tree line population monitoring of Pinus sylvestris in the Swedish Scandes, 1973–2005: implications for tree line theory and climate change ecology. Journal of Ecology 95: 41-52. http://dx.doi.org/10.1111/j.1365-2745.2006.01190.x.
Kuuluvainen T. (1994). Gap disturbance, ground microtopography, and the regeneration dynamics of boreal coniferous forests in Finland: a review. Annales Zoologici Fennici 31: 35–51.
Kuuluvainen T., Ylläsjärvi I. (2011). On the natural regeneration of dry heath forests in Finnish Lapland: a review of VT Aaltonen (1919). Scandinavian Journal of Forest Research 26: 34–44. http://dx.doi.org/10.1080/02827581.2011.517951.
Kuuluvainen T., Penttinen A., Leinonen K., Nygren M. (1996). Statistical opportunities for comparing stand structural heterogeneity in managed and primeval forests: an example from boreal spruce forest in southern Finland. Silva Fennica 30: 315–328. http://dx.doi.org/10.14214/sf.a9243.
Lakari O.J. (1920). Pohjois-Suomen metsätyypeistä – Untersuchungen über die Waldypen in Nordfinnland. Acta Forestalia Fennica 14: 1–85.
Leemans R. (1991). Canopy gaps and establishment patterns of spruce (Picea abies (L.) Karst.) in two old-growth coniferous forests in central Sweden. Vegetatio 93: 157–165. http://dx.doi.org/10.1007/BF00033209.
Lilja S., Wallenius T., Kuuluvainen T. (2006). Structure and development of old Picea abies forests in northern boreal Fennoscandia. Ecoscience 13:181. http://dx.doi.org/10.2980/i1195-6860-13-2-181.1.
Linder P. (1998). Structural changes in two virgin boreal forest stands in central Sweden over 72 years. Scandinavian Journal of Forest Research 13: 451–461. 10.1080/02827589809383006.
Linder P., Elfving B., Zackrisson O. (1997). Stand structure and successional trends in virgin boreal forest reserves in Sweden. Forest Ecology and Management 98: 17–33. http://dx.doi.org/10.1016/S0378-1127(97)00076-5.
Lepš J., Kindlmann P. (1987). Models of the development of spatial pattern of an even-aged plant population over time. Ecological Modelling 39: 45–57. http://dx.doi.org/10.1016/0304-3800(87)90012-3.
Loosmore N.B., Ford E.D. (2006). Statistical inference using the G or K point pattern spatial statistics. Ecology 87: 1925–1931. http://dx.doi.org/10.1890/0012-9658(2006)87%5B1925:SIUTGO%5D2.0.CO;2.
Malkinson D., Kadmon R., Cohen D. (2003). Pattern analysis in successional communities – an approach for studying shifts in ecological interactions. Journal of Vegetation Science 14: 213–222. http://dx.doi.org/10.1111/j.1654-1103.2003.tb02146.x.
Manabe T., Nishimura N., Miura M.,Yamamoto S. (2000). Population structure and spatial patterns for trees in a temperate old-growth evergreen broad-leaved forest in Japan. Plant Ecology 151: 181–197. http://dx.doi.org/10.1023/A:1026512404110.
McCarthy J. (2001). Gap dynamics of forest trees: a review with particular attention to boreal forests. Environmental Reviews 9: 1–59. http://dx.doi.org/10.1139/a00-012.
McCarthy J.W., Weetman G. (2006). Age and size structure of gap-dynamic, old-growth boreal forest stands in Newfoundland. Silva Fennica 40: 209–230. http://dx.doi.org/10.14214/sf.339.
McGaughey R.J. (1999). Stand visualization system. USDA Forest Service, Pacific Northwest Research Station.
Oliver C.D., Larson B.C. (1990). Forest stand dynamics. McGraw-Hill, New York. 467 p.
Pacala S.W., Deutschman D.H. (1995). Details that matter: the spatial distribution of individual trees maintains forest ecosystem function. Oikos 74: 357–365. http://dx.doi.org/10.2307/3545980.
Perala D.A., Alm A.A. (1990). Reproductive ecology of birch: a review. Forest Ecology and Management 32: 1–38. http://dx.doi.org/10.1016/0378-1127(90)90104-J.
R Development Core Team (2011). R: a language and environment for statistical computing. R Foundation for Statistical Computing, Vienna, Austria. http://www.R-project.org/.
Ripley B.D. (1977). Modelling spatial patterns. Journal of the Royal Statistical Society. Series B 39: 172–212.
Sirén G. (1955). On the development of of spruce forests on raw humus sites in northern Finland and its ecology. Acta Forestalia Fennica 62. 408 p.
Stephenson N., Das A., Condit R., Russo S., Baker P., Beckman N., Coomes D., Lines E., Morris W., Rüger N. (2014). Rate of tree carbon accumulation increases continuously with tree size. Nature 507: 90–93. http://dx.doi.org/10.1038/nature12914.
Stoll P., Prati D. (2001). Intraspecific aggregation alters competitive interactions in experimental plant communities. Ecology 82: 319–327. http://dx.doi.org/10.2307/2679862.
Susiluoto S., Rasilo T., Pumpanen J., Berninger F. (2008). Effects of grazing on the vegetation structure and carbon dioxide exchange of a Fennoscandian fell ecosystem. Arctic, Antarctic, and Alpine Research 40: 422–431. http://dx.doi.org/10.1657/1523-0430(07-035)[SUSILUOTO]2.0.CO;2.
Szwagrzyk J. (1990). Natural regeneration of forest related to the spatial structure of trees: a study of two forest communities in Western Carpathians, southern Poland. Vegetatio 89: 11–22. http://dx.doi.org/10.1007/BF00134431.
Szwagrzyk J., Czerwczak M. (1993). Spatial patterns of trees in natural forests of East‐Central Europe. Journal of Vegetation Science 4: 469–476. http://dx.doi.org/10.2307/3236074.
Wallenius T.H., Pitkänen A., Kuuluvainen T., Pennanen J., Karttunen H. (2005). Fire history and forest age distribution of an unmanaged Picea abies dominated landscape. Canadian Journal of Forest Research 35: 1540–1552. http://dx.doi.org/10.1139/x05-050.
Wallenius T.H., Kauhanen H., Herva H., Pennanen J. (2010). Long fire cycle in northern boreal Pinus forests in Finnish Lapland. Canadian Journal of Forest Research 40: 2027–2035. http://dx.doi.org/10.1139/X10-144.
Yamaguchi D.K. (1991). A simple method for cross-dating increment cores from living trees. Canadian Journal of Forest Research 21(3): 414–416. http://dx.doi.org/10.1139/x91-053.
Ylläsjärvi I., Kuuluvainen T. (2009). How homogeneous is the boreal forest? Characteristics and variability of old-growth forest on a Hylocomium-Myrtillus site type in the Pallas-Yllästunturi National Park, northern Finland. Annales Botanici Fennici 46: 263–279. http://dx.doi.org/10.5735/085.046.0403.
Zhu W., Cheng S., Cai X., He F., Wang J. (2009). Changes in plant species diversity along a chronosequence of vegetation restoration in the humid evergreen broad-leaved forest in the Rainy Zone of West China. Ecological Research 24: 315–325. http://dx.doi.org/10.1007/s11284-008-0508-y.
Total of 67 references
