Mihails Čugunovs  ,
Eeva-Stiina Tuittila,
Lauri Mehtätalo,
Laura Pekkola,
Ida Sara-Aho,
Jari Kouki
,
Eeva-Stiina Tuittila,
Lauri Mehtätalo,
Laura Pekkola,
Ida Sara-Aho,
Jari Kouki
Variability and patterns in forest soil and vegetation characteristics after prescribed burning in clear-cuts and restoration burnings
Čugunovs M., Tuittila E.-S., Mehtätalo L., Pekkola L., Sara-Aho I., Kouki J. (2017). Variability and patterns in forest soil and vegetation characteristics after prescribed burning in clear-cuts and restoration burnings. Silva Fennica vol. 51 no. 1 article id 1718. https://doi.org/10.14214/sf.1718
Highlights
- Soil parameter variability is similar across sites of different disturbance type
- Variability of understory vegetation biomass and cover is higher and more different between sites than soil variability
- Sites studied here reflect well the assumed disturbance-type gradient based on PCA
- Sampling six forest sites per treatment should provide good statistical power to capture the differences in soil organic matter stocks.
Abstract
Forest ecological restoration by burning is widely applied to promote natural, early-successional sites and increase landscape biodiversity. Burning is also used as a forest management practice to facilitate forest regeneration after clearcutting. Besides the desired goals, restoration burnings also affect soil biogeochemistry, particularly soil organic matter (SOM) and related soil carbon stocks but the long-term effects are poorly understood. However, in order to study these effects, a reliable estimate of spatial variability is first needed for effective sampling. Here we investigate spatial variability of SOM and vegetation features 13 years after burnings and in combination with variable harvest levels. We sampled four experimental sites representing distinct management and restoration treatments with an undisturbed control. While variability of vegetation cover and biomass was generally higher in disturbed sites, soil parameter variability was not different between the four sites. The joint ecological patterns of soil and vegetation parameters across the whole sample continuum support well the prior assumptions on the characteristic disturbance conditions within each of the study sites. We designed and employed statistical simulations as a means to plan prospective sampling. Sampling six forest sites for each treatment type with 30 independent soil cores per site would provide enough statistical power to adequately capture the impacts of burning on SOM based on the data we obtained here and statistical simulations. In conclusion, we argue that an informed design-based approach to documenting the ecosystem effects of forest burnings is worth applying both through obtaining new data and meta-analysing the existing.
Keywords
disturbance;
restoration;
sampling;
spatial variability;
prescribed fire;
SOM stocks
-
Čugunovs,
University of Eastern Finland, School of Forest Sciences, Yliopistokatu 7, P.O. Box 111, FI-80101 Joensuu, Finland
E-mail
mihails.cugunovs@uef.fi
-
Tuittila,
University of Eastern Finland, School of Forest Sciences, Yliopistokatu 7, P.O. Box 111, FI-80101 Joensuu, Finland
 http://orcid.org/0000-0001-8861-3167
E-mail
eeva-stiina.tuittila@uef.fi
http://orcid.org/0000-0001-8861-3167
E-mail
eeva-stiina.tuittila@uef.fi
-
Mehtätalo,
University of Eastern Finland, School of Computing, Science Park, Länsikatu 15, P.O. Box 111, 80101 Joensuu, Finland
http://orcid.org/0000-0002-8128-0598
E-mail
lauri.mehtatalo@uef.fi
- Pekkola, University of Eastern Finland, School of Forest Sciences, Yliopistokatu 7, P.O. Box 111, FI-80101 Joensuu, Finland E-mail laura.pekkola@gmail.com
- Sara-Aho, University of Eastern Finland, School of Forest Sciences, Yliopistokatu 7, P.O. Box 111, FI-80101 Joensuu, Finland E-mail ida.sara-aho@mhy.fi
-
Kouki,
University of Eastern Finland, School of Forest Sciences, Yliopistokatu 7, P.O. Box 111, FI-80101 Joensuu, Finland
http://orcid.org/0000-0003-2624-8592
E-mail
jari.kouki@uef.fi
Received 18 October 2016 Accepted 4 January 2017 Published 17 January 2017
Views 138941
Available at https://doi.org/10.14214/sf.1718 | Download PDF

Supplementary Files
1 Introduction
Natural fires are typical throughout the boreal forest zone (Zackrisson 1997; Wallenius 2011) and are known to have major effect in practically all ecosystem properties, including soil characteristics (Brown and Smith 2000; Neary et al. 2005; Certini 2014). Nowadays, in many areas, natural fires have been effectively suppressed (Wallenius 2011), which has led to, inter alia, lack of young successional forests and a decrease in biological diversity. Recently, prescribed burnings have become common in both ecological restoration (Halme et al. 2013) and forest management to support biological diversity and, in particular, to maintain natural-like early successional forests in regions where natural fires are now absent (Kouki et al. 2001; Vanha-Majamaa et al. 2007; Swanson et al. 2010; Similä and Junninen 2012).
Impacts of fire-related patterns and processes on biodiversity of different organism groups have been widely studied. Conversely, the multitude of effects that prescribed fires and especially restoration fires may have on boreal forest soil and vegetation biomass, are very poorly understood (Similä and Junninen 2012). A major challenge in analysing the effects of fire and also of prescribed burnings is the high spatial and fire-to-fire variation. Information on spatial variability and structure of ecological phenomena is, however, a necessary prerequisite for estimates of stand and ecosystem-level effects. For instance, to effectively sample soil organic carbon (C) stocks and their changes, one needs to know the amount and structure of variation in soil C (Liski 1995).
A large-scale boreal forest restoration experiment “FIRE” was initiated in North Karelia, Eastern Finland, in 2000, and provides a unique opportunity to study ecological effects of a prescribed fire in combination with green tree retention. Regarding the main issues related to soils, there is an urgent need to know the necessary amount of samples for capturing impacts of restoration fire on soil and vegetation. For this, quantification of the variability of the parameters is needed. It is also highly relevant for forest ecological restoration and management policies to know if ecosystems recover from disturbances of different type. In a broader context, modelling of global carbon cycling similarly requires quantification of variability and magnitude of soil organic matter (SOM) stocks and vegetation biomass in different conditions. Hence, also gradual accumulation and subsequent meta-analysis of empirical data is paramount.
In this study, we (1) quantify the magnitude and spatial variability of SOM and understorey vegetation biomass and cover parameters, to assess how sampling should be conducted for the reliable assessment of fire impacts; (2) explore multivariate interrelationships among SOM and understorey vegetation biomass and cover across unburned, restoration-burned, silviculturally-burned and clear-cut experimental forest sites, to get insights into the disturbance characteristics, and (3) develop and employ a simulation-based method to plan future sampling strategies to address SOM and vegetation sampling in relation to forest burning disturbance.
2 Material and methods
2.1 Study areas
This study is a part of a large-scale forest ecological restoration experiment called “FIRE” (“Fire and retention trees in facilitating biodiversity in boreal forests”, see, e.g., Hyvärinen et al. (2005), Heikkala et al. (2014), and Kouki (2016)) with 24 treatment units (i.e. forest sites), 3–5 ha each, located in Lieksa municipality, North Karelia, Eastern Finland (63°19´N, 30°01´E). In the experiment, the presence of fire (present/absent) and green tree retention levels (100%, 50 m3 ha–1, 10 m3 ha–1, 0m3 ha–1) were manipulated. Forest stands in the study area belong to the southern edge of middle boreal zone (Ahti et al. 1968). Yearly average temperature in the study region is +2 °C, with January mean of –12 °C and July mean of +15.8 °C. Temperature sum in the study region is 1000–1100 degree-days (Ilmatieteen Laitos 2016). Yearly precipitation varies between 500 and 800 mm, of which about half falls as snow (Ilmatieteen laitos 1991).
All of the experimental sites were initially covered with approximately 150-year-old coniferous forest of Empetrum-Vaccinium forest type (EVT), belonging to the sub-xeric heath forest site group (Hotanen et al. 2008). The stands were dominated by Scots pine (Pinus sylvestris L.), while Norway spruce (Picea abies (L.) H. Karst.) and birch trees (Betula pendula Roth and Betula pubescens Ehrh.) were also interspersed in small amounts. Some minor selective single-tree harvesting was performed in the sites during the late 1800’s and early 1900’s, but otherwise no intensive modern forest management had taken place before the experiment (Hyvärinen et al. 2006). Average tree volume pre-harvest in the stands was 288 m3 ha–1. There were no significant differences in the tree volumes of sites before treatment execution among the experimental forest sites. The harvests were performed during winter of 2000/2001, and the prescribed burnings were conducted during two consecutive days at the end of June 2001, in similar weather conditions (Hyvärinen et al. 2005). The burnings caused on average 1 cm decrease of humus thickness (Laamanen 2002) in the two burned study sites used here. However, the coefficient of variation around 60% indicated relatively high small-scale variability of fire.
To address study question on spatial variability, we selected four experimental sites representing four distinct treatments: unburned/no cuttings – control (UBNC), burned/no cuttings – restoration burn (BNC), burned/50 m3 ha–1 retention – silvicultural burn (B50), and unburnt/0 m3 ha–1 retention – complete clearcut (UBCC).
2.2 Sampling
To capture small-scale spatial variability in SOM and understorey vegetation biomass and cover, in each site we laid out a roughly systematic grid of ~80 sampling plots ~10 meters apart from one another, using a GPS receiver and a measuring tape. We assumed the between-plot spacing of roughly 10 m to produce spatially independent data as the autocorrelation distances for soil and understory vegetation parameters in boreal forests are generally found to be below 10 m (Liski 1995; Smithwick et al. 2005; Lavoie and Mack 2012). Thus, here by the term “spatial variability” we mean the variability related to sample locations in a non-autocorrelated dataset.
A survey grade Global Positioning System (Trimble GeoXH) was used to determine the position of the plot centres, with an accuracy of about 1 meter under canopy cover (the accuracy of a comparable positioning system under canopy cover was tested nearby).
GPS unit was held still on the ground on the northern edge of each sampling plot and at least 50 position measurements were recorded for the same point. Then the measurements were corrected based on Lieksa and Joensuu GPS base station data to produce the final sets of sample plot locations.
In each of the sampling plots, we sampled soil and understorey vegetation together to assess their joint spatial variability. Vegetation cover (%) was visually estimated within the sampling circle of 30 cm diameter for the dominating species or species groups. The International Plant Names Index (International Plant Names Index 2004) was used for taxonomic reference. Then, litter and plant biomass was collected from within the circle and put to separate bags in these classes: litter (L), living Vaccinium myrtillus L. (VM), standing dead V. myrtillus (VMD), other dwarf shrubs (ODS), moss (MO), lichen (LC), graminoid (G), forb (F), and seedling (S).
Finally, organic and a maximum of 10 cm of uppermost mineral soil core was taken with a cylindrical borer with a diameter of 5.7 cm from the centre of the circle. If an obstacle (e.g. stone or wood) was encountered above the mineral depth of 3 cm, the coring was attempted close by within the sampling circle. If all the circle area had obstacles, the circle was moved once to the north and the procedure repeated. If the north direction was blocked, the circle was moved in some other arbitrary direction based on field features. Of the taken core, hemic and sapric organic layers, i.e. Oe/Oa horizon (hereafter named humus layer) and mineral soil thickness were recorded. Humus layer and mineral soil were put to two separate paper bags and marked. At one-tenth of the sampling locations in each study site, an additional soil sample was taken 30 centimetres off the main one for pH analysis.
Altogether, 653 SOM samples, 63 soil pH samples, and 1732 vegetation biomass samples were analysed.
2.3 Laboratory methods
Soil and vegetation samples were set out to air-dry indoors on the collection day before transportation to the laboratory. In the laboratory, the samples were weighted after being oven-dried at 60 °C until constant weight. Organic soils were passed through a 2-mm sieve after the weighing.
To measure the dry weight of fine material, oven-dry mineral soil samples were sieved through a 2-mm sieve before reweighing. Organic and mineral soil samples were analysed for SOM by mass loss on ignition (LOI) at 550 °C for 2 hours. The preparation and LOI analysis of soil samples followed the standard method (Solid biofuels - Determination of ash content, EN 14775:2009) that was modified to suit the samples and conditions at hand (European Committee for Standardization 2009).
2.4 Data analysis
To quantify the inherent variation in the parameters, we calculated sample mean, sample median, sample variance and coefficients of variation (CV) for the soil and understorey vegetation variables. To assess variance equality between sites, we used a non-parametric Levene’s test on ranks (Nordstokke and Zumbo 2010).
The presence of global spatial autocorrelation (measurement dependency) was tested for with Moran’s I index in Anselin’s GeoDa v. 1.6.7., and through computing sample variograms in R, using package “geoR” (Diggle and Ribeiro 2007; R Core Team 2013). For the variograms, we calculated no-correlation confidence envelopes based on 99 permutations. In Moran’s I, k-Nearest Neighbours weighting system (k = 7), and 999 randomizations with a critical pseudo p-value of 0.001 were used. ESRI ArcGIS v. 10.1 was used to manage spatial data.
For the exploration of joint patterns and interrelationships among soil and vegetation parameters we used principal components analysis (PCA) in Canoco 5 program (Biometris, Plant Research International, and Petr Šmilauer 2013) with sites independently added as environmental variables. The PCA method was chosen due to short ecological distances in the dataset.
To evaluate how sampling of SOM and vegetation biomass should be conducted for the reliable assessment of fire impact, we designed and performed a simulation-based sample size calculation in R (Monte Carlo analysis of power) based on the means and variances obtained. We simulated datasets with different amount of replicates of sites per treatment and sample points within sites, and then assessed the null hypothesis keeping rates (i.e. an analog of observed P-value in tests). In the simulations we assumed different shares of between-site variability as compared to the total variability in the data (10, 20 and 50%). For SOM simulations, log-transformed data were used. In the calculations, we used the amount of samples within reasonable bounds regarding time-budget needed to collect and analyze them, based on our current sample collection and analysis experience. For each case, 100 datasets were simulated. The simulation method is formally described in Supplementary file S1, and the R code for the simulations is provided in Supplementary file S2.
Non-spatial data analysis was performed in MS Excel 2011, IBM SPSS v.21 (sample statistic calculation and Rank Levene’s test), and in R (simulations).
3 Results
3.1 Spatial variability of soil and vegetation parameters
There was no significant global spatial autocorrelation for any of the parameters studied as found with global Moran’s I. Neither did sample variograms show any spatial dependence in the data (Fig. 1).
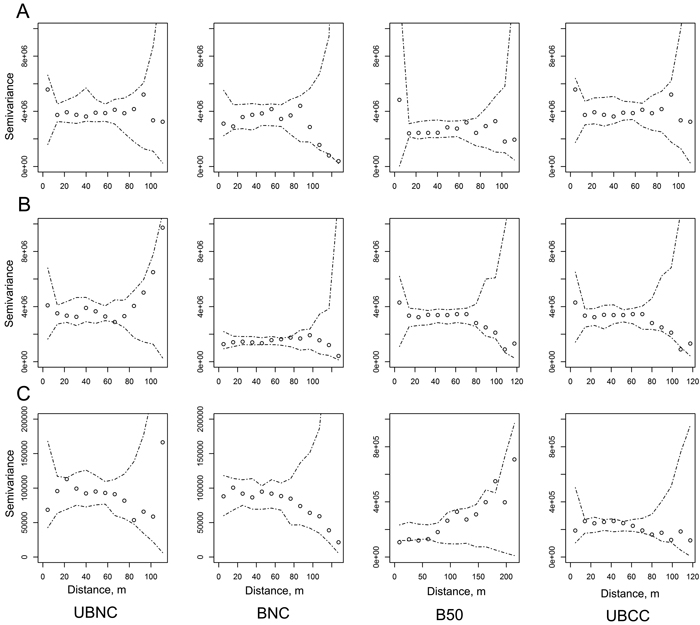
Fig. 1. Sample variograms with no-correlation confidence envelopes for organic hemic and sapric, i.e. Oe/Oa horizon (humus layer) soil organic matter (SOM) stocks (g m–2, A), uppermost 10 cm mineral SOM stocks (g m–2, B), and ground and field-layer vegetation biomass (g m–2, C) in the four sites (UBNC – unburned fully-stocked site (control); BNC – restoration-burned fully-stocked site; B50 – silviculturally-burned clearcut site with 50 m3 ha–1 green tree retention; UBCC – unburned complete clearcut site with no green tree retention). View larger in new window/tab.
Soil parameter distributions featured many outliers based on Tukey’s box plots, and the means often differed from medians (Fig. 2). Soil parameters generally had lower coefficient of variation than vegetation biomass and cover parameters, and also soil parameter variance was in general equal across sites (Tables 1–3, Fig. 2). Coefficients of variation (CV’s) were generally below 100% for soil variables, while often above 100% for vegetation parameters (Tables 1–3).
Only in SOM (%) from uppermost 10 cm mineral soil layer there was a significant difference in variances between the sites (non-parametric Levene’s test), with BNC site having noticeably lower spatial variation of mineral layer SOM than the other sites (Table 1, Fig. 2d).
In contrast to soil variables, all biomass groups had rather high CV’s and unequal variances between the sites according to the non-parametric Levene’s test (Table 2). Variation was also very high in the vegetation cover data (Table 3). CV’s typically exceeded 100%. Also, the variance of cover data differed between the sites for most taxonomic groups. Vaccinium vitis-idaea L. and Dicranum spp. mosses were exceptions, they had approximately equal variances of cover in the four sites (Table 3).
| Table 1. Soil characteristics of the study sites. UBNC – fully-stocked uncut control site; BNC – fully-stocked burned site; B50 – burned clearcut site with 50 m3 ha–1 green tree retention; UBCC – unburned complete clearcut site with no retention. | |||||||||
| Parameter | Site | N obs. | Mean | Median | Variance | Stdev | CV, % | CV max/min | Rank Levene’s p |
| Organic hemic and sapric, i.e. Oe/Oa (humus layer) thickness, cm | UBNC | 80 | 5.0 | 5.0 | 3.0 | 1.7 | 35 | 1.64 | 0.742 |
| BNC | 83 | 4.0 | 3.8 | 2.7 | 1.6 | 41 | |||
| B50 | 75 | 2.6 | 2.4 | 2.1 | 1.5 | 57 | |||
| UBCC | 78 | 3.8 | 3.8 | 2.7 | 1.6 | 42 | |||
| Humus layer soil organic matter (SOM), % | UBNC | 80 | 86.5 | 92.0 | 173.1 | 13.2 | 15 | 1.84 | 0.142 |
| BNC | 83 | 77.2 | 83.2 | 340.2 | 18.4 | 24 | |||
| B50 | 76 | 71.3 | 76.4 | 398.0 | 19.9 | 28 | |||
| UBCC | 78 | 78.3 | 82.8 | 210.6 | 14.5 | 19 | |||
| Humus layer SOM, g m–2 | UBNC | 80 | 4470 | 4263 | 3 923 133 | 1981 | 44 | 1.61 | 0.361 |
| BNC | 83 | 3973 | 3586 | 3 554 194 | 1885 | 47 | |||
| B50 | 76 | 2272 | 1992 | 2 635 392 | 1623 | 71 | |||
| UBCC | 78 | 3763 | 3859 | 3 720 962 | 1929 | 51 | |||
| Uppermost 10 cm mineral SOM, % | UBNC | 80 | 4.88 | 4.34 | 6.52 | 2.55 | 52 | 2.18 | 0.041* |
| BNC | 80 | 4.07 | 4.15 | 1.19 | 1.09 | 27 | |||
| B50 | 75 | 4.88 | 4.60 | 5.46 | 2.34 | 48 | |||
| UBCC | 77 | 4.20 | 3.64 | 6.06 | 2.46 | 59 | |||
| Uppermost 10 cm mineral SOM, g m–2 | UBNC | 80 | 3550 | 3340 | 3 547 985 | 1884 | 53 | 2.09 | 0.222 |
| BNC | 81 | 4427 | 4477 | 1 260 189 | 1123 | 25 | |||
| B50 | 75 | 4056 | 3760 | 3 452 721 | 1858 | 46 | |||
| UBCC | 77 | 3780 | 3614 | 3 123 512 | 1767 | 47 | |||
| Forest floor (litter+humus) mass, g m–2 | UBNC | 80 | 5825 | 5596 | 6 928 280 | 2632 | 45 | 1.46 | 0.372 |
| BNC | 83 | 6336 | 5200 | 17 496 834 | 4183 | 66 | |||
| B50 | 76 | 3275 | 3078 | 3 699 799 | 1923 | 59 | |||
| UBCC | 78 | 5485 | 5120 | 11 442 338 | 3383 | 62 | |||
| Humus layer pH | UBNC | 7 | 3.76 | 3.88 | 0.0262 | 0.1618 | 4 | 3.19 | 0.011* |
| BNC | 8 | 3.91 | 3.81 | 0.1484 | 0.3852 | 10 | |||
| B50 | 8 | 4.34 | 4.30 | 0.0317 | 0.178 | 4 | |||
| UBCC | 8 | 4.03 | 4.06 | 0.0155 | 0.1246 | 3 | |||
| Uppermost 10 cm mineral soil pH | UBNC | 7 | 4.36 | 4.28 | 0.0318 | 0.1784 | 4 | 1.52 | 0.4 |
| BNC | 8 | 4.61 | 4.61 | 0.0361 | 0.1901 | 4 | |||
| B50 | 7 | 4.71 | 4.72 | 0.0859 | 0.293 | 6 | |||
| UBCC | 8 | 4.44 | 4.49 | 0.0613 | 0.2476 | 6 | |||
| N. obs. – total number of observations; Stdev – sample standard deviation; CV, % – coefficient of variation; CV max/min – ratio of the highest and lowest site-level CV for the parameter; Rank Levene’s p – p-value of the rank Levene’s test of equality of variance between sites, significance levels: * – p < 0.05. | |||||||||
| Table 2. Biomass of vegetation components in the study sites, g m–2. UBNC – fully-stocked uncut control site; BNC – fully-stocked burned site; B50 – burned clearcut site with 50 m3 ha–1 green tree retention; UBCC – unburned complete clearcut site with no retention. | ||||||||||
| Vegetation group | Site | N obs. > 0 | N obs. tot. | Mean | Median | Variance | Stdev | CV, % | CV max/min | Rank Levene’s p |
| Vaccinium myrtillus | UBNC | 77 | 80 | 103.9 | 97.8 | 6264.9 | 79.2 | 76 | 2.51 | < 0.001*** |
| BNC | 59 | 83 | 45.7 | 22.1 | 2863.2 | 53.5 | 117 | |||
| B50 | 52 | 76 | 15.7 | 4.3 | 619.1 | 24.9 | 159 | |||
| UBCC | 32 | 78 | 3.2 | 0.0 | 37.4 | 6.1 | 191 | |||
| Other dwarf shrubs | UBNC | 70 | 80 | 42.2 | 27.0 | 2264.7 | 47.6 | 113 | 1.41 | 0.025* |
| BNC | 68 | 83 | 63.6 | 43.8 | 3681.7 | 60.7 | 95 | |||
| B50 | 76 | 76 | 68.6 | 43.6 | 7135.2 | 84.5 | 123 | |||
| UBCC | 71 | 78 | 75.7 | 39.9 | 10 319.1 | 101.6 | 134 | |||
| Dead V. myrtillus | UBNC | 52 | 80 | 10.2 | 4.3 | 223.2 | 14.9 | 146 | 3.49 | < 0.001*** |
| BNC | 23 | 83 | 5.0 | 0.0 | 113.0 | 10.6 | 214 | |||
| B50 | 30 | 76 | 2.6 | 0.0 | 39.9 | 6.3 | 242 | |||
| UBCC | 6 | 78 | 0.2 | 0.0 | 1.3 | 1.1 | 509 | |||
| Litter | UBNC | 78 | 80 | 483.0 | 423.5 | 101 722.2 | 318.9 | 66 | 2.25 | 0.041* |
| BNC | 82 | 83 | 608.0 | 497.1 | 138 174.5 | 371.7 | 61 | |||
| B50 | 76 | 76 | 205.4 | 146.3 | 80 010.7 | 282.9 | 138 | |||
| UBCC | 77 | 78 | 395.8 | 233.9 | 224 122.4 | 473.4 | 120 | |||
| Moss | UBNC | 78 | 80 | 288.2 | 247.8 | 32 917.0 | 181.4 | 63 | 2.06 | 0.029* |
| BNC | 81 | 83 | 231.7 | 218.3 | 35 930.9 | 189.6 | 82 | |||
| B50 | 62 | 76 | 91.4 | 37.7 | 14 063.9 | 118.6 | 130 | |||
| UBCC | 75 | 78 | 357.8 | 289.3 | 97 570.1 | 312.4 | 87 | |||
| Lichen | UBNC | 4 | 80 | 3.9 | 0.0 | 1008.7 | 31.8 | 808 | 7.00 | < 0.001*** |
| BNC | 46 | 83 | 9.1 | 0.7 | 325.6 | 18.0 | 198 | |||
| B50 | 68 | 76 | 26.4 | 15.6 | 925.6 | 30.4 | 115 | |||
| UBCC | 41 | 78 | 105.1 | 0.0 | 48 228.7 | 219.6 | 209 | |||
| Forb | UBNC | 13 | 80 | 0.5 | 0.0 | 3.4 | 1.8 | 359 | 1.51 | < 0.001*** |
| BNC | 0 | 83 | 0.0 | 0.0 | 0.0 | 0.0 | - | |||
| B50 | 25 | 76 | 4.2 | 0.0 | 98.2 | 9.9 | 239 | |||
| UBCC | 21 | 78 | 3.4 | 0.0 | 89.3 | 9.4 | 275 | |||
| Graminoid | UBNC | 12 | 80 | 0.5 | 0.0 | 3.3 | 1.8 | 356 | 2.78 | 0.011* |
| BNC | 8 | 82 | 2.8 | 0.0 | 159.4 | 12.6 | 459 | |||
| B50 | 48 | 76 | 25.6 | 0.3 | 3049.2 | 55.2 | 216 | |||
| UBCC | 42 | 78 | 42.4 | 0.0 | 4907.5 | 70.1 | 165 | |||
| Seedling | UBNC | 2 | 80 | 0.313 | 0.000 | 8.146 | 2.854 | 911 | 2.54 | 0.019* |
| BNC | 16 | 83 | 0.494 | 0.000 | 3.154 | 1.776 | 359 | |||
| B50 | 5 | 76 | 0.341 | 0.000 | 5.998 | 2.449 | 718 | |||
| UBCC | 2 | 78 | 0.012 | 0.000 | 0.013 | 0.112 | 911 | |||
| N. obs. > 0 – number of observations with value greater than zero; N. obs. tot. – total number of observations; Stdev – sample standard deviation; CV, % – coefficient of variation; CV max/min – ratio of the highest and lowest site-level CV for the parameter; Rank Levene’s p – p-value of the rank Levene’s test of equality of variance between sites, significance levels: * – p < 0.05, ** – p < 0.01, *** – p < 0.001. | ||||||||||
| Table 3. Coverage of vegetation components in study sites, %. UBNC – fully-stocked uncut control site; BNC – fully-stocked burned site; B50 – burned clearcut site with 50 m3 ha–1 green tree retention; UBCC – unburned complete clearcut site with no retention. | ||||||||||
| Vegetation group | Site | N obs. > 0 | N obs. tot | Mean | Median | Variance | Stdev | CV, % | CV max/min | Rank Levene’s p |
| Vaccinium myrtillus | UBNC | 79 | 80 | 34.2 | 30.0 | 553.4 | 23.5 | 69 | 2.14 | < 0.001*** |
| BNC | 59 | 83 | 14.0 | 6.0 | 251.5 | 15.9 | 113 | |||
| B50 | 53 | 76 | 4.2 | 2.5 | 32.5 | 5.7 | 137 | |||
| UBCC | 39 | 78 | 1.1 | 0.0 | 2.6 | 1.6 | 147 | |||
| Vaccinium vitis-idaea | UBNC | 71 | 80 | 6.2 | 5.0 | 41.1 | 6.4 | 103 | 1.24 | 0.334 |
| BNC | 68 | 83 | 14.7 | 12.0 | 190.0 | 13.8 | 94 | |||
| B50 | 76 | 76 | 16.4 | 8.0 | 315.5 | 17.8 | 108 | |||
| UBCC | 73 | 78 | 10.7 | 6.0 | 153.6 | 12.4 | 116 | |||
| Pleurozium schreberi | UBNC | 70 | 80 | 30.6 | 20.0 | 845.0 | 29.1 | 95 | 5.91 | < 0.001*** |
| BNC | 64 | 83 | 17.8 | 5.0 | 609.0 | 24.7 | 139 | |||
| B50 | 8 | 76 | 1.8 | 0.0 | 107.2 | 10.4 | 562 | |||
| UBCC | 65 | 78 | 28.9 | 20.0 | 930.7 | 30.5 | 106 | |||
| Hylocomium splendens | UBNC | 48 | 80 | 25.2 | 7.0 | 947.2 | 30.8 | 122 | 5.16 | < 0.001*** |
| BNC | 11 | 83 | 0.8 | 0.0 | 12.9 | 3.6 | 426 | |||
| B50 | 2 | 76 | 0.1 | 0.0 | 0.4 | 0.7 | 632 | |||
| UBCC | 4 | 78 | 0.3 | 0.0 | 2.2 | 1.5 | 501 | |||
| Polytrichum spp. | UBNC | 6 | 80 | 0.2 | 0.0 | 1.3 | 1.1 | 496 | 3.88 | < 0.001*** |
| BNC | 36 | 83 | 3.5 | 0.0 | 60.0 | 7.7 | 219 | |||
| B50 | 59 | 76 | 21.5 | 5.5 | 753.4 | 27.4 | 128 | |||
| UBCC | 9 | 78 | 0.8 | 0.0 | 10.6 | 3.3 | 410 | |||
| Dicranum spp. | UBNC | 53 | 80 | 11.8 | 6.5 | 262.9 | 16.2 | 138 | 2.83 | 0.162 |
| BNC | 74 | 83 | 15.6 | 8.0 | 320.9 | 17.9 | 115 | |||
| B50 | 19 | 76 | 3.7 | 0.0 | 145.9 | 12.1 | 324 | |||
| UBCC | 51 | 78 | 6.8 | 3.0 | 96.2 | 9.8 | 145 | |||
| Calluna vulgaris | UBNC | 21 | 80 | 1.8 | 0.0 | 23.8 | 4.9 | 277 | 3.15 | < 0.001*** |
| BNC | 2 | 83 | 0.3 | 0.0 | 7.6 | 2.8 | 818 | |||
| B50 | 1 | 76 | 0.3 | 0.0 | 5.3 | 2.3 | 872 | |||
| UBCC | 2 | 78 | 1.1 | 0.0 | 45.9 | 6.8 | 622 | |||
| Epilobium angustifolium | UBNC | 0 | 80 | 0.0 | 0.0 | 0.0 | 0.0 | - | 1.18 | < 0.001*** |
| BNC | 0 | 83 | 0.0 | 0.0 | 0.0 | 0.0 | - | |||
| B50 | 27 | 76 | 1.9 | 0.0 | 19.2 | 4.4 | 227 | |||
| UBCC | 23 | 78 | 1.7 | 0.0 | 21.3 | 4.6 | 269 | |||
| Calamagrostis spp. | UBNC | 0 | 80 | 0.0 | 0.0 | 0.0 | 0.0 | - | 1.90 | < 0.001*** |
| BNC | 1 | 82 | 0.0 | 0.0 | 0.0 | 0.2 | 906 | |||
| B50 | 17 | 76 | 1.9 | 0.0 | 79.2 | 8.9 | 476 | |||
| UBCC | 3 | 78 | 0.2 | 0.0 | 1.6 | 1.3 | 585 | |||
| Deschampsia flexuosa | UBNC | 9 | 80 | 0.2 | 0.0 | 0.3 | 0.5 | 309 | 3.84 | 0.027* |
| BNC | 8 | 83 | 1.8 | 0.0 | 116.3 | 10.8 | 597 | |||
| B50 | 31 | 76 | 5.5 | 0.0 | 159.4 | 12.6 | 229 | |||
| UBCC | 41 | 78 | 17.3 | 1.3 | 718.1 | 26.8 | 155 | |||
| Cladonia spp. | UBNC | 3 | 80 | 0.7 | 0.0 | 31.3 | 5.6 | 841 | 8.01 | < 0.001*** |
| BNC | 58 | 83 | 1.7 | 0.3 | 12.0 | 3.5 | 198 | |||
| B50 | 79 | 88 | 7.3 | 5.6 | 58.9 | 7.7 | 105 | |||
| UBCC | 49 | 78 | 12.0 | 1.0 | 486.6 | 22.1 | 184 | |||
| N. obs. > 0 – number of observations with value greater than zero; N. obs. tot. – total number of observations; Stdev – sample standard deviation; CV, % – coefficient of variation; CV max/min – ratio of the highest and lowest site-level CV for the parameter; Rank Levene’s p – p-value of the rank Levene’s test of equality of variance between sites, significance levels: * – p < 0.05, ** – p < 0.01, *** – p < 0.001. | ||||||||||
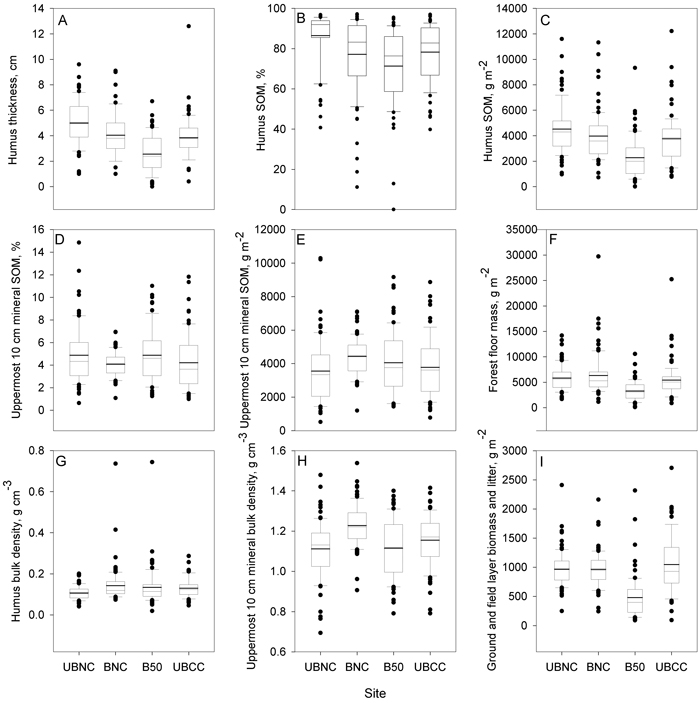
Fig. 2. Boxplots for soil parameter distributions within the study sites: A – organic hemic and sapric, i.e. Oe/Oa layer (humus layer) thickness; B – humus layer soil organic matter (SOM) concentration, mass %; C – humus layer SOM stocks, g m–2; D – uppermost 10 cm mineral SOM concentration, mass %; E – uppermost 10 cm mineral SOM stocks, g m–2; F – forest floor (whole O horizon) mass, g m–2; G – humus layer bulk density, g cm–3; H – uppermost 10 cm mineral soil bulk density, g cm–3; I – ground and field layer biomass and litter, g m–2. UBNC – unburned fully-stocked site (control), BNC – restoration-burned fully-stocked site, B50 – silviculturally-burned clearcut site with 50 m3 ha–1 green tree retention, UBCC – unburned complete clearcut site with no green tree retention. View larger in new window/tab.
3.2 Joint ecological variability patterns
First principal component axis (PCA1), which explained 16.3% of variation, was most related to soil humus layer thickness, humus layer SOM stocks, and bilberry biomass and cover (Fig. 3). The undisturbed control site (UBNC) had the highest score on PCA1, followed by the burned fully-stocked site (BNC), unburned completely clearcut site (UBCC) and, finally, the most heavily disturbed site with 50 m3 ha–1 tree retention and burning treatment (B50). Soil humus layer thickness and SOM content were positively loaded on PCA1, as were Vaccinium myrtillus biomass and cover, moss biomass, and the cover of all mosses except Polytrichum spp. group. Polytrichum spp. mosses were negatively loaded on PCA1. Negative loadings on PCA1 were also observed for biomass of dwarf-shrubs other than V. myrtillus (principally comprised of Vaccinium vitis-idaea), V. vitis-idaea cover, and biomass of forbs and graminoids along with Epilobium angustifolium L. and Deschampsia flexuosa (L.) Trin. cover. Lichen biomass and Cladonia spp. cover were also negatively loaded on the first principal component axis (Fig. 3).
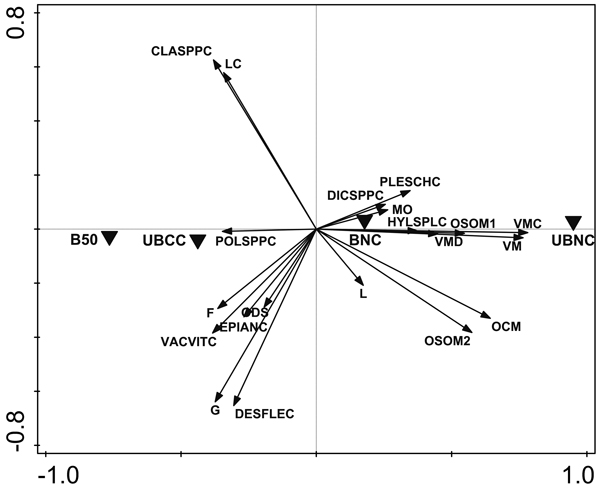
Fig. 3. Unconstrained PCA ordination results for soil and vegetation parameters, with sites as environmental variables. The variable titles as follows: OCM – organic hemic and sapric, i.e. Oe/Oa horizon (humus layer) thickness; OSOM1 – humus layer soil organic matter (SOM), %; OSOM2 – humus layer SOM stock, g m–2; L – litter mass; MO – moss biomass; VM – Vaccinium myrtillus biomass; VMD – dead V. myrtillus mass; ODS – biomass of dwarf-shrubs other than V. myrtillus, practically mostly Vaccinium vitis-idaea; F – forb biomass; G – graminoid biomass; LC – lichen biomass; CLASPPC – Cladonia spp. cover; PLESCHC – Pleurozium schreberi cover; DICSPPC – Dicranum spp. cover; HYLSPLC – Hylocomium splendens cover; VMC – V. myrtillus cover; POLSPPC – Polytrichum spp. cover; VACVITC – V. vitis-idaea cover; EPIANC – Epilobium angustifolium cover; DESFLEC – Deschampsia flexuosa cover. UBNC – unburned fully-stocked site (control); BNC – restoration-burned fully-stocked site; B50 – silviculturally-burned clearcut site with 50 m3 ha–1 green tree retention; UBCC – unburned complete clearcut site with no green tree retention.
The second axis (PCA2), which explained additional 9.8% of the variation in the data and was loaded with humus layer thickness, appeared to be related to internal variation within the sites that is defined by biophysical quality of substrate (Figs. 3, 4). The two most heavily disturbed sites UBCC and B50 had higher internal variation than the two less disturbed sites UBNC and BNC (Fig. 4).
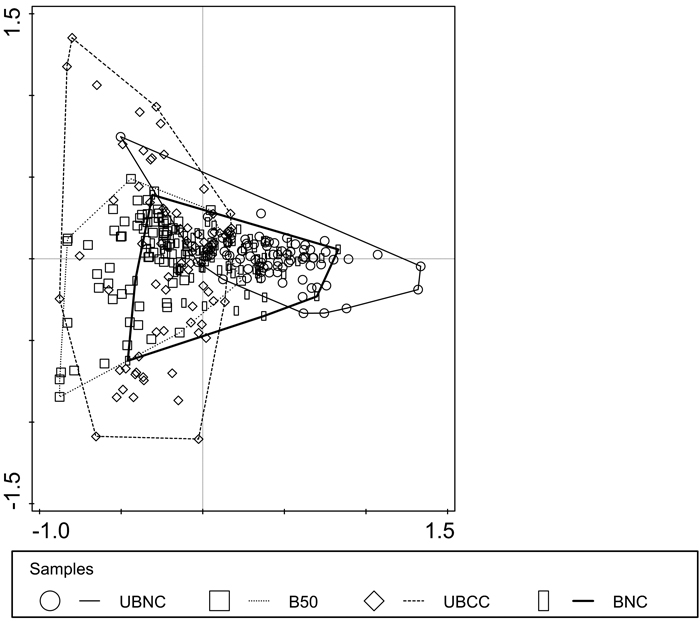
Fig. 4. Multivariate sample dissimilarity plot by site with enclosing envelopes. UBNC – unburned fully-stocked site (control); BNC – restoration-burned fully-stocked site; B50 – silviculturally-burned clearcut site with 50 m3 ha–1 green tree retention; UBCC – unburned complete clearcut site with no green tree retention.
3.3 Simulations of statistical testing outcomes depending on sampling strategy
In the current study, we had only one site per each of the four treatments to explore spatial variation of the parameters in depth. However, this setting does not show whether the observed differences between sites result from random variability among sites or from the applied treatments. To address this question for forthcoming experiments, we simulated the outcomes of potential future studies, based on the within-site variances and means observed here, an assumption on share of within-site variance out of total variance, and linear mixed-effect model theory (Suppl. files S1, S2).
Based on our simulation results, it should be possible to register the same differences in humus layer SOM stocks and total ground and field layer vegetation biomass as found in this study, and show that they are really related to the treatment, in a replicated mixed-effects models context, if variance between replicates (sites of the same treatment) comprised a maximum of 20% of total variance (Table 4). Differences in mineral SOM stocks were so small compared to variance in our data, that even at 10% variance component assumption the simulated null hypothesis rejection rates would be insufficient. For humus layer SOM, six replicates with 30 samples in each site would be needed to register significant differences between treatments, while for vegetation biomass, four or five replicates with 30 samples in each should be enough (Table 4). Should the variance between replicates comprise 50% of total variance, no analyzed amount of samples and replicates would bring enough statistical power (Table 4).
| Table 4. Null hypothesis keeping rates in testing for differences between sites and treatments, based on simulation results | ||
| Organic hemic and sapric, i.e. Oe/Oa horizon (humus layer) soil organic matter (SOM) stocks (log-transformed) | P | |
| nrep = 1, nsample = 30 | 0.07 | |
| var = 10% | nrep = 3, nsample = 80 | 0.05* |
| nrep = 4, nsample = 30 | 0.03* | |
| nrep = 5, nsample = 30 | 0.01** | |
| nrep = 6, nsample = 30 | < 0.001*** | |
| var = 20% | nrep = 3, nsample = 80 | 0.25 |
| nrep = 4, nsample = 30 | 0.15 | |
| nrep = 5, nsample = 30 | 0.08 | |
| nrep = 6, nsample = 30 | 0.03* | |
| var = 50% | nrep = 3, nsample = 80 | 0.67 |
| nrep = 4, nsample = 30 | 0.42 | |
| nrep = 5, nsample = 30 | 0.35 | |
| nrep = 6, nsample = 30 | 0.22 | |
| Mineral soil organic matter (SOM) stocks (log-transformed) | P | |
| nrep = 1, nsample = 90 | 0.046* | |
| var = 10% | nrep = 3, nsample = 90 | 0.57 |
| nrep = 4, nsample = 30 | 0.49 | |
| nrep = 5, nsample = 30 | 0.44 | |
| nrep = 6, nsample = 30 | 0.3 | |
| Ground and field-layer biomass | P | |
| nrep = 1, nsample = 30 | 0.007** | |
| var = 10% | nrep = 3, nsample = 90 | 0.02* |
| nrep = 3, nsample = 80 | 0.06 | |
| nrep = 4, nsample = 30 | 0.01** | |
| nrep = 5, nsample = 30 | < 0.001*** | |
| nrep = 6, nsample = 30 | < 0.001*** | |
| var = 20% | nrep = 3, nsample = 90 | 0.12 |
| nrep = 4, nsample = 30 | 0.05* | |
| nrep = 5, nsample = 30 | < 0.001*** | |
| nrep = 6, nsample = 30 | < 0.001*** | |
| var = 50% | nrep = 3, nsample = 90 | 0.59 |
| nrep = 4, nsample = 30 | 0.4 | |
| nrep = 5, nsample = 30 | 0.2 | |
| nrep = 6, nsample = 30 | 0.12 | |
| nrep = 6, nsample = 60 | 0.08 | |
| nrep = 6, nsample = 120 | 0.08 | |
| var – the proportion of total variance assumed to be due to variability between replicates; nrep – number of replicates; nsample – number of samples per replicate; P – null hypothesis keeping rate, significance levels: * – p < 0.05, ** – p < 0.01, *** – p < 0.001. | ||
4 Discussion
4.1 Magnitude of SOM stocks
Site-level mean humus layer SOM stocks in this study varied from ~2.3 (site B50) to ~4.5 kg m–2 (control site). For Swedish boreal forest podzol soils, mean humus layer soil organic carbon (SOC) stock was documented at 2.8 kg C m–2 (Olsson et al. 2009). With the SOC to SOM conversion factor of roughly 2, humus layer SOC stocks found in our study (i.e. ~2.25 kg C m–2) are somewhat lower than the mean from Swedish boreal podzol soils, but both results are of the same magnitude. Probably, the difference is due to different scale of sampling, where the data in Olsson et al. (2009) come from Swedish National Forest Inventory, while our data come from a single forest stand. Moreover, we sampled rather dry forests, while Swedish inventory included also moister sites.
4.2 Spatial variability of soil and vegetation parameters
We found the variation in soil parameters to be similar between sites that had undergone different disturbance types (a restoration burning treatment (BNC), control (UBNC), complete clearcut (UBCC), and clearcut with abundant retention and a silvicultural burning treatment (B50)). The variation in understorey vegetation biomass and cover, in contrast, was largely different between sites.
The intensity and severity of the prescribed burning used here had been relatively low. Obviously, only a small portion of heat energy was distributed downwards into the soil, which is typical for forest fires, while soil litter layer and understorey vegetation are the main compartments sustaining combustion, thus being readily consumed or at least damaged and killed by fire (Neary et al. 2005). This difference could cause the observed variability patterns in soil vs. vegetation.
Importantly, the variation of humus layer thickness did not increase immediately after burning (Laamanen 2002) and this pattern remained the same way also 13 years later in burned and clearcut sites. This variation was not different in burned sites and in unburned sites 13 years later (Table 1). In all cases, this variation was roughly similar for all disturbance types and points in time. Some previous studies have found increased variation in soil chemistry, e.g. nutrient levels, due to burnings (Harden et al. 2004; Lavoie and Mack 2012), but our result suggests that burning with and without clearcutting did not introduce additional variation in the thickness of humus layer to any noticeable degree.
4.3 Joint soil-vegetation patterns across the sites
Results of principal components analysis where our study sites with different disturbance type and severity were aligned closely along the first principal component axis indicated that disturbance severity was the main source of ecological variability. This is supported also by the heavy loading of humus layer thickness and SOM, and bilberry biomass and cover on PCA1. These parameters are known to reflect disturbance severity in clearcut and burned forests (Neary et al. 2005; Rodríguez and Kouki 2015). Similarly to humus layer SOM, the combination of all studied factors in PCA showed more prominent signs of heavy disturbance in the sites disturbed by clearcutting (UBCC and B50) than in the fully-stocked site disturbed by burning (BNC) and the undisturbed control site (UBNC, Fig. 3). The site that has undergone both clearcutting and a silvicultural-type site preparation burning (B50) appeared to be the most heavily disturbed (Fig. 3, see also Figs. 2a, 2c, 2f), based on soil and vegetation variables.
Biomass and cover of understorey vegetation, i.e. dwarf shrubs, mosses, lichens, forbs and graminoids, was associated with disturbance in agreement with common previously established knowledge. Biomass and cover of dwarf-shrubs and most mosses decrease due to disturbance, while lichens, forbs and graminoids are often regenerating abundantly in sites disturbed by fire and/or clearcutting (Fig. 3; Foster 1985; Shevtsova et al. 1995; Schimmel and Granström 1996; Nguyen-Xuan et al. 2000; Parlane et al. 2006; Waterhouse et al. 2011; Turtiainen et al. 2013; Johnson et. al. 2014; Stevenson and Coxson 2014; Rodríguez and Kouki 2015).
4.4 Implications for future sampling
In this study, we addressed the amount of within-site variability in sites of different silvicultural and restoration disturbance. To statistically infer the differences in soil and vegetation parameters, replication of sites within treatments would be necessary so as to separate the effect of treatment from the random variability among sites.
For future sampling, an interesting question is how to balance the measurement efforts between the number of sites per treatment (K) and the number of measurements per site (N). This task is conveniently done using simulation. First, several (e.g. 100 or 1000) datasets with fixed measurement efforts are simulated using different combinations of K and N and using prior information about the ratio of between-site variation and within-site variation and the effect sizes observed in this study. A mixed-effects model is fitted to each of the datasets and a conditional F-test on the effects of treatment is conducted. For each combination of N and K, the proportion of cases where the null hypothesis “treatment has no effect” is rejected is counted. The proportion gives your estimate of power for the planned study. The combination providing the highest power is then suggested for data collection.
In our case, the current data did not include information about the variability between sites. Therefore, this calculation was conducted by assuming that the share of between-site variability was 10, 20 and 50% of the total variability.
Puhlick et al. (2016) reported 34% of their predicted O-horizon C content variance in Acadian forest in central Maine, USA, to be related to dissimilarity between stands of the same treatment. They had two replicates per treatment, where harvest timings were not synchronized within treatments. That and a different ecoregion than in our study possibly suggests that in our experimental setup the between-replicate relative variance component should be smaller. Sites of “FIRE” experiment are located in a colder climatic zone, were selected to be as similar as possible, and then treated synchronously. Thus, we consider our leading assumption that within-treatment variance component related to between-site differences comprises 20% of total variance to be reasonable. In contrast to humus layer SOM and biomass, the observed differences in uppermost mineral SOM stocks in our study sites were so small compared to variance, that it would be impossible to detect this difference in a replicated study within the assumed effort budget. This supports our finding that the moderate fire intensity used in our study does not produce differences in mineral soil SOM. Our simulation results also show that should within-treatment variation component approach 50% of all variation, capturing the estimated difference statistically becomes unfeasible also for other parameters within the effort budget assumed.
In this study, we addressed the within-site variation of soil and vegetation parameters in the sub-xeric boreal forests of eastern Finland. We expect that the magnitude of variation and spatial independence of observations as registered here can be generalized to the sub-xeric forests of the wider area of the eastern part of Fennoscandia and also to other boreal areas of similar climate and forest site type. The methodological approach to guide the sampling efforts that was discussed here, however, should be even more widely applicable, possibly also to forests beyond boreal zone. Our findings suggest that with careful site selection and enough replicates it should be possible to capture and verify the differences in humus layer SOM and vegetation biomass of the magnitude observed in this study.
5 Conclusions and future research needs
In this study, we found variation in soil parameters to be roughly similar across sites of different disturbance, including prescribed burning and clearcutting. This suggests that either the disturbances have no effect on the spatial variability of soil properties, or 13 years of post-disturbance ecosystem recovery time is enough to mask these effects. Secondly and importantly, this variance equality means that it is easily possible to use inferential statistics to test for the effects on SOM stocks of disturbances of the kind as analysed here.
According to multivariate data analysis, the both burned and clearcut site (B50) seems to be the most heavily disturbed of the four sites studied here. Soil and vegetation parameters in that site depart the most from the undisturbed control. Fully-stocked site that was burned (BNC), however, seems to be much closer in its characteristics to the control site. This possibly suggests that if soil and vegetation conditions are to be maintained while applying restoration treatments for biodiversity conservation purposes, light restoration burnings in unharvested stands are to be favoured over silvicultural burnings after clearcutting.
Our simulations of testing outcomes within linear mixed-effects model approach suggest good practical possibilities to register the differences in a replicated context and offer a method to guide the sampling of disturbance effects in situations similar to studied here. We therefore encourage the researchers and practitioners to use this simulation-based sampling planning approach and continue the design-based collection and analysis of data on soil and vegetation across different forest disturbance types.
Acknowledgements
We thank Metsähallitus for providing the study sites for the “FIRE” project (http://forest.uef.fi/jarikouki/project_fire.htm) and this study and a trainee position for Ida Sara-Aho to assist in collecting field data. Mihails Čugunovs’ work was supported by University of Eastern Finland, Doctoral Programme in Forests and Bioresources. Laura Pekkola’s work was funded by Tranfor-M exchange programme. We also thank two anonymous reviewers for helping to improve the manuscript.
References
Ahti T., Hämet-Ahti L., Jalas J. (1968). Vegetation zones and their sections in northwestern Europe. Annales Botanici Fennici 5: 169–211.
Brown J.K., Smith J.K. (eds.) (2000). Wildland fire in ecosystems: effects of fire on flora. General Technical Report RMRS-GTR-42-vol. 2. U.S. Department of Agriculture, Forest Service, Rocky Mountain Research Station, Ogden, UT. 257 p.
Certini G. (2014). Fire as a soil-forming factor. Ambio 43(2): 191–195. http://dx.doi.org/10.1007/s13280-013-0418-2.
Diggle P.J., Ribeiro Jr P.J. (2007). Model Based Geostatistics. Springer, New York. 228 p. http://dx.doi.org/10.1007/978-0-387-48536-2.
European Committee for Standardization (2009). Solid biofuels – determination of ash content. EN 14775:2009. A standard method. https://standards.cen.eu/dyn/www/f?p=204:110:0::::FSP_PROJECT,FSP_ORG_ID:31903,19930&cs=19BF142A1249BB4166A8F577333355837. [Cited 8 Dec 2016].
Foster D.R. (1985). Vegetation development following fire in Picea mariana (black spruce) – Pleurozium forests of South-Eastern Labrador, Canada. Journal of Ecology 73(2): 517–534. http://dx.doi.org/10.2307/2260491.
Halme P., Allen K.A., Auniņš A., Bradshaw R.H.W., Brūmelis G., Čada V., Clear J.L., Eriksson A., Hannon G., Hyvärinen E., Ikauniece S., Iršėnaitė R., Jonsson B.G., Junninen K., Kareksela S., Komonen A., Kotiaho J.S., Kouki J., Kuuluvainen T., Mazziotta A., Mönkkönen M., Nyholm K., Oldén A., Shorohova E., Strange N., Toivanen T., Vanha-Majamaa I., Wallenius T., Ylisirniö A., Zin E. (2013). Challenges of ecological restoration: lessons from forests in northern Europe. Biological Conservation 167: 248–256. http://dx.doi.org/10.1016/j.biocon.2013.08.029.
Harden J.W., Neff J.C., Sandberg D.V., Turetsky M.R., Ottmar R., Gleixner G., Fries T.L., Manies K.L. (2004). Chemistry of burning the forest floor during the FROSTFIRE experimental burn, interior Alaska, 1999. Global Biochemical Cycles 18, GB 3014. http://dx.doi.org/10.1029/2003GB002194.
Heikkala O., Suominen M., Junninen K., Hämäläinen A., Kouki J. (2014). Effects of retention level and fire on retention tree dynamics in boreal forests. Forest Ecology and Management 328: 193–201. http://dx.doi.org/10.1016/j.foreco.2014.05.022.
Hotanen J.-P., Nousiainen H., Mäkipää R., Reinikainen A., Tonteri T. (2008). Metsätyypit – opas kasvupaikkojen luokitteluun. [Forest types – a guide for classification of site-types]. Metsäntutkimuslaitos. 182 p. ISBN-13: 978-952-5694-22-2.
Hyvärinen E., Kouki J., Martikainen P., Lappalainen H. (2005). Short-term effects of controlled burning and green-tree retention on beetle (Coleoptera) assemblages in managed boreal forests. Forest Ecology and Management 212(1–3): 315–335. http://dx.doi.org/10.1016/j.foreco.2005.03.029.
Hyvärinen E., Kouki J., Martikainen P. (2006). Fire and green-tree retention in conservation of red-listed and rare deadwood-dependent beetles in Finnish boreal forests. Conservation Biology 20(6): 1711–1719. http://dx.doi.org/10.1111/j.1523-1739.2006.00511.x.
Ilmatieteen laitos (1991). Tilastoja Suomen ilmastosta 1961–1990 – climatological statistics in Finland 1961–1990. Ilmatieteen laitos, Helsinki.
Ilmatieteen laitos (2016). http://ilmatieteenlaitos.fi/terminen-kasvukausi. [Cited 28 Nov 2016].
International Plant Names Index (2004). http://www.ipni.org/. [Cited 24 May 2016].
Johnson S., Strengbom J., Kouki J. (2014). Low levels of tree retention do not mitigate the effects of clearcutting on ground vegetation dynamics. Forest Ecology and Management 330: 67–74. http://dx.doi.org/10.1016/j.foreco.2014.06.031.
Kouki J. (2016). Ecology and biodiversity of boreal forests. http://forest.uef.fi/jarikouki/project_fire.htm. [Cited 28 Nov 2016].
Kouki J., Löfman S., Martikainen P., Rouvinen S., Uotila A. (2001). Forest fragmentation in Fennoscandia: linking habitat requirements of wood-associated threatened species to landscape and habitat changes. Scandinavian Journal of Forest Research 16(sup003): 27–37. http://dx.doi.org/10.1080/028275801300090564.
Laamanen J. (2002). Tulen voimakkuuden vaikutus metsikön pienialaiseen vaihteluun. [The effect of fire severity on small-scale spatial heterogeneity in forest stands]. MSc thesis. University of Joensuu, Faculty of Forest Sciences, Joensuu, Finland. 44 p. + 12 app.
Lavoie M., Mack M.C. (2012). Spatial heterogeneity of understory vegetation and soil in an Alaskan upland boreal forest fire chronosequence. Biogeochemistry 107(1): 227–239. http://dx.doi.org/10.1007/s10533-010-9547-x.
Liski J. (1995). Variation in soil organic carbon and thickness of soil horizons within a boreal forest stand – effect of trees and implications for sampling. Silva Fennica 29(4): 255–266. http://dx.doi.org/10.14214/sf.a9212.
Neary D.G., Ryan K.C., DeBano L.F. (eds.) (2005, revised 2008). Wildland fire in ecosystems: effects of fire on soils and water. General Technical Report RMRS-GTR-42-vol.4. U.S. Department of Agriculture, Forest Service, Rocky Mountain Research Station, Ogden, UT. 250 p.
Nguyen-Xuan T., Bergeron Y., Simard D., Fyles J.W., Paré D. (2000). The importance of forest floor disturbance in the early regeneration patterns of the boreal forest of western and central Quebec: a wildfire versus logging comparison. Canadian Journal of Forest Research 30(9): 1353–1364. http://dx.doi.org/10.1139/x00-067.
Nordstokke D.W., Zumbo B.D. (2010). A new nonparametric Levene test for equal variances. Psicologica 31: 401–430.
Olsson M.T., Erlandsson M., Lundin L., Nilsson T., Nilsson Å., Stendahl J. (2009). Organic carbon stocks in Swedish Podzol soils in relation to soil hydrology and other site characteristics. Silva Fennica 43(2): 209–222. http://dx.doi.org/10.14214/sf.207.
Parlane S., Summers R.W., Cowie N.R., van Gardingen P.R. (2006). Management proposals for bilberry in Scots pine woodland. Forest Ecology and Management 222(1–3): 272–278. http://dx.doi.org/10.1016/j.foreco.2005.10.032.
Puhlick J.J., Fraver S., Fernandez I.J., Weiskittel A.R., Kenefic L.S., Kolka R.K., Gruselle M.-C. (2016). Factors influencing organic-horizon carbon pools in mixed-species stands of central Maine, USA. Forest Ecology and Management 364: 90–100. http://dx.doi.org/10.1016/j.foreco.2016.01.009.
R Development Core Team (2013). R: a language and environment for statistical computing. R Foundation for Statistical Computing, Vienna, Austria. ISBN 3-900051-07-0. http://www.R-project.org.
Ribeiro P.J. Jr, Diggle P.J. (2001). geoR: a package for geostatistical analysis. R-NEWS 1(2):15–18.
Rodríguez A., Kouki J. (2015). Emulating natural disturbance in forest management enhances pollination services for dominant Vaccinium shrubs in boreal pine-dominated forests. Forest Ecology and Management 350: 1–12. http://dx.doi.org/10.1016/j.foreco.2015.04.029.
Schimmel J., Granström A. (1996). Fire severity and vegetation response in the boreal Swedish forest. Ecology 77(5): 1436–1450. http://dx.doi.org/10.2307/2265541.
Shevtsova A., Ojala A., Neuvonen S., Vieno M., Haukioja E. (1995). Growth and reproduction of dwarf shrubs in a subarctic plant community: annual variation and above-ground interactions with neighbors. Journal of Ecology 83(2): 263–275. http://dx.doi.org/10.2307/2261565.
Similä M., Junninen K. (2012). Ecological restoration and management in boreal forests – best practices from Finland. Metsähallitus, Natural Heritage Services, Vantaa. 54 p.
Smithwick E.A.H., Mack M.C., Turner M.G., Chapin III F.S., Zhu J., Balser T.C. (2005). Spatial heterogeneity and soil nitrogen dynamics in a burned black spruce forest stand: distinct controls at different scales. Biogeochemistry 76(3): 517–537. http://dx.doi.org/10.1007/s10533-005-0031-y.
Stevenson S.K., Coxson D.S. (2014). Can partial-cut harvesting be used to manage terrestrial lichen habitat? A review of recent evidence. Rangifer 35(23): 11–26. http://dx.doi.org/10.7557/2.35.2.3461.
Swanson M.E., Franklin J.F., Beschta R.L., Crisafulli C.M., DellaSala D.A., Hutto R.L., Lindenmayer D.B., Swanson F.J. (2010). The forgotten stage of forest succession: early-successional ecosystems on forest sites. Frontiers in Ecology and the Environment 9(2): 117-125. http://dx.doi.org/10.1890/090157.
Turtiainen M., Miina J., Salo K., Hotanen J.-P. (2013). Empirical prediction models for the coverage and yields of cowberry in Finland. Silva Fennica 47(3): 1005. http://dx.doi.org/10.14214/sf.1005.
Vanha-Majamaa I., Lilja S., Ryömä R., Kotiaho J.S., Laaka-Lindberg S., Lindberg H., Puttonen P., Tamminen P., Toivanen T., Kuuluvainen T. (2007). Rehabilitating boreal forest structure and species composition in Finland through logging, dead wood creation and fire: the EVO experiment. Forest Ecology and Management 250(1–2): 77–88. http://dx.doi.org/10.1016/j.foreco.2007.03.012.
Wallenius T. (2011). Major decline in fires in coniferous forests – reconstructing the phenomenon and seeking for the cause. Silva Fennica 45(1): 139–155. http://dx.doi.org/10.14214/sf.36.
Waterhouse M.J., Armleder H.M., Nemec A.F.L. (2011). Terrestrial lichen response to partial cutting in lodgepole pine forests on caribou winter range in west-central British Columbia. Rangifer 31(19): 119–134. http://dx.doi.org/10.7557/2.31.2.1996.
Zackrisson O. (1977). Influence of forest fire on the north Swedish boreal forest. Oikos 29(1): 22–32. http://dx.doi.org/10.2307/3543289.
Total of 41 references.
