Harri Silvennoinen  ,
Laura Pikkarainen,
Heini Nakola,
Matti Koivula,
Liisa Tyrväinen,
Jukka Tikkanen,
Philip Chambers,
Heli Peltola
,
Laura Pikkarainen,
Heini Nakola,
Matti Koivula,
Liisa Tyrväinen,
Jukka Tikkanen,
Philip Chambers,
Heli Peltola
Consistency of video and photo surveys in measuring attractiveness of forest stands managed with varying intensities
Silvennoinen H., Pikkarainen L., Nakola H., Koivula M., Tyrväinen L., Tikkanen J., Chambers P., Peltola H. (2024). Consistency of video and photo surveys in measuring attractiveness of forest stands managed with varying intensities. Silva Fennica vol. 58 no. 3 article id 23030. https://doi.org/10.14214/sf.23030
Highlights
- The more intensely a forest is treated silviculturally, the less it corresponds to people’s wishes and expectations for nature
- It is possible to assess the attractiveness of nature from both photographs and videos
- Evaluations from videos and images differed slightly, but these differences do not affect how treatments are ranked
- Photo and video assessments are not easy for everyone.
Abstract
We evaluated the consistency of video, ordinary photo, and panoramic photo surveys in measuring the attractiveness (recreational use, scenic values etc.) of forest stands managed with varying intensities. We also evaluated possible effects on the results caused by the personal background of citizen respondents and how the respondents experienced the evaluation events. Our experimental sites were in mature Scots pine (Pinus sylvestris L.) forests in eastern Finland and included two replicate sites which were unharvested (control, basal area 26 m2 ha–1), a selective cutting site (basal area 18 m2 ha–1), small openings sites (gap cut) with 5 and 20% retained trees, respectively, and one site which was clear cut with 3% retained trees. In our study, 71 volunteer forestry students evaluated the attractiveness of these sites from an ordinary photo, a panoramic photo, and a video, with a 0–10 scale. Based on this study, the unharvested forest was the most attractive and clear cutting was the least attractive, regardless of the evaluation method. This result was in line with a previous study using on-site evaluations of the same sites. The differences of respondents considering in how easy they felt to assess the attractiveness of the environment as a whole and in using different visualisation methods affected the result, unlike background variables of the respondents. The results of forest attractiveness were consistent between panoramic and ordinary photos, and the attractiveness scoring was slightly higher for them than for the video. We conclude that all the compared visualisation methods seem to be suitable for assessment of the attractiveness of forest views.
Keywords
environment;
assessment;
forest treatment;
preference;
visualization
-
Silvennoinen,
School of Forest Sciences, University of Eastern Finland, P.O. Box 111, FI-80101 Joensuu, Finland
 https://orcid.org/0000-0002-9095-7986
E-mail
harri.silvennoinen@uef.fi
https://orcid.org/0000-0002-9095-7986
E-mail
harri.silvennoinen@uef.fi
-
Pikkarainen,
School of Forest Sciences, University of Eastern Finland, P.O. Box 111, FI-80101 Joensuu, Finland
https://orcid.org/0000-0001-5301-3639
E-mail
laura.pikkarainen@uef.fi
- Nakola, School of Forest Sciences, University of Eastern Finland, P.O. Box 111, FI-80101 Joensuu, Finland E-mail heini.nakola@gmail.com
-
Koivula,
Natural Resources Institute Finland (Luke), Latokartanonkaari 9, FI-00790 Helsinki, Finland
https://orcid.org/0000-0001-6415-4904
E-mail
matti.koivula@luke.fi
-
Tyrväinen,
Natural Resources Institute Finland (Luke), Latokartanonkaari 9, FI-00790 Helsinki, Finland
https://orcid.org/0000-0001-5144-7150
E-mail
liisa.tyrvainen@luke.fi
-
Tikkanen,
School of Forest Sciences, University of Eastern Finland, P.O. Box 111, FI-80101 Joensuu, Finland
https://orcid.org/0000-0002-9693-8209
E-mail
jukka.tikkanen@uef.fi
-
Chambers,
School of Forest Sciences, University of Eastern Finland, P.O. Box 111, FI-80101 Joensuu, Finland
https://orcid.org/0000-0002-0586-3142
E-mail
philip.chambers@uef.fi
-
Peltola,
School of Forest Sciences, University of Eastern Finland, P.O. Box 111, FI-80101 Joensuu, Finland
https://orcid.org/0000-0003-1384-9153
E-mail
heli.peltola@uef.fi
Received 29 June 2023 Accepted 8 April 2024 Published 25 April 2024
Views 73116
Available at https://doi.org/10.14214/sf.23030 | Download PDF

1 Introduction
Forests provide multiple ecosystem services for society, ranging from the provisioning of timber and non-wood products to carbon sequestration and maintenance of biodiversity and recreational environments (Winkel et al. 2022). The attractiveness of the forest environment can be assessed based on its nature, scenery, and recreational values (Tyrväinen et al. 2014; Salo 2015). Trees easily attract attention in the forest (Liu and Nijhuis 2020; Shirpke et al. 2022; Zhou et al. 2022). Therefore, forest management intensity affects the attractiveness perceptions of the environment. In general, mature, dense, diverse, and natural forests are found attractive (Silvennoinen et al. 2002; Tyrväinen et al. 2017). Furthermore, selective cutting and gap cutting are experienced as more attractive than typical clear-cut areas. In any case, leaving retention trees in a harvested site improves the attractiveness of forest in-stand views (Koivula et al. 2020; Silvennoinen et al. 2022). According to environmental theories, certain environments are preferred by people. Characteristics of a pleasant environment include informativeness, interest, safety, accessibility, visibility, and diversity. Such environments provide opportunities for a wide variety of activities (Appleton 1975; Ulrich 1983; Kaplan and Kaplan 1989; Orians and Heerwagen 1992).
The evaluation of the attractiveness of scenery from photos has been used in environmental research for a long time (Kaplan et al. 1972; Zube et al. 1987), due to their general equivalency to evaluations of the real environment (Kellomäki and Savolainen 1984; Stamps 1990; Daniel and Meitner 2001; Sevenant and Anthrop 2011; Silvennoinen et al. 2022). However, contradictory results have also been obtained. The fear is that the mood, meaning, and novelty that differentiate photo-based from on-site landscape experiences (Hul and Stewart 1992). In this sense, panoramic photo may have certain advantages, as it has been found to convey real environmental sensations better than ordinary photo (Higuera-Trujillo et al. 2017). Photos and other visualisation methods have often been used because they are cheaper than on-site evaluations (Daniel and Meitner 2001). It is also easier to manage the presentation and its conditions with different visualization methods (Surova and Pinto-Correia 2008; Sevenant and Anthrop 2011). However, these presentation modes are found to describe only a fraction of details of the scene such as underground vegetation (Karjalainen and Tyrväinen 2002), which may affect the evaluation result (Nielsena et al. 2012).
Visual observation of the environment has mainly been based on photo evaluations (Stamps, 2010; Schüpbach et al. 2016; Svobodova et al. 2017). However, such static presentation does not fully reflect reality (Heft and Nasar 2000; Zhang et al. 2020). In a dynamic presentation, such as a video, observation of the environment may be more realistic (Gibson 2014), especially considering that it contains moving elements and sounds (Daniel and Meitner 2001; Huang 2009). In addition, more attention can be paid to the forest floor (Liu and Nijhuis 2020), which can affect the assessment of the whole environment (Cottet et al. 2018; Li et al. 2020). For the evaluation of diverse environments, it is generally recommended to use several photos or larger panoramic images (Palmer and Hoffman 2001), which help aesthetic evaluations to correlate more strongly with the real environment (Sevenant and Anthrop 2011), but not always (Meitner 2004).
Previous methodological comparisons of static and dynamic presentations have focused on open and semi-open landscapes that include cultural features (Vining and Orland 1989; Heft and Nasar 2000; Huang 2009; Stamp 2016; Svobodova et al. 2018). Only a few such methodological comparisons have been conducted in forested areas. Vining and Orland (1989) evaluated the environmental quality of forests using photos and videos. In turn, Heft and Nasart (2000) evaluated forested roadside views with videos and freeze frames from videos with static and dynamic methods. Overall, the comparisons between static and dynamic methods have produced both equivalent (Vining and Orland 1989; Rohrmann et al. 2000; Nasar 2008; Stamp 2016) and divergent results (Hetherington et al. 1993; Heft and Nasar 2000; Svobodova et al. 2018). In the latter case, static methods produced on average higher preference values (Heft and Nasar 2000; Svobodova et al. 2018).
The interpretation and understanding of photos and videos may vary depending on how the viewer understands the nature of the described object (Moriarty 1996). A visual image is a subjective experience mixed with mental images, impressions, and illusions (Shore 1998). The respondent’s background may affect the similarity between photo and on-site evaluations, but there have been no differences between non- and forest professionals or between different age groups (Silvennoinen et al. 2022). In comparative studies of static and dynamic methods (photo vs. video), the effect of respondent background on results has not been studied earlier. The impact of factors related to the evaluation event and experience has also not been previously studied in comparative methodological studies, so the present study is unique also in this respect. On the other hand, in terms of landscape valuations, effect of background variables has been evaluated since the late 20th century. (Kellomäki 1975; Zube et al. 1983).
In this study, we evaluated the consistency of video, ordinary, and panoramic photo surveys in measuring the attractiveness perceptions of views of forests managed with varying intensities. We also evaluated possible effects on the results between visualization methods caused by the background of respondents and factors related to the assessment event. Evaluations were carried out in a pathless environment. Research questions were:
1. Does the visualisation method have an impact on the forest environment attractiveness?
2. Does the background variables of the respondents or evaluation event have an impact on the results?
2 Material and methods
2.1 Study sites
Study sites were located in mature Scots pine (Pinus sylvestris L.) dominated Vaccinium-type forest (80–110 years old, average height of dominant trees about 21 meters) with flat topography in Ruunaa area in Lieksa, Eastern Finland (Fig. 1). The field and bottom layers of these forests were dominated by Vaccinium myrtillus L., Vaccinium vitis-idaea L., Calluna vulgaris (L.) Hull, and Cladonia lichens, Empetrum nigrum L. dwarf shrubs, and Dicranum, Hylocomium, and Pleurozium mosses. The study included two examples each of unharvested sites (control, basal area 26 m2 ha–1), selectively cut sites (18 m2 ha–1), gap cut sites (gap cut) with 5% (1.3 m2 ha–1) and 20% (5.2 m2 ha–1) retained of initial basal area of control in harvested parts, respectively, and one site which was clear cut with 3% (0.8 m2 ha–1) retained trees (Fig. 2). The areas harvested in gap cuts were between 0.2–0.3 ha, and for the clear cut it was 2.5 ha. All treatments were carried out in the winter of 2011. Same study sites were previously used in the study of Silvennoinen et al. (2022).

Fig. 1. A map of Finland and location of study area of forest attractiveness in Ruunaa area in Lieksa, eastern Finland.
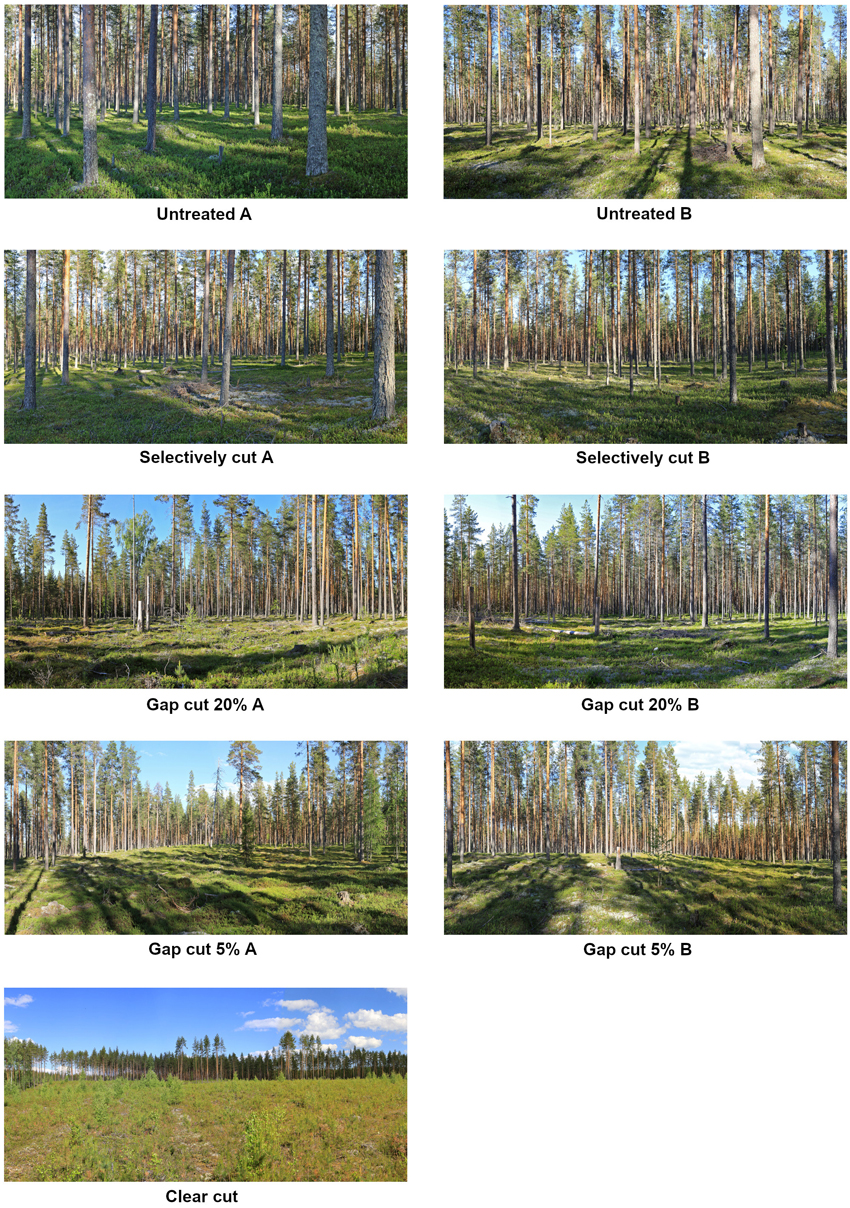
Fig. 2. Evaluated Scots pine dominated Vaccinium-type forest views in panorama images including two replicate sites which were unharvested (control, basal area 26 m2 ha–1), a selective cutting site (basal area 18 m2 ha–1), small openings sites (gap cut) with 20 and 5% retained trees, respectively, and one site which was clear cut with 3% retained trees.
The study sites were photographed in 2017 and videotaped in 2021 (Fig. 3). To standardize weather conditions, the sites were photographed and videotaped in clear sky. Photos were taken with a full-frame digital camera (Canon EOS 5D Mark III). Ordinary photos were taken horizontally with a 35 mm lens, whereas panorama photos were taken and assembled from vertical photos taken using a 50 mm lens. The aspect ratio was 1.5 (horizontal angle 63°) in ordinary photos and 2 (94°) in panorama photos. In our study photo without specification means both photo formats (ordinary and panoramic). The videos were filmed with an image stabilizer on a GoPro Hero 9 camera with a 16.5 mm lens which corresponds to a full frame camera (106°). The original aspect ratio of the videos (1.33) was set to 1.8 to match the aspect ratio of the photos. The photos and videos were taken from the eye level without inclinations, because people are good at observing horizontal and vertical tilts (Betts and Curthoys 1998). Photos and videos were cropped similarly in terms of horizontal positioning, which contributes to their comparability (Svobodova et al. 2018). The videos were filmed at walking speed, without stops, going in the same direction as that of the corresponding photos.
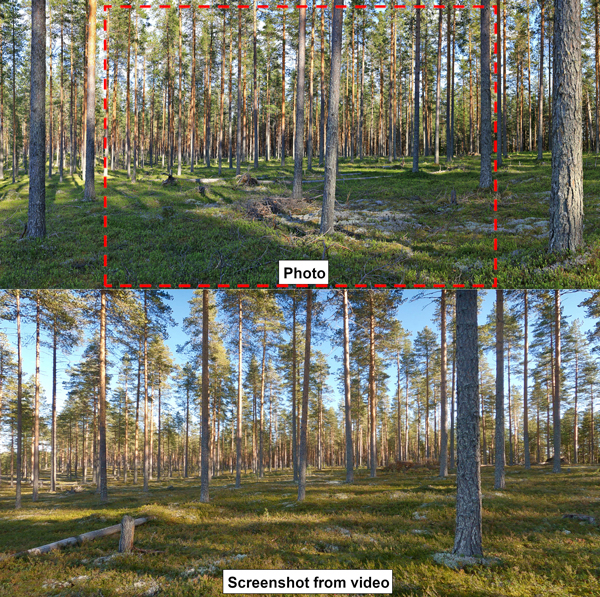
Fig. 3. Example photo and video views used in our study (selective cut). Standard photo size cropped with a red dotted line from a panoramic image.
2.2 Evaluation of forest site attractiveness
The evaluation of forest site attractiveness included 9 ordinary photos, 9 panoramic photos and 9 videos, thus making up a total of 27 visual materials for nine forest sites. The displayed order of the photos was random to minimise the “order effect” in the photo evaluation (Brown and Daniel 1987; Meitner 2004). The photos and videos were reflected via a data projector (Panasonic PT-VMZ51) on a large screen. We requested each respondent to rate each photo and video according to how well they correspond to their wishes and expectations (recreational use, scenic values, etc.), using a 11-step scale from 0(does not correspond to wishes and expectations at all) to 10 (corresponds perfectly). These wishes and expectations are later in the text referred to as attractiveness (see Koivula et al. 2020). The scale used an extended variant of the “Likert” scale used widely in social sciences (Joshi et al. 2015), to make it easier to distinguish the response options from each other (Tyrväinen et al. 2017). This was done to avoid the so-called end-point problem, where the used scale could run out if very high scores were too generously given in the beginning (Brown and Daniel 1990). All study sites were also shown as previews for respondents before the actual evaluation to help them calibrate their evaluations to the existing evaluation scale (Brown and Daniel 1990; Meitner 2004). In the evaluation event, the photos were displayed for five seconds and the videos, without sound, lasted for 50 seconds. Respondents were asked to evaluate the actual environment, not the photos or videos displayed. In visual evaluations, it is important to indicate whether to evaluate the photo or the environment it presents (Scott and Canter 1997; Meitner 2004). After the evaluation, the respondents answered questions related to the evaluation event and methodology (Table 1).
| Table 1. Evaluation event of measuring forest attractiveness: grouping variables related to the evaluation event and methods (% of respondents). | ||
| Grouping variable: | Category: | |
| To evaluate this number of photos and videos *) | Moderately or very effortless | 51.4 |
| The evaluation of attractiveness in general *) | Moderately or very easy | 52.9 |
| Photos contra videos (the easy of evaluations): *) | Easier from the photos | 17.1 |
| Easier from the videos | 27.1 | |
| Equally easy | 55.7 | |
| Imagining the forest from the photos *) | Well or very well | 75.7 |
| Imagining the forest from the videos *) | Well or very well | 84.3 |
| The quality of the images was good | Yes | 100 |
| The quality of the videos was good | Yes | 95.8 |
| The time of looking photos was | Too long | 5.7 |
| About right | 91.4 | |
| Too short | 2.9 | |
| The length of the videos was | Too long | 41.4 |
| About right | 55.7 | |
| Too short | 2.9 | |
| The vertical motion in the videos: *) | Positive | 40.0 |
| Neutral | 50.0 | |
| Negative | 10.0 | |
| The poorer quality of images and videos would have affected to the evaluation *) | Yes | 56.3 |
| Noises (e.g., birds and wind) would have affected to the evaluation *) | Yes | 53.5 |
| Particular attention to the forest floor *) | Yes | 45.7 |
| Particular attention to the trees *) | Yes | 54.2 |
| *) Involved in group analyses according to the grouping presented here. | ||
The aim was to involve more than 50 volunteer evaluators to maintain average predictability (see Islam 2018). The evaluations were done related to seven randomly selected forestry student lectures at the University of Eastern Finland on the Joensuu campus. About 80% of students participating in lectures did these evaluations.
In total, 71 volunteer participated in the evaluations, and 57.7% of them were Finnish students. The proportion of women in the evaluation was slightly lower (45.1%) compared to men. Most participants were 20–27 years old (70.4%).
2.3 Data analysis
All statistical analyses were done using IBM SPSS Statistics v.27.0. software. We used a repeated measures ANOVA to examine the equivalence of the results of the three different visualisation methods. Meitner (2004) used the same method to analyse the impact of environments, presentation methods and interactions between them. The assumption of the analysis was that the average of the 11-step scale of each method would be the same. The repeated measures ANOVA assumes that the internal correlations of the visualisation methods are consistent; this assumption was tested with the Mauchly’s test of sphericity. Because this assumption was not met, we used the Huynh-Feldt test which is recommended if the Greenhouse-Geisser epsilon value of the sphericity test is greater than 0.75 (Robey and Barcikowski 1984; Girden 1992). In this case, Greenhouse-Geisser is too conservative and would result in incorrectly rejecting the null hypothesis that sphericity holds, which was the case for our data. Huynh-Felt correction have been developed to alter the degrees of freedom and produce an F-ratio where the Type I error rate is reduced. The repeated measures ANOVA was used both for combined data (average of all forest treatments) and for each treatment separately. A statistically significant difference between the visualisation methods led to a subsequent contrast analysis (repeated method), which identifies significant pair-wise differences. Pearson’s correlation test was used to test correlations between the visualisation methods using the whole data.
We also examined how a set of background variables of respondents and especially the factors involved in the evaluation event affected differences between assessment methods. For group analyses, respondents were divided into 12 different groups based on demographic variables, evaluation event and visualisation methods. The purpose was to use such variables which make possible the statistical analyses and divide participants into clear groups. The background variables included gender (man/woman) and nationality (Finnish/other). Based on the evaluation event and visualisation methods, the respondents were grouped according to the variables set out in Table 1. The effect of video and photo duration was not analysed, because only a few respondents considered the videos and photos too short. Group evaluation was not done in respect of photo and video quality, because everyone thought the photos, and almost everyone thought the videos, were of good quality. We also used a contrast analysis to find out whether the differences between the visualisation methods were similar between the groups. In turn, the paired-samples t-test was used to identify differences between visualisation methods within groups. Group analysis was first performed on combined data (average of all forest treatments). If a statistically significant difference was found in the entire data, the analysis was continued separately for each treatment. In all tests, we interpret p ≤ 0.05 as significant.
3 Results
3.1 Similarity of the three visualisation methods
All three visualisation methods produced similar orders of perceived attractiveness of forest management treatments. The perceived attractiveness decreased as the forest management intensity increased, i.e., the unharvested forest was the most attractive and clear cut was the least attractive, and the rest of the treatments fell between these two. The photo format had no impact on the evaluation result, but video and photo evaluations differed from each other. On average, the attractiveness of the site was perceived as lower in the video than in either of the photo formats (Table 2, Fig. 4). The attractiveness of the unharvested forests and the selectively cut forests were evaluated as lower from the video compared to both two photo formats. In the two most intensive management treatments, clear cuts, and gap cuts with 5% retention, the difference was only observed between the video and the panoramic photo evaluation. In gap cuts with 20% retention, all visualisation methods gave similar results. However, correlations between visualisation methods were strong: video/ordinary photo 0.894; video/panorama 0.902; and ordinary photo/panorama 0.938 (p < 0.001 in all cases).
| Table 2. Statistical differences in forest attraction between visualization methods: entire data and treatments. Significant < 0.01 in bold and significance 0.01–0.05 in italic and underscore. | |||||
| Treatment: | F | p | Contrast: | F | p |
| Average of all treatments | 19.992 | <0.001 | Video vs. Photo | 25.465 | <0.001 |
| Video vs. Panorama | 24.336 | <0.001 | |||
| Photo vs. Panorama | 0.119 | 0.731 | |||
| Untreated | 16.722 | <0.001 | Video vs. Photo | 22.863 | <0.001 |
| Video vs. Panorama | 17.719 | <0.001 | |||
| Photo vs. Panorama | 2.490 | 0.119 | |||
| Selectively cut | 18.601 | <0.001 | Video vs. Photo | 25.909 | <0.001 |
| Video vs. Panorama | 20.132 | <0.001 | |||
| Photo vs. Panorama | 1.508 | 0.224 | |||
| Gap cut 20% | 3.071 | 0.054 | |||
| Gap cut 5% | 4.018 | 0.021 | Video vs. Photo | 3.660 | 0.060 |
| Video vs. Panorama | 7.456 | 0.008 | |||
| Photo vs. Panorama | 0.391 | 0.534 | |||
| Clear cut | 4.059 | 0.029 | Video vs. Photo | 2.599 | 0.111 |
| Video vs. Panorama | 6.532 | 0.013 | |||
| Photo vs. Panorama | 1.880 | 0.175 | |||
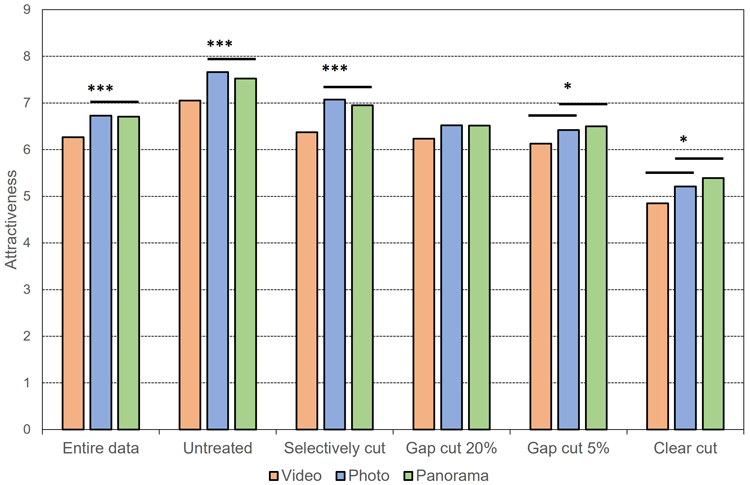
Fig. 4. Statistical differences in forest attraction between visualization methods: entire data and treatments. Equal line connects methods that did not differ statistically from each other (variance analysis of repetition measurements). Statistical significance: * < 0.05; ** < 0.01; *** < 0.001. Forest treatments presented in the Fig. 2 caption.
3.2 Effects of experiencing evaluation event
Approximately half of the respondents considered the evaluation event effortless and easy (Table 1). A little more than half of the respondents considered the photos and videos equally easy to evaluate. About a quarter considered the video assessment easier and less than a fifth the photo assessment easier. Both photos and videos were considered to be of good quality. Most respondents felt that they were able to imagine the real environment from photos and videos.
The displayed time for photos was considered sufficient, but many respondents felt that the videos lasted too long. Only one in ten respondents considered the small vertical motion in the displayed video to be disturbing. More than half of the respondents felt that the lower quality of the photos and videos would have affected their assessment. Furthermore, the videos were shown without sound, and again, more than half of the respondents felt that the sounds might have influenced their assessment. In the evaluation event, less than half of the respondents paid special attention to the undergrowth vegetation whereas over half paid special attention to trees. The undergrowth vegetation received special attention much more often from video (32.9% of respondents) than from photos (12.9%). In turn, the trees received special attention more often from photos (32.9%) than from videos (21.4%).
3.3 Respondent-group analyses
In the respondent group analysis of the entire data (average of all forest treatments), there were differences in three groupings: easiness of assessing attractiveness, easiness of methods, and paying particular attention to undergrowth (Tables 3 and 4, Fig. 5). Therefore, the analysis was performed separately for these groups under different forest treatments. If the setting of the evaluation was found to be easy, the difference occurred only between ordinary photos and videos. If the evaluation was not easy, the attractiveness was evaluated to be, on average, statistically highly significantly lower in videos than in photos. Perceived experience of the evaluation event as easy or less easy separated the respondents´ evaluations of forest views, which represented either unharvested forest, selective cutting, and gap cutting with 5% retention. In all these treatments, the attractiveness was rated statistically higher in photos than in videos if the evaluation event was considered less easy. For those who considered the evaluations as easy, a difference occurred between the ordinary photos and the videos of selectively cut and unharvested forests.
| Table 3. Statistical differences in forest attraction between visualization methods in group and pair comparisons: entire data and treatments. Presentation methods: V = Video; Ph = Photo; Pa = Panorama. Significant < 0.01 in bold and significance 0.01–0.05 in italic and underscore. | ||||||
| Grouping factor | Treatment | Group * Method | Contrasts of Interaction | |||
| F | p | Contrast | F | p | ||
| Easiness of assessing attractiveness | Entire data | 5.847 | 0.005 | V vs. Ph | 4.294 | 0.042 |
| V vs. Pa | 9.955 | 0.002 | ||||
| Ph vs. Pa | 1.625 | 0.207 | ||||
| Untreated | 3.644 | 0.033 | V vs. Ph | 4.576 | 0.036 | |
| V vs. Pa | 4.816 | 0.032 | ||||
| Ph vs. Pa | 0.110 | 0.741 | ||||
| Selectively cut | 3.772 | 0.030 | V vs. Ph | 1.242 | 0.269 | |
| V vs. Pa | 7.106 | 0.010 | ||||
| Ph vs. Pa | 3.406 | 0.069 | ||||
| Gap cut 5% | 3.619 | 0.031 | V vs. Ph | 1.237 | 0.270 | |
| V vs. Pa | 7.930 | 0.006 | ||||
| Ph vs. Pa | 2.528 | 0.117 | ||||
| The easiness of methods | Entire data | 3.123 | 0.020 | V vs. Ph | 3.813 | 0.027 |
| V vs. Pa | 3.846 | 0.026 | ||||
| Ph vs. Pa | 0.474 | 0.624 | ||||
| Untreated | 3.206 | 0.017 | V vs. Ph | 4.101 | 0.021 | |
| V vs. Pa | 3.367 | 0.040 | ||||
| Ph vs. Pa | 1.250 | 0.293 | ||||
| Selectively cut | 4.295 | 0.003 | V vs. Ph | 6.570 | 0.002 | |
| V vs. Pa | 3.157 | 0.049 | ||||
| Ph vs. Pa | 2.205 | 0.118 | ||||
| Gap cut 20% | 2.549 | 0.045 | V vs. Ph | 2.298 | 0.108 | |
| V vs. Pa | 3.592 | 0.033 | ||||
| Ph vs. Pa | 1.046 | 0.357 | ||||
| Particular attention to undergrowth | Entire data | 5.564 | 0.006 | V vs. Ph | 6.028 | 0.017 |
| V vs. Pa | 8.067 | 0.006 | ||||
| Ph vs. Pa | 0.152 | 0.697 | ||||
| Untreated | 4.382 | 0.017 | V vs. Ph | 5.093 | 0.027 | |
| V vs. Pa | 6.477 | 0.013 | ||||
| Ph vs. Pa | 0.009 | 0.925 | ||||
| Selectively cut | 3.738 | 0.031 | V vs. Ph | 0.489 | 0.487 | |
| V vs. Pa | 6.664 | 0.012 | ||||
| Ph vs. Pa | 5.626 | 0.021 | ||||
| Gap cut 20% | 3.592 | 0.033 | V vs. Ph | 3.275 | 0.075 | |
| V vs. Pa | 5.349 | 0.024 | ||||
| Ph vs. Pa | 0.880 | 0.352 | ||||
| Table 4. Statistical differences in forest attraction between visualization methods in intragroup comparisons: entire data and treatments. Presentation methods: V = Video; Ph = Photo; Pa = Panorama. Significant < 0.01 in bold and significance 0.01–0.05 in italic and underscore. | |||||||
| Treatment | Contrast | Easiness of assessing attractiveness | |||||
| Moderately or very easy | Less easy | ||||||
| t | p | t | p | ||||
| Entire data | V vs. Ph | 2.091 | 0.044 | 5.994 | <0.001 | ||
| V vs. Pa | 1.707 | 0.096 | 5.363 | <0.001 | |||
| Ph vs. Pa | 1.168 | 0.251 | 0.630 | 0.533 | |||
| Untreated | V vs. Ph | 2.042 | 0.049 | 4.784 | <0.001 | ||
| V vs. Pa | 1.635 | 0.111 | 4.155 | <0.001 | |||
| Ph vs. Pa | 0.988 | 0.330 | 1.359 | 0.184 | |||
| Selectively cut | V vs. Ph | 2.953 | 0.006 | 4.201 | <0.001 | ||
| V vs. Pa | 1.467 | 0.151 | 5.184 | <0.001 | |||
| Ph vs. Pa | 2.577 | 0.014 | 0.380 | 0.707 | |||
| Gap cut 5% | V vs. Ph | 0.567 | 0.574 | 2.059 | 0.048 | ||
| V vs. Pa | 0.086 | 0.932 | 3.479 | 0.001 | |||
| Ph vs. Pa | 0.666 | 0.509 | 1.507 | 0.142 | |||
| Treatment | Contrast | The easiness of methods | |||||
| Easier from the photos | Easier from the videos | Equally easy | |||||
| t | p | t | p | t | p | ||
| Entire data | V vs. Ph | 4.720 | 0.001 | 3.416 | 0.003 | 2.457 | 0.019 |
| V vs. Pa | 3.398 | 0.006 | 3.130 | 0.006 | 2.410 | 0.021 | |
| Ph vs. Pa | 0.621 | 0.547 | 0.628 | 0.538 | 0.708 | 0.483 | |
| Untreated | V vs. Ph | 3.680 | 0.004 | 3.024 | 0.007 | 2.100 | 0.042 |
| V vs. Pa | 2.207 | 0.050 | 3.474 | 0.003 | 1.652 | 0.107 | |
| Ph vs. Pa | 1.287 | 0.224 | 0.317 | 0.755 | 1.160 | 0.253 | |
| Selectively cut | V vs. Ph | 4.072 | 0.002 | 3.456 | 0.003 | 2.476 | 0.018 |
| V vs. Pa | 3.500 | 0.005 | 2.891 | 0.010 | 1.957 | 0.058 | |
| Ph vs. Pa | 2.493 | 0.030 | 0.403 | 0.692 | 0.796 | 0.431 | |
| Gap cut 20% | V vs. Ph | 2.930 | 0.014 | 1.102 | 0.285 | 0.864 | 0.393 |
| V vs. Pa | 2.449 | 0.032 | 1.481 | 0.156 | 0.157 | 0.876 | |
| Ph vs. Pa | 0.484 | 0.638 | 1.022 | 0.320 | 1.000 | 0.324 | |
| Treatment | Contrast | Particular attention to undergrowth | |||||
| Yes | No | ||||||
| t | p | t | p | ||||
| Entire data | V vs. Ph | 1.744 | 0.091 | 5.495 | <0.001 | ||
| V vs. Pa | 1.313 | 0.199 | 5.747 | <0.001 | |||
| Ph vs. Pa | 0.631 | 0.533 | 0.100 | 0.921 | |||
| Untreated | V vs. Ph | 1.681 | 0.103 | 4.863 | <0.001 | ||
| V vs. Pa | 1.169 | 0.251 | 4.304 | <0.001 | |||
| Ph vs. Pa | 1.000 | 0.325 | 1.339 | 0.189 | |||
| Selectively cut | V vs. Ph | 2.483 | 0.019 | 4.946 | <0.001 | ||
| V vs. Pa | 0.975 | 0.337 | 6.533 | <0.001 | |||
| Ph vs. Pa | 2.436 | 0.021 | 0.666 | 0.510 | |||
| Gap cut 20% | V vs. Ph | 0.395 | 0.696 | 2.675 | 0.011 | ||
| V vs. Pa | 0.431 | 0.669 | 2.701 | 0.010 | |||
| Ph vs. Pa | 1.027 | 0.313 | 0.397 | 0.694 | |||
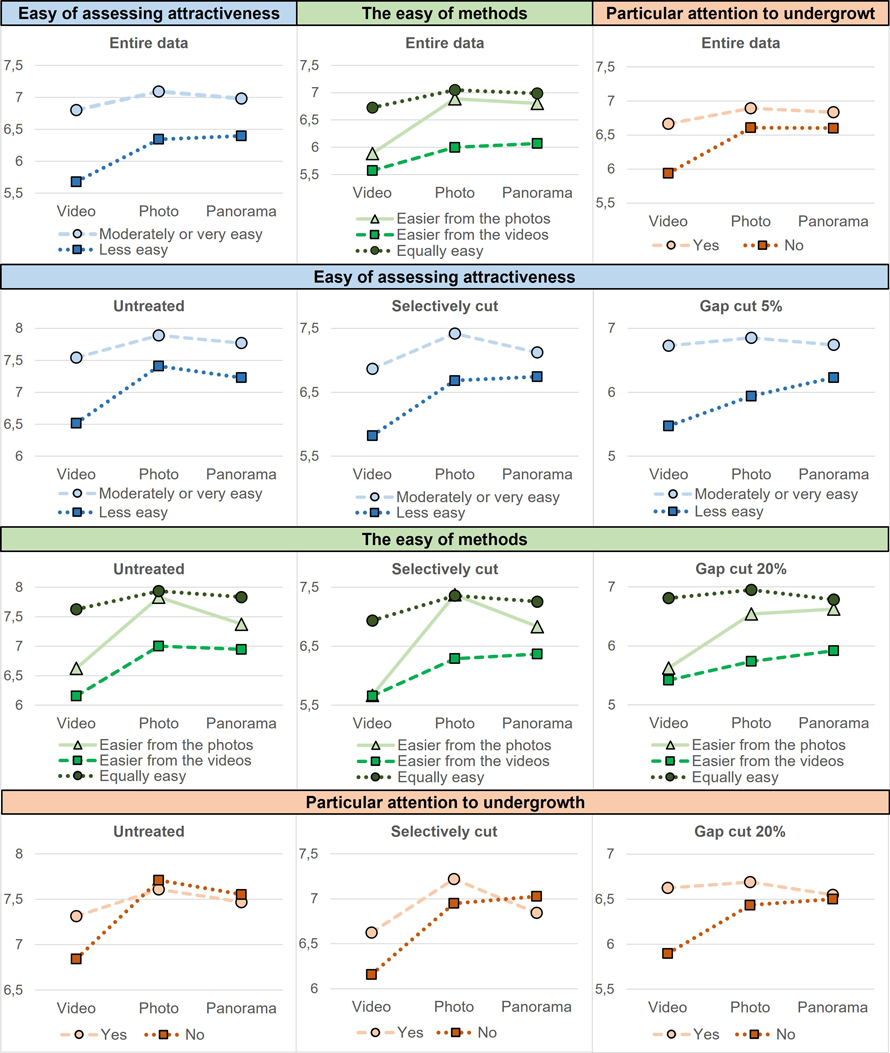
Fig. 5. The visualization method averages with groupings that showed a statistical difference in forest attraction (y-axis). At the top side by side are the groups that had statistical significant differences in the entire data. Below them are the statistical significant differences that those groups had with different forest treatments. Statistical significant differences between groups in Table 3 and internal in Table 4. Forest treatments presented in the Fig. 2. caption.
If either the video or the photo evaluation was considered easier, the attractiveness of the forest view was, on average, lower from videos than from photos. If the visualisation methods were considered equally easy, the attractiveness was evaluated as being similar between videos and photos. The above-mentioned grouping affected the results in the forests which were unharvested, selectively cut, and gap cut with 20% retention. Respondents whose experience with photos or videos was easier than with other methods, evaluated the attractiveness of unharvested and selectively cut forests higher from photos than from videos. Similarly, respondents whose experience with photo evaluations was easier, evaluated the attractiveness of gap cut with 20% retention higher from photos than from videos. Furthermore, respondents who evaluated the visualisation methods with equal ease, rated the attractiveness of unharvested and selectively cut forests to be higher in ordinary photos than in videos.
Respondents who paid no specific attention to the undergrowth vegetation rated the attractiveness, on average, statistically highly significantly lower in the videos than in the photos. If attention was paid to the undergrowth vegetation, the attractiveness was found to be consistent in all visualisation methods. Special attention to the undergrowth separated the respondents in the unharvested forests, the selectively cut forests, and forests with a small opening (gap cut) with 20% retention trees. The attractiveness of forest views was perceived as higher in photos than in videos among respondents who had paid no special attention to the undergrowth vegetation. In selectively cut sites, the attractiveness of the forest was perceived as higher in the ordinary photos than in the panoramic photos or videos among respondents who had paid special attention to the undergrowth vegetation.
4 Discussion
The most attractive forest from an in-stand view was the unharvested forest, whereas the clear-cut forest was considered to be the least attractive. Our results align with previous similar studies (O’Brien 2006; Putz et al. 2008; Tyrväinen et al. 2017; Koivula et al. 2020). The evaluation of attractiveness was consistent between both the ordinary and the panoramic photos. The video evaluations provided slightly lower attractiveness scores than the other two visualisation methods. However, the ranking of the attractiveness of different treatments remained similar in our study regardless of the visualisation method. Therefore, all these visualisation methods can be used to evaluate the impact of forest management intensity on the perceived attractiveness of structurally simple forests. However, if the respondents felt the whole concept of assessing forests was difficult, or they found that some of the visualisation methods were challenging, it affected the evaluation results. The attractiveness of different treatments was, in our study, also very similar to previous studies in similar environments based on photo and on-site evaluations (Koivula et al. 2020; Silvennoinen et al. 2022), which contributes to the reliability of the study.
Photo and video evaluations produced slightly different environmental attractiveness scores, supporting comparative studies using static and dynamic visualisation methods (Vining and Orland 1989; Hetherington et al. 1994; Heft and Nazar 2000; Svobodova et al. 2018). Static presentations have sometimes obtained higher attractiveness scores than dynamic presentations (Heft and Nasar 2000; Svobodova et al. 2018). The reason may be that static presentation is easier to interpret than dynamic (Heft and Nazar 2000). In static presentation, careful positioning of the photo also increases its attractiveness compared to the video presentation (Svobodova et al. 2018). In our study, special attention was paid to the photo positioning, which may have contributed to the evaluation differences between photos and videos.
In a forest landscape study by Vining and Orland (1989), video and photo evaluations produced similar results, but the photos were still images of the video. In our study, the differences between video and photo scores were relatively small: the correlations between visualisation methods were stronger than those presented by Palmer and Hoffman (2001). We compared the methods (videos and photos) in a pathless forest environment, which has not been done in previous studies. Therefore, our study setting reflects real life situation, since in Finland you can move freely in forests and engage in various activities (Neuvonen et al. 2022). Globally, it is more common to travel in limited routes and trails (Bell et al. 2008). The assessment in a pathless forest may differ from the assessment along the route, especially if the stand is too dense hindering walking (Tyrväinen et al. 2017). In our study, the forests were relatively easy for walking, so the difference between the assessment from the path or pathless environment may not be significant.
Static presentation methods, such as photos, have been criticised for the fact that they lack the normal environmental experience, which is usually generated in a dynamic environment and further emphasised by the observer’s own movements (Gibson 2014). However, in this study, most of the respondents felt that the real environment was somewhat as easy to imagine from a dynamic (video) as from a static presentation (photos). The impact of sound on the evaluation result was also recognised in this study, even though they were not included in the evaluations. According to Stamps (2016), both visual and static methods provided results that were quite consistent with on-site evaluations of the present study. Silvennoinen et al. (2022) used the same scaling and, partly, the same photos, in attractiveness assessments of forests with on-site and photo evaluations as in this study (Fig. 6). The results of our study were quite like the on-site evaluations of Silvennoinen et al. (2022). Unfortunately, we could not statistically compare our results to on-site evaluations of Silvennoinen et al. (2022), because our study had different respondents. However, our non-statistical estimation based on the graphics in Fig. 6 suggest that in untreated and lightly treated forest sites, photo evaluations appear to be more consistent with on-site evaluations of Silvennoinen et al. (2022), while in gap cut sites and the clear-cut sites, video evaluations appear to be more like the on-site evaluations of Silvennoinen et al. (2022). Therefore, this comparison does not indicate which method, on average, corresponds better to on-site evaluations. On the other hand, there is also uncertainty related to on-site evaluations due to changing factors such as weather conditions, time of the day, sounds, smells, path condition, and alertness status and fatigue due to the movement of the respondent, which can have a significant impact on the evaluation (Daniel and Meitner 2001).
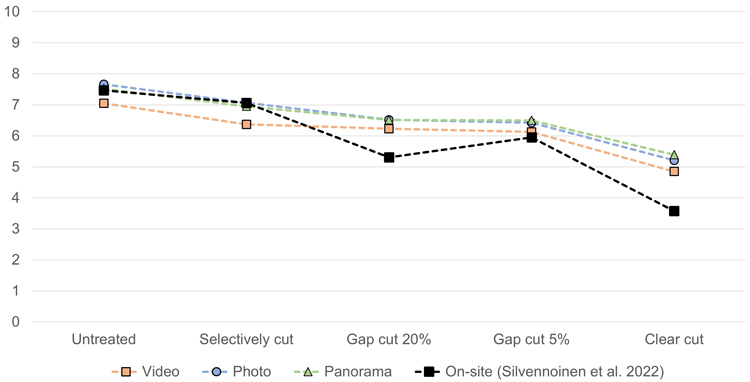
Fig. 6. Attractiveness of forest stands (y-axis) by various presentation methods (video, photo, panorama, and field assessment). Field assessment carried out in 2017 on the same forests but with a different person (Silvennoinen et al. 2022). Forest treatments presented in the Fig. 2 caption.
The respondents’ background (gender, nationality) had no impact on the differences between the visualization methods. This supports earlier observations of Silvennoinen et al. (2022), who compared results between photo and on-site assessments. However, factors related to the actual evaluation event affected the results between the visualization methods. According to our study, people’s ability to make independent evaluations from different visualisation methods varies, and people themselves were also aware of this. However, the visualisation methods had little impact on the forest in-stand evaluation if the evaluation was perceived as being easy or if there was no difference between photo and video assessments. For about half of the respondents, the evaluation was perceived as being easy and, for a similar proportion of evaluators, it was equally as easy to make an evaluation from the photos and as it was from the videos, but this should not lead to general conclusions. The evaluations were performed by forestry students who had professional knowledge related to forests. Experts look at the forest stand or landscape in a more comprehensive way than the layman, which affects the interpretation and understanding of the forest view (Dupont et al. 2015; Lien et al. 2015). Furthermore, the professional status of respondents, i.e., being either a forestry student, a forest professional, or a common forest user did not affect the results of photo and on-site assessment in the study of Silvennoinen et al. (2022). A deeper understanding of the matter would require further research with broader population-level data.
The differences between the three visualisation methods were less pronounced if the respondent paid particular attention to the undergrowth in video or photo presentation. Factors that capture or receive special attention may influence the evaluation of the entire scene (Li et al. 2020; Cottet et al. 2018). More attention was paid to the undergrowth in video presentations, which may be related to people’s tendency to concentrate on route selection when moving around in forests (Liu and Nijhuis 2020). Our result is generally in line also with existing environmental theories, especially the psycho-evolutionary theory by Ulrich (1986), which posits that topography and traversability can affect the attractiveness of the environment. However, the importance of paying special attention to trees supports the view that trees act as effective eyecatchers in the landscape (Liu and Nijhuis 2020; Shirpke et al. 2022; Zhou et al. 2022). The impact of that the heterogeneity of the view has on the perceived attractiveness of the forest cannot be properly evaluated based on our study, as the experimental sites were, in a certain way, relatively homogeneous areas: Scots pine dominated Vaccinium-type forest with a generally flat topography. A similar study should be carried out in structurally more heterogeneous areas and forests. In addition, the evaluated views in our study were mainly half-open, which reduces horizontal observation (Dupont et al. 2015). These factors may impact the similarity of results obtained for both video and photo formats.
The study data were sufficient for the evaluation of the consistency of video and photo surveys in measuring the attractiveness of forest landscapes managed with varying intensities. The number of respondents in previous studies usually varies from a few tens to just over 100 (Vining and Orland 1989; Heft and Nasar 2000; Huang 2009; Stamp 2016; Svobodova et al. 2018). The present study is not representative at the population level, as most respondents were young adults and forest professionals. However, the generalizability of the results is supported by the previous methodological comparison study in the same study site (Silvennoinen et al. 2022). Photo and on-site assessments did not differ between non- and forest professionals or different age groups (Silvennoinen et al. 2022). In addition, the results of Silvennoinen et al. (2022) and our results are relatively similar, and e.g., citizenship was not a distinguishing factor in the assessments. The evaluation of attractiveness seems to be robust and quite independent of methods and equipment used (cameras, objectives etc.). There were few years difference between the videos and the photos at the time of filming. This was considered to have a small effect on the results since in a dry pine forest (Vaccinium-type) tree variables change slowly. The quality of the photos and videos was good and of consistent quality, and the respondents also shared this view. The photo formats used in this study did not differ much from each other: the panoramic images were 49% wider than the ordinary photos.
5 Conclusions
According to our study, static and dynamic visualisation methods provide a similar understanding of the attractiveness of the environment, at least in relatively homogeneous forests such as those that we studied. The assessed visualisation methods can be used reliably and for many purposes in the professional level forest management planning for example in forestry and recreational areas. However, people’s ability to evaluate forest views varies, which makes visual presentation for research purposes challenging. Not everyone is able to carry out a consistent attractiveness assessment independently of the visualisation method, as assessing the attractiveness of the forest environment or the method itself may be challenging. In addition, people visualise things differently, which also affects the evaluations. A deeper understanding of the phenomenon would help to develop visual evaluation methods and virtual environments that mimic genuine nature. We need more information on the comprehensive experience of the environment and the suitability of different visualisation methods for the evaluation of heterogeneous forests with varying ages and species structures under varying environmental conditions. Thus, the use of different visualisation methods to determine the attractiveness of the forest environment should be further explored. However, using visualisation methods, like conventional photos and videos may be relatively laborious – weather conditions alone pose challenges for photography.
In the future, also use of virtual reality (VR) may enable the control of conditions and the environment, allowing us to explore the impact of individual landscape factors on experiences. It would be useful to examine how imaging methods, based on virtual reality, reflect the real environment, compared to the visualisation methods we used. For example, a 360° video view (utilising VR glasses) and 3D surround sound might offer more comprehensive and realistic environmental experiences than traditional imaging and vision-only methods. Virtual methods have already been used, for example, in environmental psychology to study human well-being (Nukarinen et al. 2022).
Authors’ contributions
Conception of research question (HS, HP, HN, JT), data collection (HN), data analysis (HS, HN), original draft preparation (HS), writing (HS, LP, HP, MK), text review and commentary (LT, JT, PC), project administration (HP, MK).
Declaration of openness of research materials, data, and code
Research material can be available on request to HS (anonymous personal questionnaire data).
Acknowledgements
We thank all students who took part in the assessment.
Funding
This work was supported by a project funded by the Kone Foundation [grant 088535] in 2017–2019, led by Matti Koivula (then School of Forest Sciences, University of Eastern Finland). Metsähallitus (the Finnish state-owned forest enterprise) is acknowledged for implementing the logging treatments for the study sites in 2011. This work was also supported by funding from the Academy of Finland for UNITE flagship [grant number 337127 and 357906] in 2020–2024, coordinated by the School of Forest Sciences, University of Eastern Finland.
References
Appleton J (1975) The experience of landscape. John Willey and Sons, London.
Bell S, Simpson S, Tyrväinen L, Sievänen T, Pröbsti U (2008) European forest recreation and tourism: a handbook. Taylor and Francis, London. https://doi.org/10.4324/9780203872079.
Betts G, Curthoys I (1998) Visually perceived vertical and visually perceived horizontal are not orthogonal. Vision Res 38: 1989–1999. https://doi.org/10.1016/S0042-6989(97)00401-X.
Brown T, Daniel T (1987) Context effects in perceived environmental quality assessment: scene selection and landscape quality ratings. J Environ Psychol 7: 233–250. https://doi.org/10.1016/S0272-4944(87)80032-4.
Brown T, Daniel T (1990) Scaling of ratings: concept and methods. Research Paper RM-RP-293, Department of Agriculture, Forest Service, Rocky Mountain Forest and Range Experiment Station, Fort Collins, CO, U.S. https://doi.org/10.2737/RM-RP-293.
Cottet M, Vaudor L, Tronchère H, Roux-Michollet D, Augendre M, Brault V (2018) Using gaze behavior to gain insights into the impacts of naturalness on city dwellers’ perceptions and valuation of a landscape. J Environ Psychol 60: 9–20. https://doi.org/10.1016/j.jenvp.2018.09.001.
Daniel T, Meitner M (2001) Representational validity of landscape visualizations: the effects of graphical realism on perceived scenic beauty of forest vistas. J Environ Psychol 21: 61–72. https://doi.org/10.1006/jevp.2000.0182.
Dupont L, Antrop M, Van Eetvelde V (2015) Does landscape related expertise influence the visual perception of landscape photographs? Implications for participatory landscape planning and management. Landscape Urban Plan 141: 68–77. https://doi.org/10.1016/j.landurbplan.2015.05.003.
Gibson JJ (2014) The ecological approach to visual perception: classic edition. Psychology press, New York. https://doi.org/10.4324/9781315740218.
Girden ER (1992) ANOVA: repeated measures. Sage Publications, Inc. https://doi.org/10.4135/9781412983419.
Heft H, Nasar JL (2000) Evaluating environmental scenes using dynamic versus static display. Environ Behav 32: 301–322. https://doi.org/10.1177/00139165003230.
Hetherington J, Daniel TC, Brown TC (1994) Is motion more important than it sounds? The medium of presentation in environmental perception research. J Environ Psychol 13: 283–291. https://doi.org/10.1016/S0272-4944(05)80251-8.
Higuera-Trujillo JL, Maldonado J, Millán CL (2017) Psychological and physiological human responses to simulated and real environments: a comparison between Photographs, 360° Panoramas, and Virtual Reality. Appl Ergon Volume 65: 398–409. https://doi.org/10.1016/j.apergo.2017.05.006.
Huang SC (2009) The validity of visual surrogates for representing waterscapes. Landscape Res 34: 323–335. https://doi.org/10.1080/01426390902867984.
Hull R, Stewart W (1992) Validity of photo-based scenic beauty judgements. J Environ Psychol 12: 101–114. https://doi.org/10.1016/S0272-4944(05)80063-5.
Islam MR (2018) Sample size and its role in central limit theorem (CLT). Comput Appl Math 4: 1–7. http://www.aascit.org/journal/archive2?journalId=928&paperId=6214.
Joshi A, Kale S, Chandel S, Pal DK (2015) Likert scale: explored and explained. Brit J Appl Sci Technol 7: 396–403. https://doi.org/10.9734/BJAST/2015/14975.
Kaplan R, Kaplan S (1989) The experience of nature: a psychological perspective. University Press, New York, NY and Cambridge, MA.
Kaplan S, Kaplan R, Wendt J (1972) Rated preference and complexity for natural and urban visual material. Percept Psychophys 12: 350–356. https://doi.org/10.3758/BF03207221.
Karjalainen E, Tyrväinen L (2002) Visualization in forest landscape preference research: a Finnish perspective. Landscape Urban Plan 59: 13–28. https://doi.org/10.1016/S0169-2046(01)00244-4.
Kellomäki S (1975) Forest stand preferences of recreationists. Acta Fora Fenn 146. https://doi.org/10.14214/aff.7580.
Kellomäki S, Savolainen R (1984) The scenic value of the forest landscape as assessed in the field and the laboratory. Landscape Plan 11: 97–107. https://doi.org/10.1016/0304-3924(84)90033-9.
Koivula M, Silvennoinen H, Koivula H, Tikkanen J, Tyrväinen L (2020) Continuous-cover management and attractiveness of managed Scots pine forests. Can J Forest Res 50: 819–828. https://doi.org/10.1139/cjfr-2019-0431.
Li J, Zhang Z, Fu J, Gao J, Ma J, Shao G, Noel S (2020) An evaluation of urban green space in Shanghai, China, using eye tracking. Urban For Urban Green 56, article id 126903. https://doi.org/10.1016/j.ufug.2020.126903.
Lien D, Marc A, Veerle Van Eetvelde (2015) Does landscape related expertise influence the visual perception of landscape photographs? Implications for participatory landscape planning and management. Landscape Urban Plan 141: 68–77. https://doi.org/10.1016/j.landurbplan.2015.05.003.
Liu M, Nijhuis S (2020) Mapping landscape spaces: methods for understanding spatial-visual characteristics in landscape design. Environ Impact Asses 82, article id 106376. https://doi.org/10.1016/j.eiar.2020.106376.
Meitner MJ (2004) Scenic beauty of river views in the Grand Canyon: relating perceptual judgments to locations. Landscape Urban Plan 68: 3–13. https://doi.org/10.1016/S0169-2046(03)00115-4.
Moriarty S (1996) Abduction: a theory of visual interpretation. Commun Theor 6: 167–187. https://doi.org/10.1111/j.1468-2885.1996.tb00125.x.
Nasar JL (2008) Assessing perceptions of environments for active living. Am J Prev Med 34: 357–363. https://doi.org/10.1016/j.amepre.2008.01.013.
Neuvonen M, Lankia T, Kangas K, Koivula J, Nieminen M, Sepponen AM, Store R, Tyrväinen L (2022) Luonnon virkistyskäyttö 2020. [Recreational use of nature]. Luonnonvara- ja biotalouden tutkimus 41/2022, Luonnonvarakeskus (Luke). http://urn.fi/URN:ISBN:978-952-380-429-6.
Nielsen AB, Heyman E, Richnau GS (2012) Liked, disliked and unseen forest attributes relation to modes of viewing and cognitive constructs. J Environ Manage 113: 456–466. https://doi.org/10.1016/j.jenvman.2012.10.014.
Nukarinen T, Rantala J, Korpela K, Browning M, Istance H, Surakka V, Raisamo R (2022) Measures and modalities in restorative virtual natural environments: an integrative narrative review. Comput Hum Behav 126, article id 107008. https://doi.org/10.1016/j.chb.2021.107008.
O’Brien EA (2006) A question of value: what do trees and forests mean to people in Vermont? Landsc Res 31: 257–275. https://doi:10.1080/01426390600783335.
Orians G, Heerwagen J (1992) Evolved response to landscapes. In: Barkow J, Cosmides L, Tooby J (eds) The adapted mind: evolutionary psychology and the generation of culture. Oxford University Press, pp 555–579.
Palmer JF, Hoffman RE (2001) Rating reliability and representation validity in scenic landscape assessments. Landscape Urban Plan 54: 149–161. https://doi.org/10.1016/S0169-2046(01)00133-5.
Putz FE, Sist P, Fredericksen T, Dykstra D (2008) Reduced-impact logging: challenges and opportunities. For Ecol Manage 256: 1427–1433. https://doi.org/10.1016/j.foreco.2008.03.036.
Robey R, Barcikowski R (1984) Calculating the statistical power of the univariate and the multivariate repeated measures analyses of variance for the single group case under various conditions. Educ Psychol Meas 44: 137–143. https://doi.org/10.1177/0013164484441014.
Rohrmann B, Palmer S, Bishop I (2000) Perceived quality of computer-simulated environments. In: Moore G, Hunt J, Trevillon L (eds) Environment-behaviour research on the Pacific Rim. Proceedings of PaPER98, 11th International Conference on People and Physical Environment Research, Sydney 3–6 December 1998. Faculty of Architecture, University of Sydney, pp 341–352.
Salo K (ed) (2015) Metsä: monikäyttö ja ekosysteemipalvelut. [Forest: multi-use and ecosystem services]. Luonnonvarakeskus (Luke), Helsinki. http://urn.fi/URN:ISBN:978-952-326-123-5.
Schirpke U, Tasser E, Lavdas A (2022) Potential of eye-tracking simulation software for analyzing landscape preferences. Plos One 17, article id e0273519. https://doi.org/10.1371/journal.pone.0273519.
Schüpbach P, Junge X, Lindemann-Matthies P, Walter T (2016) Seasonality, diversity and aesthetic valuation of landscape plots: an integrative approach to assess landscape quality on different scales. Land Use Policy 53: 27–35. https://doi.org/10.1016/j.landusepol.2015.01.032.
Scott M, Canter D (1997) Picture or place? A multiple sorting study of landscape. J Environ Psychol 17: 263–281. https://doi.org/10.1006/jevp.1997.0068.
Sevenant, M, Antrop M (2011) Landscape representation validity: a comparison between on-site observations and photographs with different angles of view. Landscape Res 36: 363–385. https://doi.org/10.1080/01426397.2011.564858.
Shore S (1998) The nature of photographs. The Johns Hopskins University Press, Baltimore.
Silvennoinen H, Pukkala T, Tahvanainen L (2002) Effect of cuttings on the scenic beauty of a tree stand. Scand J Forest Res 17: 263–273. https://doi.org/10.1080/028275802753742936.
Silvennoinen H, Koivula M, Tikkanen J, Tyrväinen L (2022) Consistency of photo and field surveys in measuring the attractiveness of forest stands. J Outdoor Recreat Tour 40, article id 100586. https://doi.org/10.1016/j.jort.2022.100586.
Stamps AE (1990) Use of photographs to simulate environments: a meta-analysis. Percept Motor Skill 71: 907–913. https://doi.org/10.2466/pms.1990.71.3.907.
Stamps AE (2010) Use of static and dynamic media to simulate environments: a meta-analysis. Percept Motor Skill 111: 355–64. https://doi.org/10.2466/22.24.27.PMS.111.5.355-364.
Stamps AE (2016) Simulating designed environments. In: Gifford R (ed) Research methods for environmental psychology. John Wiley and Sons, Chichester, UK, pp 197–220. https://doi.org/10.1002/9781119162124.ch11.
Surova D, Pinto-Correia T (2008) Landscape preferences in the cork oak Montado region of Alentejo, southern Portugal: searching for valuable landscape characteristics for different user groups. Landscape Res 33: 311–330. https://doi.org/10.1080/01426390802045962.
Svobodova K, Vojar J, Sklenicka P, Filova L (2018) Presentation matters: causes of differences in preferences for agricultural landscapes displayed via photographs and videos. Space Cult 21: 259–273. https://doi.org/10.1177/1206331217744186.
Tyrväinen L, Kurttila M, Sievänen T, Tuulentie S (2014) Hyvinvointia metsästä. [Well-being from the Forest]. Suomalaisen Kirjallisuuden Seura, Helsinki. ISBN 978-952-222-587-0.
Tyrväinen L, Silvennoinen H, Hallikainen V (2017) Effect of season and forest management on the visual quality of the nature-based tourism environment: a case from Finnish Lapland. Scand J Forest Res 32: 349–359. https://doi.org/10.1080/02827581.2016.1241892.
Ulrich R (1983) Aesthetic and affective response to natural environment. In: Altman I, Wohlwill JF (eds) Behavior and the Natural Environment. Human Behavior and Environment 6. Plenum Press, New York, pp 85–125. https://doi.org/10.1007/978-1-4613-3539-9_4.
Vining J, Orland B (1989) The video advantage: a comparison of two environmental representation techniques. J Environ Manage 29: 275–283.
Winkel G, Lovrić M, Muys B, Katila P, Lundhede T, Pecurul M, Pettenella D, Pipart N, Plieninger T, Prokofieva I, Parra C, Pülzl H, Roitsch D, Roux JL, Thorsen BJ, Tyrväinen L, Torralba M, Vacik H, Weiss G, Wunder S (2022) Governing Europe’s forests for multiple ecosystem services: opportunities, challenges, and policy options. Forest Policy Econ 145, article id 102849. https://doi.org/10.1016/j.forpol.2022.102849.
Zhang T, Deng SQ, Gao Y, Zhang Z, Meng H, Zhang WK (2020) Visitors’ satisfaction and evaluation to walk on the trails of forest: evidence from the national forest of Akasawa, Japan. IOP C Ser Earth Env 594, article id 012004. https://doi.org/10.1088/1755-1315/594/1/012004.
Zhou S, Gao Y, Zhang Z, Zhang W, Meng H, Zhang T (2022) Visual behaviour and cognitive preferences of users for constituent elements in forest landscape spaces. Forests 13, article id 47. https://doi.org/10.3390/f13010047.
Zube EH, Pitt DG, Evans GW (1983) A lifespan development study of landscape assessment. J Environ Psychol 3: 115–128. https://doi.org/10.1016/S0272-4944(05)80151-3.
Zube EH, Simcox DE, Charles SL (1987) Perceptual landscape simulations: history and prospect. Landsc J 6: 62–80. https://doi.org/10.3368/lj.6.1.62.
Total of 60 references.
