Erik Arvidsson  ,
Anders Rowell,
Linnea Hansson,
Håkan Lideskog,
Mikael Rönnqvist
,
Anders Rowell,
Linnea Hansson,
Håkan Lideskog,
Mikael Rönnqvist
Comparison of manual and automated coverage path planning for mechanized forest regeneration
Arvidsson E., Rowell A., Hansson L., Lideskog H., Rönnqvist M. (2026). Comparison of manual and automated coverage path planning for mechanized forest regeneration. Silva Fennica vol. 60 no. 1 article id 25018. https://doi.org/10.14214/sf.25018
Highlights
- Automated coverage path planners TerraTrail and Pathfinder outperform manual operators driving the PlantMax planting machine in coverage across all test sites
- Pathfinder demonstrated the shortest path lengths, especially in constrained environments, with up to 14% shorter paths compared to manual planning
- The study emphasizes the potential of autonomous path planning systems to reduce labor dependency, enhance sustainability, and improve the efficiency of forest regeneration operations
- The automated planners effectively accounted for vehicle constraints such as terrain and soil moisture conditions, optimizing routes for more efficient regeneration.
Abstract
In Finland and Scandinavia, even-aged forest management predominates, often including mechanical site preparation and manual planting. Growing labor shortages and increased demand for sustainability have driven interest in mechanized and autonomous planting systems. This study evaluates two automated Coverage Path Planners (CPP), Pathfinder and TerraTrail, developed to optimize planting routes for mechanized forest regeneration. Their performance is compared to the routes of the manually operated mechanized planting machine, PlantMax. Three operational sites in Sweden, representing varied terrain and hydrological conditions are evaluated. The evaluation focuses on coverage, Euclidean and Dubins path lengths. Both CPPs incorporate Digital Elevation Models (DEM), Depth-to-Water (DTW) maps and vehicle-specific kinematics to generate planting routes. Two scenarios are evaluated: one where the CPPs neglect the DTW map, and another where the CPPs are constrained to avoid DTW values below 0.3 m. Results show that automated CPPs achieve 15–19% higher coverage than manual planning on average. Pathfinder showed similar normalized path lengths in an unconstrained scenario as the manual operator, but 14% shorter in the constrained environment. TerraTrail shows 7% longer normalized path lengths in an unconstrained scenario, while the constrained scenario shows similar path lengths as the manual operator. These findings emphasize the potential of deploying automated CPP systems to enhance precision, sustainability, and labor efficiency of silvicultural operations. The CPPs support both autonomous deployment and decision support tool for operators. Further refinement, including combining both CPPs to leverage the best functions of each, along with reversible path planning, could enhance their value in forestry practices.
Keywords
site preparation;
planting;
mechanization;
automation;
precision forestry;
routing
-
Arvidsson,
Luleå University of Technology (LTU), SE-971 87 Luleå, Sweden
 https://orcid.org/0000-0001-7679-0203
E-mail
erik.arvidsson@ltu.se
https://orcid.org/0000-0001-7679-0203
E-mail
erik.arvidsson@ltu.se
-
Rowell,
Forestry Research Institute of Sweden (Skogforsk), Uppsala Science Park, SE-751 83 Uppsala, Sweden
https://orcid.org/0009-0000-2810-1434
E-mail
anders.rowell@skogforsk.se
-
Hansson,
Forestry Research Institute of Sweden (Skogforsk), Uppsala Science Park, SE-751 83 Uppsala, Sweden
https://orcid.org/0000-0002-9788-1734
E-mail
linnea.hansson@skogforsk.se
-
Lideskog,
Luleå University of Technology (LTU), SE-971 87 Luleå, Sweden
https://orcid.org/0000-0002-9862-828X
E-mail
hakan.lideskog@ltu.se
-
Rönnqvist,
Université Laval, 1065, avenue de la Médecine, Local 1504, Québec G1V 0A6, Canada
https://orcid.org/0000-0002-1940-6129
E-mail
mikael.ronnqvist@gmc.ulaval.ca
Received 16 May 2025 Accepted 20 December 2025 Published 13 January 2026
Views 20477
Available at https://doi.org/10.14214/sf.25018 | Download PDF

Supplementary Files
1 Introduction
In Finland and Scandinavia, even-aged forest management is the dominant practice, where forest stands are managed in defined sections to ensure consistent treatment throughout their lifespan (Savilaakso et al. 2021). This includes final felling (clearcutting) and, in most cases, mechanical site preparation and manual planting (Sikström et al. 2020). The growing labor shortage and increasing demand for sustainable practices have led to greater interest in mechanized and autonomous planting systems to improve silvicultural operations (Ramantswana et al. 2020; Hansson et al. 2024).
Mechanized planting has been investigated in Sweden and Finland since the early 1960s (Hallonborg et al. 1997; Ersson et al. 2018). Notable systems such as Silva Nova, Bräcke-Planter (Bracke P11) and M-planter have been in use for several decades, although they have not achieved widespread adoption (Ersson et al. 2018). This is due to various challenges, including high operational and investment costs, inconsistent performance of planting machines across varying forest site conditions, and increased difficulty in competing with manual planting since Sweden’s membership in the European Union (EU), which made hiring seasonal workers from within the EU more cost-effective (Ersson 2014; Sundblad et al. 2023).
Silva Nova, developed in the mid-1970s, was a continuously advancing planting machine mounted on a forwarder chassis. It featured disc trenchers located in front of the rear bogie, enabling it to plant two rows simultaneously. However, it has not been operational since 2002. The Swedish company Plantma AB presented an updated prototype version PlantmaX 2018, and in 2022 the commercial PlantMax was introduced (Plantma Forestry AB 2025). One of the configurations is built on the forwarder Eco Log 574E, featuring a planting cabin at the rear of the vehicle, with a total weight of approximately 25 metric tons (Fig. 1). Near the articulated joint, the machine is equipped with MidiFlex disc trenchers, and two planting tubes are mounted in the rear, which inserts the seedlings into the soil. The PlantMax requires two operators, one in the front to drive the forwarder, and another reversed in the rear, who manually feeds seedlings into the planting tubes, while simultaneously inspecting the planting quality and adjusting the machine’s settings. In optimal conditions PlantMax can plant approximately 2800 plants per hour (Sundblad et al. 2023).
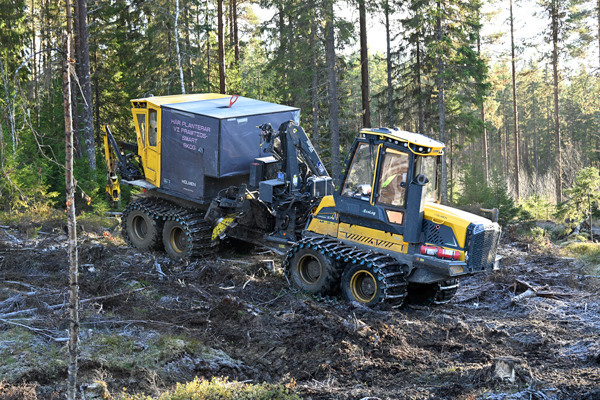
Fig. 1. PlantMax planting machine built on Eco Log 574E forwarder, equipped with a MidiFlex disc trencher. Photo Mikael Rönnqvist.
To further automate planting, projects like Autoplant (Hansson et al. 2024) are focusing on developing autonomous systems to reduce soil disturbance and improve precision in forest regeneration. The Autoplant system aims to integrate autonomous technologies for site preparation and planting, improving energy efficiency, minimizing soil disturbance, and reducing the size and environmental impact of forest machinery (Hansson et al. 2024). The system includes a decision support tool for both regeneration planning and route optimization (Hansson et al. 2025). Another initiative, led by the forest owners’ association Södra, is the BraSatt project, which utilizes an in house developed compact planting robot to research autonomous planting and soil preparation. The goal of the research is to decrease mortality and soil damage while increasing sustainability (Södra 2023). However, no results on path planning have been published to date, and therefore the BraSatt project is not compared in this study.
Path planning is crucial for autonomous systems, where a path refers to the specific route taken, while a route is the plan to reach a destination. In navigation, the terms path and route are often used interchangeably. While these systems hold great potential, their success depends on effective Coverage Path Planning (CPP). CPP is the process of finding a path that covers every point within a specified area or volume of interest, while ensuring obstacles are avoided (Galceran and Carreras 2013). Research on CPP has primarily focused on applications like robotic vacuum cleaners and agricultural vehicles (Yasutomi et al. 1988; Jin and Tang 2011; Cabreira et al. 2019). However, forestry faces additional challenges, including uneven terrain, varying soil types and wetness, as well as machines with large turning radii. Certain CPP algorithms (Jin and Tang 2011; Wu et al. 2019; Qiu et al. 2024) have started addressing some of these issues by considering terrain traversability and optimizing driving directions. However, they do not fully account for forestry-specific constraints, such as the turning characteristics of forest machines and the need to avoid non-traversable areas like steep terrain or wet soil with low bearing capacity. Traditional path planning tools used in forwarding, on the other hand, focus primarily on establishing networks or optimizing routes within pre-existing networks (Flisberg et al. 2007; Hosseini et al. 2019; Flisberg et al. 2021, 2022; Ovaskainen and Riekki 2022; Hansson et al. 2022; Holmström et al. 2023; Hosseini et al. 2023).
Although several CPP approaches relevant to forestry have been proposed in research (Jin and Tang 2011; Wu et al. 2019; Qiu et al. 2024; Hansson et al. 2025; Arvidsson et al. 2025), they have not been compared, as the field lacks a common benchmark and an associated set of key performance indicators (KPI) to enable objective evaluation.
This article aims to address these gaps by comparing two automated CPPs, TerraTrail (Arvidsson et al. 2025) and Pathfinder (Hansson et al. 2025), designed for forest regeneration, with manual real-time planning performed by a machine operator, driving the PlantMax planting machine. The comparison also compares the automated CPPs with each other. The focus is on determining whether the automated CPPs generate shorter paths with higher coverage than manual planning, which potentially can be used to assist human operators or as a global plan for autonomous forest vehicles. Such plans are a necessity for autonomous forest regeneration (Arvidsson et al. 2025; Hansson et al. 2025). Accordingly, we propose coverage, Euclidean path length, and Dubins path length as KPIs for comparative evaluation.
Both automated CPPs consider vehicle constraints such as topography and hydrology, optimizing routes based on path distance, turning penalties, and the need to avoid wet areas that could lead to vehicle immobilization or soil disturbance. The primary objective for the CPPs is to determine a route on real forest regeneration sites in Sweden, that promotes high area coverage while minimizing driving distance and adhering to the vehicle’s operational limits, thereby preventing rollovers and optimizing efficiency.
2 Materials and methods
2.1 Test sites
Three test sites with distinct characteristics were selected from sites planted by PlantMax at the forest company Holmen Skog (Fig. 2). The area, location, and associated challenges of the test sites are presented in Table 1. Test site A was chosen due to its steep terrain in the northeastern area, which has areas that exceed the slope constraints of the vehicle. Site B was selected for its characteristics, where the planting machine follows a circular driving pattern on a relatively homogeneous area. Site C was selected due to its complex shape, bottleneck area in northeastern corner, and the intricate network of no-go areas caused by wet sections, as indicated by the Depth-to-Water (DTW) map (Swedish Forest Agency 2025).
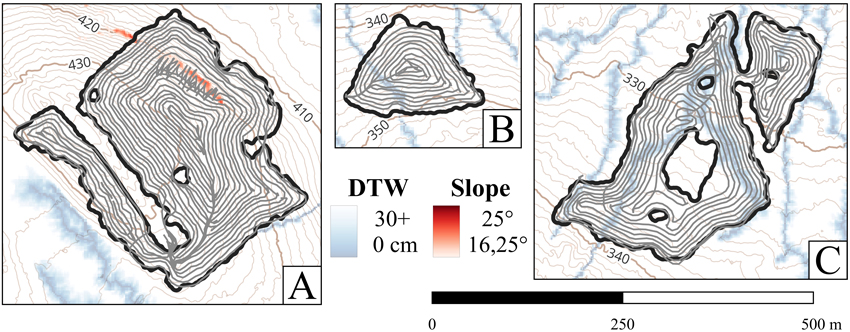
Fig. 2. The PlantMax GNSS tracks shown in gray across test sites A–C, with the Depth-to-Water map in blue and the slope magnitude map in red. The black lines represent the site borders, and the brown contours indicate elevation in meters.
| Table 1. Data of the test site’s location (in WGS 84 coordinate system), area, and characteristic challenges for the machine. The area is the net area for regeneration acquired with the PlantP module, without removing wet or steep areas. | |||
| Test site | Coordinates | Area | Characteristic |
| A | 63°54’13”N, 17°17’51”E | 6.6 ha | Slope in the north area |
| B | 63°51’49”N, 17°12’42”E | 1.5 ha | Wet area that splits the site |
| C | 63°51’38”N, 17°19’17”E | 5.0 ha | Widespread network of wet areas throughout the site |
All test sites were selected prior to running any of the path planners to prevent potential user bias from influencing the results.
The Pathfinder tool consists of two submodules: PlantP, which identifies the borders of the test sites based on harvested production (hpr) files and geodata, and PathP, which designs and optimizes the route network using a Digital Elevation Model (DEM) and machine data (Hansson et al. 2025). In this study, the PlantP module was also used to calculate the net area for regeneration for TerraTrail and the tracks of PlantMax.
The parts of the PlantP-module relevant for defining the net area for regeneration are described in Fig. 3a–f. The staging position when felling a tree from the hpr files is used to decide the net area for regeneration, including a buffer of 6 m on the outer side of each harvester staging area and 12 m on the inner side (Fig. 3b). A DTW map with a threshold of 0.30 m is used to exclude areas where the modelled groundwater is too close to the surface, preventing the vehicle from becoming immobilized by entering too wet terrain (Fig. 3c). Parent material maps displayed in Fig. 3d from the Geological Survey of Sweden (2021) are used to exclude peat soils. The no-go areas used by Holmen Skog to plan the regeneration area are also excluded (Fig. 3e). Since the machine operator did not exclude areas predicted to be too wet by the DTW model, though such exclusion should be considered, two versions of each site were analyzed: one with the wet areas kept (Fig. 3e) and one with wet areas removed (Fig. 3f). To traverse the wet sections in Fig. 3f, manually placed water crossings marked with yellow lines were used.
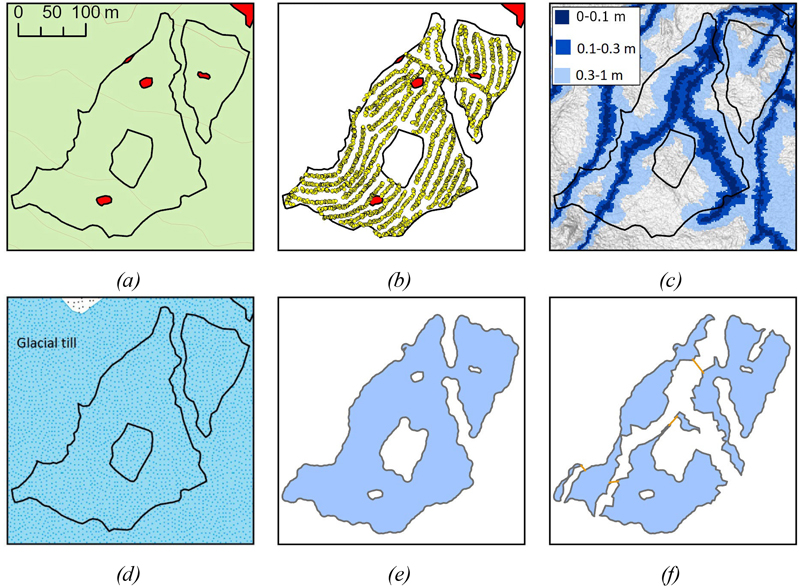
Fig. 3. Overview of the PlantP-module input (a-d) and output (e-f) used to define the net area for regeneration. a) Overview map of the test site with boarders of the planned area to harvest including No-go areas defined by Holmen Skog (red areas). b) Harvester positions when feeling a tree from harvested production (hpr) files are used to define the net regeneration area. (c) Depth-to-Water (DTW) map where a 0.3 m threshold is used to exclude areas predicted to be too wet for mechanical site preparation. (d) Parent material maps from the Swedish Geological Survey are used to exclude peat soils. (e) Net area for regeneration including wet areas f) Net area for regeneration excluding wet areas. Manually suggested passages in wet areas are marked with yellow lines. © Lantmäteriet, © The Swedish Environmental Protection Agency, © Swedish Geological Survey.
2.2 Coverage path planning tools
2.2.1 TerraTrail
The original method of TerraTrail presented in Arvidsson et al. (2025) was suitable for clearcuts of smaller size and large working widths. Working width is defined as the center-to-center distance a planting machine requires between parallel tracks to achieve full coverage. To facilitate a more general approach that accommodates larger ratios between turning radius and working width, as well as larger clearcut areas, the method was further developed.
The modified process begins by importing a polygon representing the site borders, along with the DEM and the DTW for the area. The user has the option to manually divide the original polygon into multiple sub-polygons, allowing the tool to manage areas faster by reducing the size of the problem. These sub-polygons can be generated to address common slope aspects (orientation) and magnitudes (steepness), or to divide a non-convex site into smaller sections for individual management.
Next, the tool places a square node grid at uniform spacing, equal to the planting machine’s working width of 5m, within each sub-polygon to define the coordinates the CPP must visit to ensure good coverage. The DEM cells within the critical slope magnitude are then analyzed, and their average aspect is used to align the grid accordingly. If no DEM cells within a sub-polygon have a critical slope magnitude, the grid is aligned with the dominant angle of the sub-polygon. This alignment is made to minimize the number of turns required and to arrange the grid into as long columns as possible. To calculate the dominant angle, the longest segment of the simplified sub-polygon is identified. The simplification is achieved using the Ramer-Douglas-Peucker algorithm, which reduces the number of vertices and thus simplifies the shape of the sub-polygon (Douglas and Peucker 1973; Ahmadzadeh 2025). Once simplified, the grid is oriented along the longest line segment of the resulting polygon. Nodes within half the working width of the planting machine, near the sub-polygon borders, are then removed to reduce driving distance and prevent congestion.
With a node grid defined, the next step is to determine the order in which the nodes should be visited, to minimize total path length while respecting the DTW and slope-magnitude constraints. This problem can be formulated as a Traveling Salesman Problem (TSP) (Flood 1956), whose computational complexity increases rapidly with problem size. The TSP is a well-known NP-hard combinatorial optimization problem. As a result, the computational effort required to solve it exactly grows exponentially with the number of locations. While this makes large instances challenging, specialized exact algorithms, cutting-plane methods, and advanced heuristics are able to solve fairly large instances very efficiently in practice (Applegate et al. 2001).
The tool supports applying split indexing, such as selecting every third column of the node grid, enabling the later stages of the program to solve the TSP in smaller sections. This leads to longer straighter paths and shorter calculation times, which are displayed by the different node colors in Fig. 4a. This split index is vehicle-specific and likely depends on the ratio between the turning radius and the distance between columns, which corresponds to the vehicle’s working width. In this study, the turning radius and working width are close in value, suggesting that the vehicle must skip at least every second column to achieve an efficient turn. The chosen split index was derived empirically. Selecting every third column resulted in the shortest path rather than selecting every second or fourth.
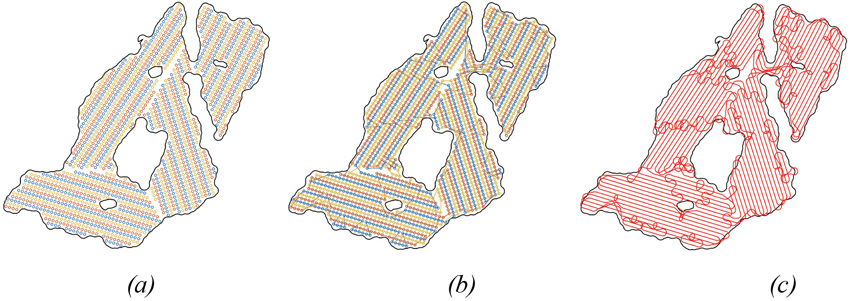
Fig. 4. (a) TerraTrail’s node grid of site C, with every third node column sharing a split index, displayed by the color of the node. (b) The Euclidean path segments created by the three different TSP calculations, defined by the split index. (c) The line segments united into one, and a Dubins path has been applied, which considers the turning radius of the vehicle.
The nodes that share a split index across all sub-polygons are processed using the Concorde TSP program with QSopt solver (Applegate et al. 2001). This process begins by calculating a distance matrix based on the two-dimensional Euclidean distance between each node. Penalties are applied to the distances between to exclude unfeasible solutions, based on the following conditions: 1) If the Euclidean line between the nodes crosses the site border, a 100 000-meter penalty is added, and 2) If the line passes through map cells where the soil is too wet or the slope exceeds vehicle constraints in the driving direction, a penalty of 1000 meters is applied. The penalty magnitude is derived empirically. If the penalty was set too low, the TSP model did not consider the constraints.
After computing the three partial TSP solutions, they are combined into a single final sequence, as illustrated in Fig. 4b. Following this, a simple Dubins path is calculated for the final sequence. A Dubins path represents the shortest route between two points, factoring in a specified turning radius and restricting the vehicle to only drive forward. This path provides a more accurate representation of the vehicle’s kinematics than Euclidean distances alone and consists of three maneuvers: a maximum left turn, a straight-line segment, or a full right turn (Dubins 1957). This is done by first calculating a simple Dubins path. To compute a Dubins path in 2D for the final sequence, four inputs are required: the coordinates x (m), y (m) of each node, the Dubins heading δi (°) for each node, and the turning radius (m) of the vehicle. The Dubins heading is the direction in which the vehicle must tangent to pass through each node while adhering to its turning radius constraints. To make an initial estimate, δi is calculated at each node i, by using the heading of the Euclidean lines between the nodes is used, as given by the following equation:
![]()
To further reduce the Dubins path length, refinement can be focused on the more complex sections of the simple Dubins path, while the simpler sections remain unchanged. This is achieved by examining sequences of four consecutive nodes along the final sequence. If the Dubins path between these nodes is more than 20% longer than the Euclidean path, the headings at the two middle nodes are adjusted in 30-degree increments to search for a shorter path, as shown by the red arrows in Fig. 5. The headings of the first and fourth nodes remain fixed during this process. The heading combination that produces the shortest Dubins path is selected, as illustrated in Fig. 5. The final Dubins path of test site C, incorporating these optimized headings, is shown in Fig. 4c.
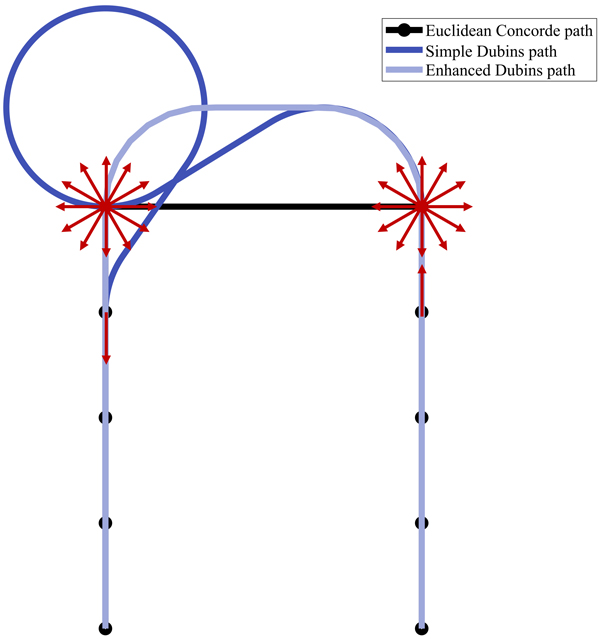
Fig. 5. The two distinct Dubins paths generated from the Euclidean Concorde TSP sequence for TerraTrail. The simpler Dubins path, which was calculated first, requires a detour at the upper-left corner to tangent the upper-left node with a straight leftward Dubins heading, as defined by Eq. 1. By calculating the Enhanced Dubins path, altering the Dubins heading of the two upper nodes marked with red arrows, resulted in a 30% shorter path, compared to the simple Dubins path. This resulted in changing the Dubins heading direction of the upper-left node to a downward orientation.
All code for TerraTrail is written in MATLAB, except for the Concorde TSP, which is executed through a shell script called from MATLAB.
2.2.2 Pathfinder
To find the most efficient routes that minimize overall driving time, the solution uses a decomposition strategy divided into four steps. The goal is to first identify key characteristics of each region, which is a smaller part of the entire area, and then build the solution by making broad strategic decisions, such as driving direction, followed by more local operational decisions, such as turning, later. Each step uses a specific model and method for solving it. A more detailed explanation can be found in Hansson et al. (2025). Below is a general overview of the four steps, using Site C from the case study as an example (Fig. 2).
Step 1. Area discretization
The overall area is first divided into hexagonal sections (Fig. 6a). The DEM is then used to calculate the principal slope aspect and magnitude for each hexagon (Fig. 6b).
Step 2. Identify regions with similar slope aspects
The overall area consists of regions with varying slope aspects and magnitudes. This step aims to identify regions where the slope is consistent throughout by merging smaller areas with similar characteristics until larger, more defined regions are formed. This process can be formulated as a set-partitioning problem (Lundgren et al. 2010), where the binary decision variables represent all possible regions composed of hexagons. Each possible region consists of a set of hexagons with similar slope characteristics. The decision is to select a possible region or not. The constraints ensure that each hexagon belongs to exactly one region selected, Hence, the result is a partitioning of the hexagons to regions with similar slope. The model is solved in two phases. The first phase determines an initial set of potential areas (Fig. 6c), by solving the set-partitioning model with a reduced number of variables. These areas are then merged into regions (Fig. 6d), using a repeated matching (RM) algorithm (Flisberg et al. 2007).
Step 3. Identify long driving lines in each region that cover the entire area
For each identified region, the goal is to determine driving paths that cover the entire area, as shown in Fig. 6d. The approach involves generating a large number of candidate lines (more than the final lines chosen for the path) and then solving a set-covering problem to select a subset of lines that covers the entire regions. The total area is divided into areas of one square meter. Each candidate line will cover a set of such squares. The objective is to select a set of lines (representing the path by the machine) with the constraint such that each area is covered at least once. The binary variables are defined as using a candidate line or not. A set-cover problem (Lundgren et al. 2010) is similar to a set-partitioning problem with the difference that equality constraints are replaced by inequality constraints.
Step 4. Identify best turnings to connect driving lines
The selected lines define the paths the vehicle must follow, but the driving direction along each line has not yet been determined. Given these lines, the next step is to identify the driving direction and the necessary turns or changes in direction to pass through each line. Essentially, the task is to combine a sequence of these lines into one continuous route, which is modeled as a TSP. To solve this, the problem is formulated as a network, where the driving lines represent nodes, and the possible turns represent arcs. A challenge arises in determining the driving direction for each line, which requires augmenting the network to enable calculating the correct turning costs. This problem is solved using the Concorde TSP program (Applegate et al. 2001). The resulting route is shown in Fig. 6e. Postprocessing involves smoothing the turns and highlighting turns where reverse driving is required, shown in pink in Fig. 6f, or indicating driving without planting, shown as a black dotted line.
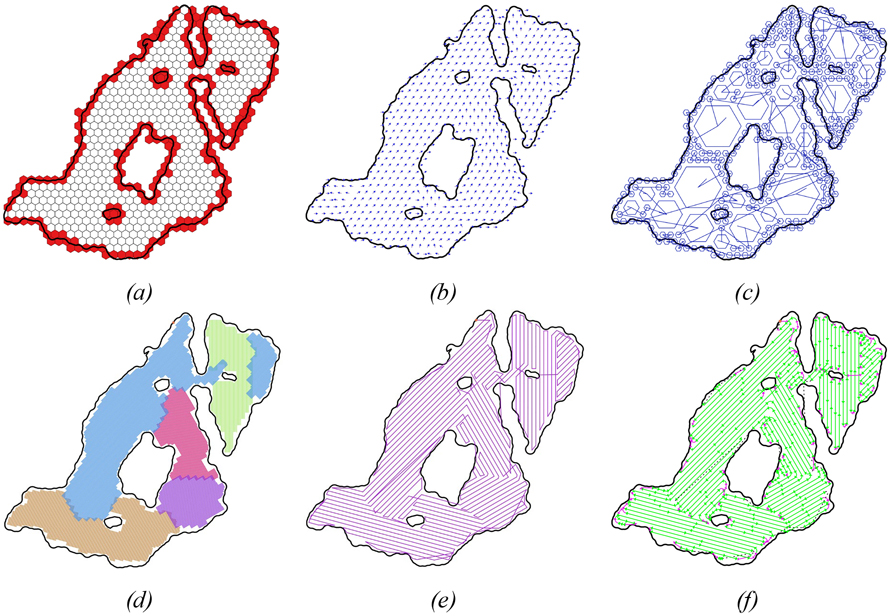
Fig. 6. Results from applying the Pathfinder solution approach to site C. (a) distribution of hexagons in the area, with red hexagons representing no-go zones, (b) initial dominating slope aspects indicated by arrows, (c) solution of mixed sized hexagons with similar slope aspects in the first phase, (d) identified regions with similar aspects in different colors, (e) TSP-solution (f) full route solution with turning and driving direction indicated. Pink indicates turns smaller than the turning radius where reversing is needed.
2.3 Comparisons and post-processing
Previous studies on CPP in terrain have employed different metrics for evaluation (Jin and Tang 2011; Wu et al. 2019; Qiu et al. 2024; Hansson et al. 2025; Arvidsson et al. 2025), all of which presented in (Table 2). Across these studies, four measured Path Length, three measured Coverage Rate, two evaluated Climb Energy, Calculation Time, and Turning Cost/Penalty. Therefore, Euclidean and Dubins length along with Coverage Rate is evaluated in this study.
| Table 2. Comparison of which key performance indicators used in five different studies of coverage path planning in terrain. | ||||||||||
| Coverage rate | Overlapping rate | Skipped area | Path length | Climb energy | Calculation time | Turns | Erosion | Time cost | Side slope | |
| Jin and Tang 2011 | x | x | x | |||||||
| Wu et al. 2019 | x | x | x | x | x | |||||
| Qiu et al. 2024 | x | x | x | x | ||||||
| Hansson et al. 2025 | x | x | x | |||||||
| Arvidsson et al. 2025 | x | x | x | |||||||
To provide a clearer comparison between the two automated CPPs, Pathfinder’s routes are converted into Dubins paths. The heading of the Dubins paths is aligned with the tangent of the solid lines (Fig. 7). Both the path length of the Dubins curve and the coverage were calculated from that path. This step was not required for TerraTrail, as it generates Dubins paths internally.
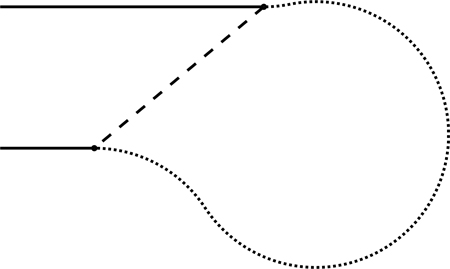
Fig. 7. The coarse dashed Euclidean connections is exchanged with Dubins paths marked with a fine dotted line, calculated with a heading which is tangent to the driving lines marked with the solid lines.
The difference between a Euclidean path and a Dubins path in a sharp turn is illustrated in Fig. 7, indicating that they cannot be directly compared, as the Dubins path is typically longer. PlantMax utilizes Euclidean path length, but since it is recorded on real planting operations using Global Navigation Satellite System (GNSS), the path kinematics are more realistic and feasible for the planting machine to follow. In contrast, the Euclidean paths of the automated CPPs may result in paths that the planting machine cannot follow directly without making significant maneuvers. However, when considering Dubins paths, these large maneuvers are accounted for. Therefore, to accurately compare the manual PlantMax Euclidean paths with the automated CPPs paths, the Dubins paths of the automated CPPs must be shorter than the Euclidean path of PlantMax to ensure that the automated CPPs have calculated a shorter path.
To determine the coverage achieved by the planning of different methods, a two-dimensional approach was applied. First, a buffer was generated by sweeping a circle, equal in diameter to the vehicle’s working width, along the line segments of the evaluated route, with the circle centered on each segment. The intersection between this buffered path and the test site polygon was then computed, to extract the area planted within the test site. Finally, the planted area was divided by the net area for regeneration of the test site. The unconstrained version includes wet areas, while the constrained version excludes it, when calculating the final coverage.
Dubins curves are primarily used to compare two automated CPPs. Pathfinder was originally developed to account for time penalties when the vehicle performs a reversed turn. However, since both TerraTrail and PlantMax measure performance based on distance, a Dubins distance was calculated for Pathfinder to enable a comparison.
The Euclidean and Dubins path types differ in their application to automated CPPs. Specifically, the Dubins path must be shorter than the PlantMax Euclidean path to ensure a reduced overall path length, as outlined in the methods section. Additionally, the results from the different path types are normalized by dividing the distances by the coverage, a process that penalizes routes with overlapping or those that miss certain areas. In this study, coverage is treated as a factor throughout all calculations (e.g., 0.9), while the percentage (e.g., 90%) is only used for display purposes. This adjustment leads to a more precise evaluation of performance.
2.4 Data
The elevation data used in this study comes from the Swedish Mapping, Cadastral, and Land Registration Authority, Lantmäteriet. It utilizes the DEM called GSD-Höjddata grid 2+, which has a spatial resolution of 2 meters and is aligned with the SWEREF99 TM projection, the primary projection used in this study. The model is developed through airborne laser scanning, and offers a vertical accuracy of 0.1 meters and a horizontal accuracy of 0.3 meters (Lantmäteriet 2022). The DTW map, which also has a spatial resolution of 2 meters and the same projection system, was provided by the Swedish Forest Agency (2025).
The parent material map from the Geological Survey of Sweden (2021) varies in quality across the country due to differing update frequencies. In southern and central Sweden, where updates are more frequent, the average error is as low as 25 meters. In northern Sweden, where updates are less frequent, the error can reach up to 200 meters. As the test sites in this study are in the north, the average error is approximately 200 meters. However, none of the test sites in this study were cropped due to peat.
The working width used in this study was extracted from the recorded GNSS track of the manual operated PlantMax. The critical slope angles represent the range between the vehicle’s maximum allowable roll and pitch angles, beyond which safe or effective operation cannot be ensured. The vehicle parameters are taken from the specifications of the PlantMax, using an Eco Log 574E forwarder platform, and are as follows:
• Turning radius: 4.7 m
• Working width: 5 m
• Max roll angle: 15°
• Max pitch angle: 20°
• Minimum Depth-to-Water: 0.3 m
The PlantMax operators were not informed in advance about the study before conducting their planting activities. As a result, the automated CPPs examined in this research are compared with manual driving data collected under typical, real-world conditions. The PlantMax is equipped with a GNSS receiver that tracks the position of the planting machine. The resolution of the recorded GNSS track across all test sites was determined, with the median distance between the following coordinates measured at 7.2 meters. Only the spatial GNSS data was available, i.e. the machine tracking was delivered as shape-files, with no temporal data provided. Hereafter the path of the PlantMax machine is mainly named manual path.
3 Results
3.1 Unconstrained
In the first scenario, where DTW constraints were bypassed (Table 3), the automated CPPs outperformed the manually operated PlantMax in coverage across all sites. Pathfinder had the lowest normalized Dubins value on test site A, outperforming the Euclidean value of the manual path (Table 4). Similarly, TerraTrail also had a lower normalized Dubins value than the manual Euclidean path (Table 4).
On test site B, TerraTrail had the highest coverage (Table 3). However, Pathfinder had the lowest normalized values of the two automated CPPs (Table 4). The normalized path length of the manual was between the Euclidean and Dubins values of Pathfinder. TerraTrail, on the other hand, had higher normalized values for both Euclidean and Dubins distances.
For test site C, Pathfinder achieved the highest coverage (Table 3). However, both TerraTrail and Pathfinder gave longer path lengths compared to manual (Table 4). When normalizing the results, the manual paths were once again between the Euclidean and Dubins values of both TerraTrail and Pathfinder. Pathfinder was able to calculate the shortest normalized Euclidean length, but the normalized Dubins values were similar for both TerraTrail and Pathfinder.
Since the GNSS track of the manual operators were recorded at around 7-meter intervals, only a Euclidean path could be derived. This limitation came from the inability to precisely identify the exact route taken by the vehicle. For example, in the steep section shown in Fig. 2a, it is unclear whether the vehicle reversed uphill or performed a three-point turn before continuing up the hill in its driving direction. As a result, only the Euclidean values are presented in Tables 3 and 4.
| Table 3. Distance and coverage of the different coverage path planners and real world PlantMax data. | |||||||||
| Test site | PlantMax | TerraTrail | Pathfinder | ||||||
| Dubins distance [m] | Euclidean distance [m] | Euclidean coverage [%] | Dubins distance [m] | Euclidean distance [m] | Dubins coverage [%] | Dubins distance [m] | Euclidean distance [m] | Dubins coverage [%] | |
| A | - | 14 945 | 85.9 | 15 930 | 14 180 | 95.5 | 14 518 | 13 413 | 96.6 |
| B | - | 2698 | 78.7 | 3837 | 3275 | 96.4 | 3554 | 2957 | 95.6 |
| C | - | 9762 | 79.8 | 12 691 | 10 839 | 94.2 | 12 844 | 10 410 | 95.7 |
| Table 4. Comparison metric derived by normalizing the results from Table 3, calculated by dividing the path length by the corresponding coverage. This metric allows for evaluating the efficiency of each path planner. Note that the coverage values for each column are based on their respective path types, meaning Euclidean and Dubins coverages differ. | ||||||
| Test site | PlantMax | TerraTrail | Pathfinder | |||
| Dubins length per coverage [m / %] | Euclidean length per coverage [m / %] | Dubins length per coverage [m / %] | Euclidean length per coverage [m / %] | Dubins length per coverage [m / %] | Euclidean length per coverage [m / %] | |
| A | - | 17 406 | 16 673 | 15 422 | 14 966 | 14 118 |
| B | - | 3428 | 3978 | 3520 | 3719 | 3166 |
| C | - | 12 232 | 13 474 | 12 120 | 13 425 | 11 143 |
The unconstrained paths shown in Fig. 8 reveal that the manual operators had the shortest Dubins path but the smallest coverage. Between the automated CPPs, TerraTrail and Pathfinder, the results were more similar, with Pathfinder achieving slightly higher coverage, while TerraTrail had a slightly shorter Dubins path length.
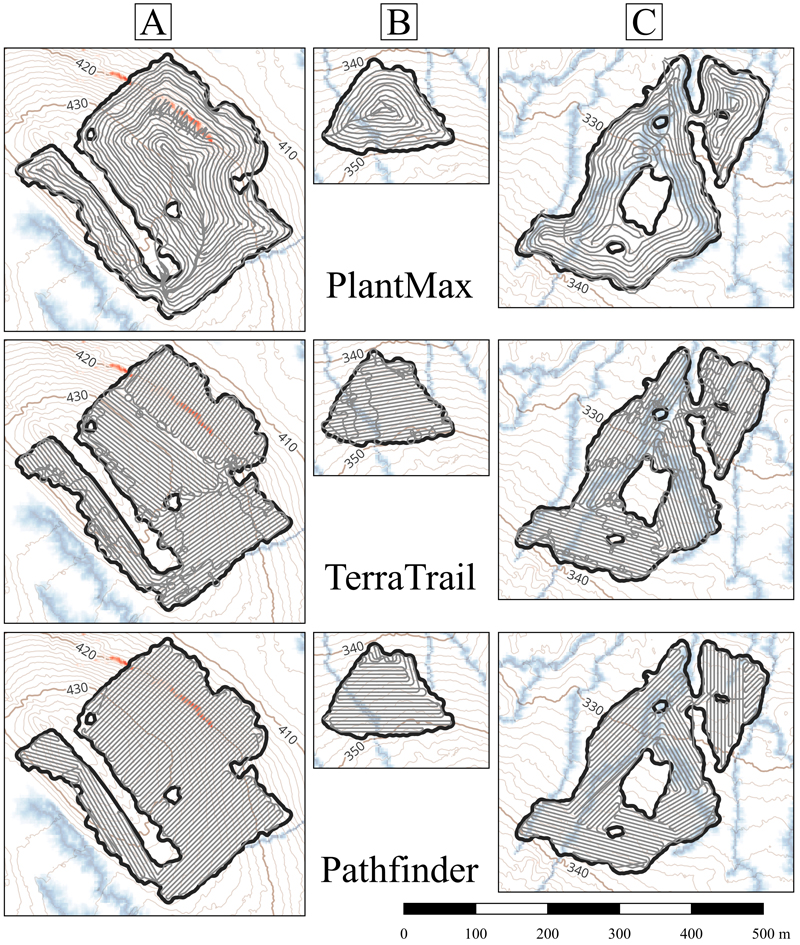
Fig. 8. GNSS track of PlantMax, along with the two automated path planners, TerraTrail and Pathfinder, on the three test sites of this study. This test scenario is unconstrained and aims to cover the entire site with the shortest path possible.
3.2 Constrained to DTW
For the second scenario, the automatic CPPs were constrained to avoid DTW values less than 0.3 meters. It is important to note that the net area for regeneration differs between the constrained and unconstrained scenarios (Fig. 3e–f). In the constrained scenario, the wet DTW areas were removed from the polygon. The two automatic coverage path planners had much better coverage than the manual paths across all test sites (Table 5). As shown when comparing Fig. 9 to Fig. 8, test site A does not contain any wet areas according to the DTW map. Test site B features a wet area that divides the site into two parts, while test site C has a more complex pattern of wet areas, which divides the site into multiple sections.
When comparing test site B, Pathfinder’s Dubins value outperforms both the manual paths and TerraTrail in terms of both normalized path lengths and coverage (Tables 5 and 6). The normalized path length for the manual operators falls between the normalized Euclidean and Dubins distances of TerraTrail.
At the complex test site C, both automated CPPs outperform the manual paths, as its normalized Dubins distance from Table 6 is lower than the Euclidean distance of the manual paths. The best-performing planner is Pathfinder, which creates the shortest path. However, TerraTrail achieves the highest coverage.
| Table 5. Distance and coverage of the different automated coverage path planners where wet areas are excluded. | |||||||||
| Test site | Plantmax | TerraTrail | Pathfinder | ||||||
| Dubins distance [m] | Euclidean distance [m] | Dubins coverage [%] | Dubins distance [m] | Euclidean distance [m] | Dubins coverage [%] | Dubins distance [m] | Euclidean distance [m] | Dubins coverage [%] | |
| A | - | 14 945 | 85.9 | 16 435 | 14 482 | 95.5 | 14 455 | 13 396 | 96.6 |
| B | - | 2698 | 78.5 | 3431 | 2987 | 93.8 | 3073 | 2637 | 96.8 |
| C | - | 9762 | 78.8 | 10 072 | 8455 | 89.1 | 8637 | 7175 | 86.1 |
| Table 6. Comparison metric derived by normalizing the results from Table 5, calculated by dividing the path length by the corresponding coverage. This metric allows for evaluating the efficiency of each path planner. Note that the coverage values for each column are based on their respective path types, meaning Euclidean and Dubins coverages differ. | ||||||
| Test site | PlantMax | TerraTrail | Pathfinder | |||
| Dubins length per coverage [m / %] | Euclidean length per coverage [m / %] | Dubins length per coverage [m / %] | Euclidean length per coverage [m / %] | Dubins length per coverage [m / %] | Euclidean length per coverage [m / %] | |
| A | - | 17 406 | 17 209 | 15 755 | 14 966 | 14 098 |
| B | - | 3435 | 3656 | 3324 | 3175 | 2774 |
| C | - | 12 380 | 11 308 | 10 083 | 10 028 | 8674 |
The constrained paths are shown in Fig. 9, where Pathfinder outperforms both the manual operators and TerraTrail. Additionally, Pathfinder demonstrates a clearer separation between the path and the wet areas compared to TerraTrail. TerraTrail also displays unnecessary circular driving patterns across the site. This issue arises because the TSP was calculated using Euclidean distances, with the Dubins path subsequently applied on top, resulting in a suboptimal pattern.
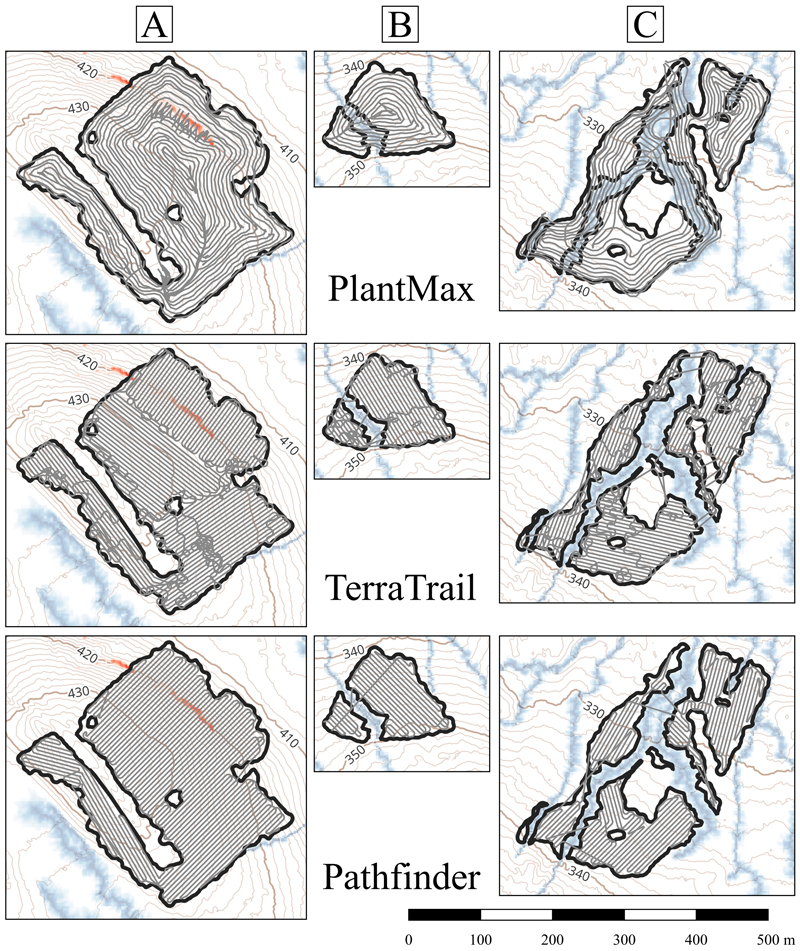
Fig. 9. GNSS track of PlantMax, along with the two automated path planners, TerraTrail and Pathfinder, on the three test sites of this study. This test scenario is constrained to the Depth-to-Water (DTW) map and aims to cover the entire site with the shortest path possible, while avoiding wet (blue) areas. Note that the Pathfinder route is only using the forcing passages in Fig. 3f, even though it looks like the passages are in various places. These lines are normally dotted to make the operator aware that it is not the exact path visualized.
The results from Tables 3–6 can then be used to compare the performance of the path planners. Table 7 highlights the differences in coverage and path lengths for TerraTrail and Pathfinder in both unconstrained and constrained scenarios. In all scenarios, both TerraTrail and Pathfinder achieved higher coverage than the manual paths, which is the key parameter on which the operators are typically paid by.
TerraTrail exhibited longer path lengths in the unconstrained scenario when comparing Dubins to the Euclidean distance of manual operators (Table 7). However, in the constrained scenario, TerraTrail generally created shorter normalized paths than the manual paths. Pathfinder showed a similar pattern to TerraTrail where the Dubins length in the unconstrained scenario was slightly longer than the manual, but in the constrained scenario, Pathfinder’s Dubins length outperformed the manual, with an average of 14% shorter normalized length. Both Pathfinder and TerraTrail’s Euclidean path lengths were shorter than the manual across both scenarios.
| Table 7. Comparison of Dubins path length per coverage between TerraTrail and Pathfinder in both unconstrained and constrained scenarios when divided by the PlantMax Euclidean metrics. The table values represent the averages across the three test sites, with each site given equal weight to ensure that the area of the test sites did not influence the results. Dubins refers to the ratio of Dubins path length per Dubins coverage, of the automated coverage path planners, and normalized by the Euclidean path length per Euclidean coverage ratio of PlantMax. Euclidean denotes the ratio of Euclidean path length per Euclidean coverage, divided by the same of PlantMax. A positive percentage for both path types indicates that the automated CPPs generates longer paths than PlantMax, and vice versa. Coverage represents the ratio of Dubins coverage of the automated CPPs divided by the Euclidean coverage of PlantMax, where the constrained scenario excluded the wet area. A positive percentage for coverage means that the automated CPPs has higher coverage than PlantMax. | ||||||
| Unconstrained | Constrained | |||||
| Dubins | Euclidean | Coverage | Dubins | Euclidean | Coverage | |
| TerraTrail | 6.8% | –3.7% | 17.8% | –1.1% | –10.4% | 14.6% |
| Pathfinder | 0.9% | –12.2% | 18.6% | –13.5% | –25.9% | 15.0% |
4 Discussion
The automated CPPs calculated a Dubins path in two dimensions, which increases the path length as it accounts for vehicle kinematics. Additionally, the Euclidean path length for the automated CPPs was also presented, which does not account for the vehicle’s kinematics. Therefore, the automated CPPs can only be considered better than manual if the Dubins path of the automated CPP outperforms the manual Euclidean path of PlantMax. This was the case in the average constrained results of Pathfinder, where it reduced the metric Dubins path length per coverage with 13.5% compared with the manual paths of PlantMax (Table 7). TerraTrail also reduced the metric, but only with 1.1% compared to the manual path of PlantMax. For the unconstrained version, Pathfinder showed a slightly longer Dubins path than the Euclidean manual path, while TerraTrail showed longer paths across most of the tests.
In general, the automated CPPs resulted in higher coverage than the manual. In Sweden, vehicle operators performing mechanical site preparation are typically paid based on the area they scarify, making coverage a crucial factor for achieving good profitability. Additionally, a low normalized path length indicates that a shorter route is needed to achieve the same coverage, potentially allowing the planting machine to complete its task more efficiently and, thereby, reduce time and energy usage and thus profit.
From the studies presented in Table 2, which measure coverage and path length, it is evident that several CPP approaches allow for reductions in both path length and climbing energy while keeping or increasing coverage.
Wu et al. (2019) employed a CPP algorithm that followed the iso-contours of the terrain, reducing energy consumption by 14% compared to a zig-zag algorithm outdoors on undulating terrain. They did not disclose the path length or coverage on that test, but on flat ground indoors, the path length was reduced by 0.9%. On a mountain scenario in a simulated environment, it was able to reduce the path length by 29%, energy consumption by 44% and increase coverage by 14%, compared to an algorithm that follows the gradient aspect (driving up and down).
Qiu et al. (2024) compared four different algorithms in both simulation and through experiments and showed that the difference with their TSA CPP algorithm achieved 8.2% reduced climbing energy, 20% lower path lengths and 3.2% higher coverage on experimental data. On the simulated and open-source data, TSA had 39% lower climbing energy, 9.9% longer path lengths, 1.6% higher coverage.
Both Wu et al. (2019) and Qiu et al. (2024) utilized small four wheeled differential drive robots, which can rotate around its own axis, resulting in a minimal turning radius. In contrast, the PlantMax planting machine weighs over 22 metric tonnes and has a 4.7 m turning radius and therefore has substantially different kinematics. As a result, the path length results are not directly comparable. Euclidean paths are shorter than Dubins paths, so a smaller turning radius will generally lead to a shorter total path length (Dubins 1957). This motivates the present work, in which we compare the CPPs proposed by Hansson et al. (2024) and Arvidsson et al. (2025) to assess their performance, both relative to each other and in relation to manual operators.
The real manual path has sparse data with around 7 m resolution, potentially missing details such as three-point turns. Moreover, the real manual path had to account for the avoidance of local obstacles such as boulders and trees, which are not considered by the automated CPPs. To find more local obstacles and incorporate them into the global plan, higher-resolution elevation models are required. To set the boundaries of the site more accurately, hpr data with greater spatial accuracy is recommended. Currently, tree positions are logged based on the harvester’s staging position when felling a tree. However, newer harvesters can be equipped with boom-tip control, which uses sensors in the crane to determine the position of trees and logs (Manner and Lundström 2025), rather than the GNSS position of the cabin. Boom-tip control thereby improves the precision of mapping site boundaries. However, a drawback emerges when a buffer (e.g., two meters) is applied around each tree position. When these buffered areas are combined to form the regeneration area, the resulting boundaries may become irregular or wavy, potentially misrepresenting the true extent of the harvested site.
The real manual PlantMax GNSS track deviated from the net area for regeneration, calculated by the PlantP module, both in terms of outer boundaries (small deviation) and by not avoiding wet areas. The latter might be due to three different reasons: 1) the areas were not as wet as predicted during the season when the operation took place as the DTW-map represent a mean value for the whole year (Ågren et al. 2014), 2) the DTW-maps were not correct due to, for example, large ditches higher up in the catchment area (Ågren et al. 2021), or 3) the areas were wet but the operator missed the constraints or decided (or was instructed) to prepare the entire area anyway. Manual operators may sometimes overlook such information, as they must account for multiple parameters simultaneously in real time. Manual operators thus serve as the benchmark in this study. Both automated CPPs rely on DEM and DTW maps. However, any soil moisture map could be used. More research is needed to increase the accuracy of the different soil moisture maps, considering for example parent material, the previous weather and time of the year.
Global path planning can result in parts of the paths deviating from reality, depending on the accuracy of the available maps. As a result, the local path planner has the task of recalculating the route when the vehicle’s onboard sensors detect unexpected obstacles (Hansson et al. 2024; Sten 2025). The more accurate the maps are initially, the fewer recalculations the local planner needs to perform for static obstacles such as boulders and trees. The local planner is also responsible for replanning when dynamic obstacles, such as animals or humans, are detected, since these cannot be mapped in advance. It is also recommended to conduct a site visit before harvest to register no-go areas, such as unregistered heritage sites and archaeological finds, unmarked obstacles, and critical crossings over water streams. An alternative is a more precise registration of conservation measures by the harvester.
A significant challenge encountered by both the automated CPPs and the manual operators, was the need to divide the test site into distinct sections where the vehicle would travel along a consistent heading. For example, the manual operators experimented with several approaches. On test site A, the operator opted to drive straight back and forth through the long narrow sections, while a circular pattern was used in the larger convex areas of the site. The circular approach was particularly evident on test site B. Pathfinder addressed the same challenge by grouping areas with similar slope aspects into large, uniform fields (Fig. 6d).
By evaluating the paths shown in Figs. 8 and 9, it is evident that both automatically generated paths share the same heading in the critical slope section as the manual operator at test site A. This heading also aligns with the aspect of the critical slope, which adheres to the vehicle’s constraints. This suggests that the path planners apply a similar level of caution to human operators when navigating areas with critical slope gradients.
Introducing additional parameters in future studies, such as climbing energy, into the feasibility function will enable to reduce energy consumption (Wu et al. 2019; Qiu et al. 2024). Following slope contours reduces soil erosion during mechanical soil preparation, since water tends to follow furrows if they are oriented along the slope aspect (Ring and Sikström 2024). This strategy also reduces energy consumption compared to following the slope aspect (Wu et al. 2019; Qiu et al. 2024). However, this introduces a trade-off, since following the contours helps reduce energy consumption and soil erosion, whereas operating with large roll angles increases the risk of rollovers. Therefore, contour-following should be limited to areas with relatively low slope magnitudes.
Of the two CPPs compared in this study, Pathfinder particularly excels in wet sites, thanks to its more advanced capabilities in using pre-defined crossings, such as portable bridges. In contrast, TerraTrail is less automated in this aspect and requires manual intervention to divide the test sites into smaller sub-polygons. TerraTrail lacks the ability to determine water crossings. Instead, the path planner attempts to minimize the distance traveled through wet areas, a strategy that proves ineffective on certain sites (Fig. 9).
The best performance of automatically generated path planners would likely come from combining the strengths of both automated CPPs. This could involve integrating Pathfinder’s discretization technique, which generates lines, with the application of Dubins curves from TerraTrail, which calculates precise paths for the vehicle. Furthermore, it would be advantageous to utilize the more exact turning cost by TerraTrail, instead of relying on Pathfinder’s discrete arc costs when calculating the TSP. This adjustment could enable the program to incorporate the vehicle’s kinematics more accurately, leading to a path calculation during the TSP step that is better tailored to the vehicle’s specific constraints.
For future development, integrating Reeds and Shepp (1990) curves could be explored, as they allow for vehicle reversal, offering a more flexible path planning solution compared to Dubins (1957) paths, which only allows forward motion. This would allow sharper turns and enhance the system’s versatility, especially in scenarios where reversing is required.
Both automated CPPs have been tested in simulated environments. Therefore, validation in real terrain is therefore the next step, as an aid to manual operations in planting, scarification, and forest fertilization where coverage is crucial. In addition, these CPPs provide a critical foundation for the future development of safe, autonomous ground-based forest vehicles (Arvidsson et al. 2025; Hansson et al. 2025).
This study focused solely on comparing the path lengths and coverage of the different methods, without evaluating the time required to traverse the proposed paths. Predicting time usage in challenging terrain is difficult, and temporal data was not collected from PlantMax. However, investigating the time required to follow the paths would be interesting for future research.
The feasibility of the automatically generated paths has not been validated in the field in this study, apart from comparing the paths with the GNSS data from PlantMax and verifying them through simulation. The simulation ensures that the paths can be safely followed without exceeding the vehicle’s constraints. This suggests that the DEM and DTW provide a reasonable representation of the real world. However, the simulation assumes the terrain is firm, so if a high slope magnitude is combined with wet and/or loose soils, the vehicle risks a rollover, even if the simulation suggests the path is acceptable.
5 Conclusions
This study advances the understanding and comparison of the capabilities of autonomous ground vehicles, to navigate rugged terrains effectively. It facilitates autonomous navigation as well as assist manual operators in following safe paths and evaluating maneuver feasibility. This is particularly beneficial for less experienced operators, making it easier to train staff. By easing the transition from manual operation to full autonomy, it allows for a smoother switch.
Overall, the two automated CPPs averaged 15–19% better coverage than the manual PlantMax operator, depending on the scenario. Pathfinder demonstrated similar performance in normalized Dubins path length to the manual Euclidean path length in the unconstrained scenario. However, when comparing the constrained scenario, Pathfinder outperformed the manual with an average of 14% shorter path lengths. TerraTrail showed a 7% higher average path length than manual in the unconstrained scenario but displayed similar path lengths to manual in the constrained scenario.
Disclosure statement
The authors report there are no competing interests to declare.
Author contributions
E.A. served as the primary author, responsible for data collection, data processing of all CPPs, tool development, and conducting the TerraTrail analysis. A.R. oversaw Pathfinder, including data collection and analysis. E.A., A.R., L.H. and M.R. wrote the manuscript. L.H. provided all maps and vehicle data. Throughout the project, L.H., H.L., and M.R. offered essential supervision, guidance, and review, ultimately approving the final version of the article.
Acknowledgements
This research was partly conducted within Trees For Me, a center of excellence supported by the Swedish Energy Agency [P2021-90272] and almost 50 stakeholders. In addition, this work was supported by AutoPlant, which was funded by the Swedish Innovation Agency, VINNOVA [2023-02747]. Finally, sincere gratitude is expressed to Holmen Skog for providing the PlantMax and hpr data.
References
Ågren AM, Lidberg W, Strömgren M, Ogilvie J, Arp PA (2014) Evaluating digital terrain indices for soil wetness mapping – a Swedish case study. Hydrol Earth Syst Sci 18: 3623–3634. https://doi.org/10.5194/hess-18-3623-2014.
Ågren AM, Larson J, Paul SS, Laudon H, Lidberg W (2021) Use of multiple LIDAR-derived digital terrain indices and machine learning for high-resolution national-scale soil moisture mapping of the Swedish forest landscape. Geoderma 404, article id 115280. https://doi.org/10.1016/j.geoderma.2021.115280.
Ahmadzadeh R (2025) Douglas-peucker algorithm. https://www.mathworks.com/matlabcentral/fileexchange/61046-douglas-peucker-algorithm.
Applegate D, Bixby R, Chvatal V, Cook W (2001) Concorde TSP solver. http://www.math.uwaterloo.ca/tsp/concorde.html.
Arvidsson E, Karlberg M, Lideskog H, Lindbäck T (2025) Global coverage path planner in 2.5 dimensions for nonholonomic vehicles. Int J For Eng 36: 201–212. https://doi.org/10.1080/14942119.2025.2469201.
Cabreira TM, Brisolara LB, Ferreira PRJr (2019) Survey on coverage path planning with unmanned aerial vehicles. Drones 3, article id 4. https://doi.org/10.3390/drones3010004.
Douglas DH, Peucker T (1973) Algorithms for the reduction of the number of points required to represent a digitized line or its caricature. Cartogr Int J Geogr Inf Geovisualization 10: 112–122. https://doi.org/10.3138/fm57-6770-u75u-7727.
Dubins LE (1957) On curves of minimal length with a constraint on average curvature, and with prescribed initial and terminal positions and tangents. Am J Math 79: 497–516. https://doi.org/10.2307/2372560.
Ersson BT (2014) Concepts for mechanized tree planting in southern Sweden. Acta Uni Agric Suec 2014:76. https://res.slu.se/id/publ/60997.
Ersson BT, Laine T, Saksa T (2018) Mechanized tree planting in Sweden and Finland: current state and key factors for future growth. Forests 9, article id 370. https://doi.org/10.3390/f9070370.
Flisberg P, Forsberg M, Rönnqvist M (2007) Optimization based planning tools for routing of forwarders at harvest areas. Can J For Res 37: 2153–2163. https://doi.org/10.1139/x07-065.
Flisberg P, Rönnqvist M, Willén E, Frisk M, Friberg G (2021) Spatial optimization of ground-based primary extraction routes using the BestWay decision support system. Can J For Res 51: 675–691. https://doi.org/10.1139/cjfr-2020-0238.
Flisberg P, Rönnqvist M, Willén E, Forsmark V, Davidsson A (2022) Optimized locations of landings in forest operations. Can J For Res 52: 59–69. https://doi.org/10.1139/cjfr-2021-0032.
Flood MM (1956) The traveling-salesman problem. Oper Res 4: 61–75. https://doi.org/10.1287/opre.4.1.61.
Galceran E, Carreras M (2013) A survey on coverage path planning for robotics. Robot Auton Syst 61: 1258–1276. https://doi.org/10.1016/j.robot.2013.09.004.
Geological Survey of Sweden (2021) Soil types 1:25 000–1:100 000 [parent material maps]. https://www.sgu.se/en/products/maps/map-viewer/jordkartvisare/soil-types-125-000-1100-000/.
Hallonborg U, von Hofsten H, Mattsson S, Thorsén Å (1997) Planteringsmaskiner i skogsbruket-en beskrivning av metoder och maskiner. [Forestry planting machines – a description of the methods and the machines]. Redogörelse 7, Skogforsk.
Hansson LJ, Forsmark V, Flisberg P, Rönnqvist M, Mörk A, Jönsson P (2022) A decision support tool for forwarding operations with sequence-dependent loading. Can J For Res 52: 1513–1526. https://doi.org/10.1139/cjfr-2022-0011.
Hansson LJ, Sten G, Rossander M, Lideskog H, Manner J, van Westendorp R, Li S, Eriksson A, Wallner A, Rönnqvist M, Flisberg P, Edlund B, Möller B, Karlberg M (2024) Autoplant – autonomous site preparation and tree planting for a sustainable bioeconomy. Forests 15, article id 263. https://doi.org/10.3390/f15020263.
Hansson LJ, Rowell A, Rönnqvist M, Flisberg P, Johansson F, Sörensen R, Rossander M, Jönsson P (2025) Pathfinder: a tool for operational planning of forest regeneration on clearcuts. J For Res 36, article id 47. https://doi.org/10.1007/s11676-025-01834-x.
Holmström E, Nikander J, Backman J, Väätäinen K, Uusitalo J, Jylhä P (2023) A multi-objective optimization strategy for timber forwarding in cut-to-length harvesting operations. Int J For Eng 34: 267–283. https://doi.org/10.1080/14942119.2022.2149003.
Hosseini A, Lindroos O, Wadbro E (2019) A holistic optimization framework for forest machine trail network design accounting for multiple objectives and machines. Can J For Res 49: 111–120. https://doi.org/10.1139/cjfr-2018-0258.
Hosseini A, Wadbro E, Do DN, Lindroos O (2023) A scenario-based metaheuristic and optimization framework for cost-effective machine-trail network design in forestry. Comput Electron Agric 212, article id 108059. https://doi.org/10.1016/j.compag.2023.108059.
Jin J, Tang L (2011) Coverage path planning on three-dimensional terrain for arable farming. J Field Robot 28: 424–440. https://doi.org/10.1002/ROB.20388.
Lantmäteriet (2022) Kvalitetsbeskrivning – nationell markhöjdmodell. [Quality description – national height model].
Lundgren J, Rönnqvist M, Värbrand P (2010) Optimization, 1st ed. Studentlitteratur, Lund. ISBN 9789144053080.
Manner J, Lundström H (2025) The effect of boom-tip control on harvester time consumption in Picea abies dominated final-felling stands: case study. Silva Fenn 59, article id 24062. https://doi.org/10.14214/sf.24062.
Ovaskainen H, Riekki K (2022) Computation of strip road networks based on harvester location data. Forests 13, article id 782. https://doi.org/10.3390/f13050782.
Plantma Forestry AB (2025) About us. https://plantmaforestry.com/about-us/. Accessed 23 April 2025.
Qiu W, Zhou D, Hui W, Kwabena AR, Xing Y, Qian Y, Quan L, Pu H, Xie YR (2024) Terrain-shape-adaptive coverage path planning with traversability analysis. J Intell Robot Syst 110, article id 41. https://doi.org/10.1007/S10846-024-02073-8.
Ramantswana M, Guerra SPS, Ersson BT (2020) Advances in the mechanization of regenerating plantation forests: a review. Curr For Rep 6: 143–158. https://doi.org/10.1007/s40725-020-00114-7.
Reeds JA, Shepp LA (1990) Optimal paths for a car that goes both forwards and backwards. Pac J Math 145: 367–393. https://doi.org/10.2140/pjm.1990.145.367.
Ring E, Sikström U (2024) Environmental impact of mechanical site preparation on mineral soils in Sweden and Finland – a review. Silva Fenn 58, article id 23056. https://doi.org/10.14214/sf.23056.
Savilaakso S, Johansson A, Häkkilä M, Uusitalo A, Sandgren T, Mönkkönen M, Puttonen P (2021) What are the effects of even-aged and uneven-aged forest management on boreal forest biodiversity in Fennoscandia and European Russia? A systematic review. Environ Evid 10, article id 1. https://doi.org/10.1186/s13750-020-00215-7.
Sikström U, Hjelm K, Holt Hanssen K, Saksa T, Wallertz K (2020) Influence of mechanical site preparation on regeneration success of planted conifers in clearcuts in Fennoscandia – a review. Silva Fenn 54, article id 10172. https://doi.org/10.14214/sf.10172.
Södra (2023) Södra utvecklar planteringsmaskin med lovande resultat. https://www.sodra.com/sv/se/press-och-media/pressmeddelanden/sodra-utvecklar-planteringsmaskin-med-lovande-resultat/.
Sten G (2025) Topographic estimation, online trajectory rollout, and experimental platforms for autonomous forest machines. TRITA-ITM-AVL 2025:15, KTH Royal Institute of Technology. https://urn.kb.se/resolve?urn=urn%3Anbn%3Ase%3Akth%3Adiva-362879.
Sundblad L-G, Hannerz M, Manner J, Ersson BT (2023) Tidigare, nuvarande och framtida planteringsmaskiner. Arbetsrapport 1149-2023, Skogforsk.
Swedish Forest Agency (2025) Nedladdning av geodata. [Download geo data]. https://www.skogsstyrelsen.se/e-tjanster-och-kartor/karttjanster/geodatatjanster/ladda-ner-geodata/. Accessed 24 April 2025.
Wu C, Dai C, Gong X, Liu Y-J, Wang J, Gu XD, Wang CCL (2019) Energy-efficient coverage path planning for general terrain surfaces. IEEE Robot Autom Lett 4: 2584–2591. https://doi.org/10.1109/LRA.2019.2899920.
Yasutomi F, Yamada M, Tsukamoto K (1988) Cleaning robot control. In: Proceedings of the IEEE International Conference on Robotics and Automation. Philadelphia, PA, pp 1839–1841. https://doi.org/10.1109/ROBOT.1988.12333.
Total of 41 references.
