
Henrik Heräjärvi  ,
Adam Taylor,
Antti Mutanen,
Miika Tolvanen,
Jouni Pykäläinen
,
Adam Taylor,
Antti Mutanen,
Miika Tolvanen,
Jouni Pykäläinen
Effects of wood products substitution on fossil carbon emissions in Finland, the European Union, and the World
Heräjärvi H., Taylor A., Mutanen A., Tolvanen M., Pykäläinen J. (2026). Effects of wood products substitution on fossil carbon emissions in Finland, the European Union, and the World. Silva Fennica vol. 60 no. 2 article id 25043. https://doi.org/10.14214/sf.25043
Highlights
- Use of forests is an important component of climate change mitigation with instant impacts
- Product and energy substitutions are the only known forest-related mechanisms substantially affecting fossil greenhouse gas emissions
- Substitution impact by wood use corresponds to the fossil emissions of Finland, while in the EU and the world it is similar to the reported LULUCF emissions.
Abstract
The main driver of climate change is fossil carbon emissions that can be avoided by using renewables instead of fossil-intensive energy or materials. A displacement factor (DF) quantifies fossil emissions avoided by wood use instead of a fossil material. Substitution impact of wood products can be calculated by multiplying their product-specific DFs and their production volumes. We quantified the substitution impact in Finland, the European Union (EU), and worldwide for 2020 using two different DF sets. We extended the analysis out to 2040 in Finland. Depending on DFs used, the avoided fossil emissions by wood use were 13–38 (Finnish wood), 149–317 (EU wood), and 971–2014 (world wood) MtCO2e in 2020. These correspond to 37–94% (Finland), 6–12% (EU), and 3–6% (world) of total fossil emissions in their respective areas, highlighting the importance of substitution impacts. Despite the uncertainties, the estimates show large climate effects. In Finland, the substitution impact approaches the scale of the total fossil emissions of the country, while at the EU and global scales, the impact is similar in scale to the entire reported LULUCF criterion. The DFs for wood use may decrease in the future because of the decarbonization of the energy systems used in the production of alternatives to wood: steel, concrete, and plastics. However, wood products will remain important in avoiding fossil emissions by providing bio-based material and energy options.
Keywords
avoided fossil emissions;
carbon handprint;
climate policies;
substitution impact
-
Heräjärvi,
University of Eastern Finland, School of Forest Sciences, P.O. Box 111, FI-80101 Joensuu, Finland
 https://orcid.org/0000-0002-7256-3887
E-mail
henrik.herajarvi@uef.fi
https://orcid.org/0000-0002-7256-3887
E-mail
henrik.herajarvi@uef.fi
- Taylor, University of Tennessee, School of Natural Resources, 203 CRC Material Sci & Tech, 2506 Jacob Drive, Knoxville, Tennessee, USA E-mail mtaylo29@utk.edu
- Mutanen, Natural Resources Institute Finland (Luke), Bioeconomy and environment, Yliopistokatu 6 B, FI-80100 Joensuu, Finland E-mail antti.mutanen@luke.fi
- Tolvanen, University of Eastern Finland, School of Forest Sciences, P.O. Box 111, FI-80101 Joensuu, Finland E-mail miika.tolvanen@primatimber.fi
- Pykäläinen, University of Eastern Finland, School of Forest Sciences, P.O. Box 111, FI-80101 Joensuu, Finland E-mail jouni.pykalainen@uef.fi
Received 4 September 2025 Accepted 12 May 2026 Published 26 May 2026
Views 17017
Available at https://doi.org/10.14214/sf.25043 | Download PDF

Supplementary Files
1 Introduction
Fossil fuels usage is responsible for approximately 75% of global greenhouse gas (GHG) emissions and approximately 90% of CO2 emissions (Friedlingstein et al. 2023). Global fossil-based emissions were approximately 36 Gt of CO2e in 2020 (Crippa et al. 2021), out of which the major CO2 sinks (oceans, soil, forests) sequester less than one third annually (IPCC 2023). According to IPCC (2023), the climate crisis calls for carbon emission reductions, and for the maintenance and increase of carbon sinks. Forests store carbon in living and dead tissues, in their breakdown products, and in the soil. Forest carbon stocks increase with the growth of biomass and afforestation, and decrease by deforestation, harvest, and disturbances, such as fire and storms. Wood products store biogenic carbon for shorter or longer time periods, depending on the product type and disposal method. This biogenic carbon sink in harvested wood products (HWP) is a component of national GHG inventory reporting (IPCC 2006).
The use of wood products can substitute for the use of other materials whose production requires more fossil fuel inputs and thus results in more fossil carbon emissions. Wood products that commonly substitute fossil emission intensive materials include sawn timber and wood-based panels used in place of steel and concrete, paper(boards) in place of plastic for packaging, and wood-based energy in place of fossil fuels (Pingoud et al. 2010). The “substitution impact” describes the avoided fossil carbon emissions resulting from the use of wood in place of more fossil-intensive alternatives.
The substitution impact can be described by product-specific displacement factors (DF), which quantify the net decrease in fossil carbon emissions when substituting one functionally equivalent unit of wood product for its alternative (Sathre and O’Connor 2010). The value of a DF is calculated as the difference in the lifecycle’s fossil-derived GHG emissions between wood and its functionally equivalent fossil intensive alternatives, relative to the difference in amount of wood used. The DFs can be expressed as mass of fossil carbon emissions avoided per mass of additional biogenic carbon in the wood option, in units of tC tC–1 (Sathre and O’Connor 2010). Hence, if a product has a positive DF, its use is associated with reduced fossil emissions (Sathre and O’Connor 2010; Leskinen et al. 2018). The greater the DF, the greater the avoided fossil carbon. The substitution impact of a specific wood product, which describes the avoided fossil carbon emissions, can be calculated by multiplying the quantity of that wood product by its per-unit DF. Changes in biogenic carbon storage in wood or its forest source use are not accounted for in the substitution impact analysis. Therefore, substitutions are a partial representation of the net climate effect of wood harvest and use.
Global wood consumption is growing, and currently amounts to close to 4 × 10⁹ m3 per year (FAOSTAT 2023). Approximately half of global wood use is for energy. Despite the importance of wood as a common energy and material option, and the generally positive DFs for wood, the substitution impacts are not accounted for in national GHG inventories (IPCC 2006), nor does the carbon market recognize the substitution impacts. Hurmekoski et al. (2023) reported avoided fossil emissions due to wood products substitution amounted to over 12 TgCO2e in Finland in 2020 while Taylor et al. (2023) reported that this effect amounted to 188 TgCO2e in the United States in 2020. Miner (2010) estimated a global substitution effect of 483 TgCO2e for 2007 by housing construction, assuming a 40% global wood products usage for housing.
A major challenge to the appreciation of wood’s substitution impacts is the uncertainty in the calculation of DFs. Wood is used for a wide range of applications, and it is difficult to determine the type and quantity of alternative materials substituted. Furthermore, the resulting net fossil emission changes may be difficult to estimate due to limited availability of the life cycle assessment (LCA) data that are used to quantify the GHG emissions associated with wood and alternative products.
While wood products generally have positive DFs ( Leskinen et al. 2018; Wedajo et al. 2025), estimates for the same products vary widely. For example, Hurmekoski et al. (2023) assumed DFs for wood products in Finland ranging from 0.96 tC tC–1 (coniferous sawn timber substituting, e.g., steel or concrete) to –0.63 tC tC–1 (dissolving pulp, substituting, e.g., synthetic fibres). In contrast, Skytt et al. (2021) used DFs ranging from 1.62 (pallets, substituting, e.g., plastic transportation packages) to 0.0 (electricity from wood fuel that substitutes fossil based electricity) tC tC–1 for wood products in Sweden, even though the types of wood products and their non-wood options are similar in Finland and Sweden.
DFs may also change in the future. Hurmekoski et al. (2020) projected a decrease of DFs for wood due to decarbonization, i.e., a shift in the energy supply to fossil free systems. Similarly, development of new products can affect the future substitution impacts of currently existing products. Despite the recognition of the importance of wood products in Climate Smart Forestry (Nabuurs et al. 2017), avoided fossil emissions due to substitution impacts are less considered in policy discussions.
Finland is a forested country with 86% of total land area classified as forestry land and ca. 20% of export income from forest products (Statistical Yearbook of Forestry 2023). The total carbon stock of Finnish forests and organic soil biomass was estimated to be 17 200 MtCO2e in 2020 (FAO 2020d). Wood and organic soil biomass in forest land stored 16.4 MtCO2e, corresponding to 34% of Finland’s 2020 emissions of 47.7 MtCO2e (Statistics Finland 2024). An additional 1.3 MtCO2e was stored in HWPs.
Forests are important considerations in global carbon dynamics. Forest’s and HWP’s physical carbon storage fluxes are currently accounted for under Land Use, Land Use Change and Forestry (LULUCF) sector in the international GHG reporting. LULUCF varies by country and region, being currently a net carbon sink in the EU but a net source at the global scale (Friedlingstein et al. 2023). A considerable research effort has been directed to the complex role of forests in climate change. In accordance with the GHG reporting requirements (IPPC 2006), the LULUCF sector components (growing stock, soil, and HWP carbon storage changes by human activities) have attracted most of the research interest. Substitution impacts, which depend on the composition and quantity of the HWPs, are less studied, and their global estimates are virtually non-existent. Criticism has also been presented regarding the shortcomings of the DF approach in general (Leskinen et al. 2018; Howard et al. 2021) or the use of DFs for certain product groups (Harmon 2019).
The aims of this article are to quantify the contribution of wood use to a reduction of fossil GHG emissions, and to compare these quantities to other commonly reported carbon data at national (Finland), regional (EU) and global scales. We use two distinctive sets of DFs to estimate the magnitude of avoided fossil emissions due to the use of wood products and wood-based energy. We also discuss historical (2000–2020) and future (2020–2040) trends and sources of uncertainty in calculating substitution impacts. We focus on avoided fossil emissions associated with the use of wood products and energy. The biogenic forest and soil carbon storage changes associated with the harvest of this wood are beyond the scope of this article.
2 Materials and methods
The analysis was carried out at three geographic scales:
1) National: Finland. A forested country and a major producer of forest industry products that regularly reports statistical data on forests and wood production volumes. Industrial by-products, which are omitted from FAOSTAT wood fuel figures, account for a substantial part of Finland’s wood energy. Finland therefore offers an opportunity to quantify the variance in avoided fossil emissions resulting from the use of international statistics versus detailed national-level data.
2) Regional: The European Union. A major producer and consumer of wood products with a target of carbon neutrality by 2050.
3) Global. The world’s forests are an important component of the global strategy for climate change mitigation, but also a vital source of energy and products.
2.1 Finland
Maanavilja et al. (2021) published national wood use scenarios for Finland with an objective to analyze how Finland can achieve its national and EU climate and energy targets in 2030, 2035, 2040, and 2050. We established our analysis on Maanavilja et al. (2021) and the predicted forest harvest levels presented therein.
Annual production volumes of Finnish forest industry products and wood-based energy (Maanavilja et al. 2021; Supplementary file S1) were based on demand scenarios and information about the planned capacity changes, which in turn determined the annual need for wood. Maanavilja et al. (2021) used an annual harvest volume of 71 × 106 m3 for 2016–2025 (real average harvest for 2016–2023: 73,4 × 10⁶ m3 a–1, Statistical Yearbook of Forestry 2023) and increased it up to 82 × 106 m3 by the period 2036–2045. To illustrate the impact of even larger levels of production variation on future substitution impact, we included an option for greater-than-predicted production volumes over time, resulting in +20% higher wood use in 2040 (ca. 98 × 106 m3) compared to Maanavilja et al. (2021), a level that is close to the annual growth of Finnish forests. Furthermore, we included an option of below-prediction production volumes – a –20% by 2040 (ca. 68 × 106 m3) compared to Maanavilja et al. (2021) – which is close to the average annual roundwood harvest in Finland during the 2000s. The analysis years used by Maanavilja et al. (2021) and, subsequently, in this article, were 2020, 2025, 2030, 2035, and 2040.
For the avoided fossil emissions calculation (i.e., substitution impact), we converted the annual production volumes into units of mass of carbon content, assuming average dry densities of 500 kg m–3 for wood products and 900 kg t–1 for pulp and paper (i.e., 10% moisture content; Table 1). We assumed wood to be 50% elemental carbon by dry mass (Sedjo 1989), and converted elemental carbon into carbon dioxide by multiplying by 44/12, the ratio of the molar masses of CO2 and C. Thus, wood with 500 kg m–3 dry mass contains 250 kg of elemental carbon, and equates to 916.7 kg of CO2.
No consistent and complete sets of DFs exist in literature for the EU or the world. We applied DFs for wider geographical areas by choosing two distinctive, national sets of DFs for our analysis. The DF sets used were “Low” from Hurmekoski et al. for Finland (2023) and “High” from Skytt et al. (2021) for Sweden. These DF sets are recently reported, specific to same Nordic region, and cover the major products: solid wood materials, pulp and paper, and wood for energy. Despite the criticism presented against Skytt et al. (2021) by Gustavsson et al. (2022), we assessed these DF sets as applicable for our analysis. We adapted these DFs to provide consistency among the product categories reported in the production volume data (Table 1); this involved some cases of calculating DFs based on relative proportions of categories reported differently in various references. We allocated pulp production to that portion used in packaging paper based on the reported portion of packaging paper production relative to total paper production.
We allocated the forest industry production volumes into five categories: energy, pulp/paper, paperboards, sawn timber, and wood-based panels (Table 1). The production projections of those up to 2040, according to Maanavilja et al. (2021), are presented in Suppl. file S1. For wood-based market energy, we used data on forest chips and fuelwood production by Maanavilja et al. (2021). We derived the use of forest industry by-products in heating and power plants from the production volumes of sawn timber, wood-based panels, and wood pulp (Luke 2024a, 2024b, 2024c). According to Finnish energy and forest industry statistics, the use of by-products in heating and power plants are correlated with forest industries’ production volumes, thus, we assumed proportional volumes of by-products available to energy production outside the forest industry.
A portion of wood-based energy substitutes fossil energy, while part of it substitutes other renewable energy sources, and part is used by the forest industries themselves. In the case of wood energy, DFs apply only to the “market energy share”, while the use of wood energy within the forest industries is accounted for in the wood product DFs. We estimated the amount of market energy based on the volume of forest chips and forest industry by-products (bark, sawdust, and chips) used in heating and power plants and fuelwood used in small-scale housing. According to Finland’s submission to UNECE’s Joint Wood Energy Enquiry (JWEE, https://unece.org/forests/joint-wood-energy-enquiry) practically all the forest chips, 40% of the bark, and 70% of the sawdust and industrial chips were used to produce market energy in 2021. We used these shares in our estimate of wood-based market energy. While black liquor accounts for ca. 40% of the production of wood-based energy in Finland (Statistical Yearbook of Forestry 2023), it is largely consumed within the forest industries, thus we omitted black liquor from the substitution impact estimates for wood-based energy. We also excluded the relatively small volumes of wooden pellets, briquettes, and recycled wood used in the heating and power plants.
End-of-life substitution could contribute positively to the avoided fossil emissions in energy production (Gustavsson and Sathre 2006; Hurmekoski et al. 2023); however, we excluded them from our analysis because of the uncertainty of future uses of wood materials after their disposal (e.g., to what extent do the cascade uses substitute virgin wood or more fossil intensive materials).
We calculated the avoided fossil CO2 emissions from wood use by multiplying the product specific production volumes (Suppl. file S1) by the product specific DFs (Table 1). We either held the product category DFs constant over time (constant displacement) or decreased them linearly over time between the 2020 and 2040 values (decarbonization displacement), following the reduction pace suggested by Hurmekoski et al. (2023), i.e., a DF reduction of 65% by 2050.
2.2 EU and world
We collected production volumes for 2020 for wood product categories following the item codes of FAO (2022a) for the EU and the world from the FAOSTAT database (2024) (Table 1 for the item codes (FAO 2022a). We also took data for Finland from the same source and the same criteria, to provide a comparison with the data of Maanavilja et al. (2021). The FAOSTAT figures for energy are based on “wood fuel” (item code 1864), which includes harvesting of roundwood for fuel in cooking, heating, and power production. Thus, it excludes forest industry by-products used in energy production both within and outside forest industries. FAOSTAT’s wood fuel figure for Finland in 2020 corresponds with the official Finnish statistics’ volume of harvested stemwood for energy production without bark.
We applied the same two sets of DFs (“Low” and “High”) that were used for Finland to calculate the 2020 avoided fossil emissions for the EU and the world. These DF sets are within the range of the values published in the literature for wood products of all types (Sathre and O’Connor 2010; Leskinen et al. 2018), enable a consistent comparison with the Finland analysis, and serve as an illustration of the sensitivity of total substitution impact to DF assumption. Based on uncertainties related to future estimates of wood use in different countries, and complexity of subsequent substitution impacts in the EU and the world, we limited the future analysis in Finland. To illustrate the results in relation to population size, we calculated the avoided fossil emissions by wood use per capita for the three geographic regions in 2020.
After calculating the total substitution impacts for each region in 2020, we calculated a (low and high) “substitution intensity of harvest”: tCO2e avoided fossil carbon emissions m–3 harvest. We used the low and high DF options’ total substitution impacts, and FAOSTAT data on total harvest volumes (item codes 1627, 1628, 1601.1602,1603,1604,1623 and 1626). Using the low and high values of substitution intensity of harvest, we then calculated the (low and high 2020 level DFs) cumulative substitution impact of harvests in each region from 2000–2020 by applying the 2020 substitution intensity values to harvest volume data over that time range.
| Table 1. Calculation of displacement factors (DF). The total substitution impact reported by Hurmekoski et al. (2023) for Finland in 2020 was distributed among the product categories used in Maanavilja et al. (2021). The production values in those categories (Maanavilja et al. 2021) for 2020 were used to calculate the DFs. “Decarbonized” DFs (DDF) were calculated by assuming a 2.17% annual average rate of decrease (Hurmekoski et al. 2023). A carbon content assumption of 50% from dry fiber content was used for all categories. | |||||||||||
| Product categories for the analysis | Displacement factors (DF) for this analysis (tC tC–1) | ||||||||||
| Low (Hurmekoski et al. 2023) | High (Skytt et al. 2021) | ||||||||||
| Product category | FAO Item code | Unit | Dry fiber content | Product categories in original reference | 2020 DF | DDF in 2025 | DDF in 2030 | DDF in 2035 | DDF in 2040 | Product categories in original reference | 2020 DF |
| Energy | 1864 (all geographic levels) | m3 × 106 | 500 kg m–3 | Energywood, solid residues | 0.21 | 0.18 | 0.15 | 0.12 | 0.10 | Energy | 0.35 |
| Forest chips, forest industry byproducts and fuelwood (Finland only, according to Maanavilja et al. (2021) | |||||||||||
| Pulp used for packaging | 1875 Allocated by proportion of all paper (1876) and dissolving pulp (1667) that is used for packaging paper (2043) | t × 106 | 900 kg t–1 | 20% of Chemical pulp, 25% of mechanical pulp | 0.09 | 0.08 | 0.07 | 0.07 | 0.06 | Packaging paper | 1.5 |
| Pulp not used for packaging | t × 106 | 900 kg t–1 | All pulp and paper categories (including dissolving pulp and pulp waste), less fraction to paperboard | 0.03 | 0.03 | 0.03 | 0.03 | 0.02 | Pulp and paper, other than packaging paper | 0.5 | |
| Sawn timber | 1872 | m3 × 106 | 500 kg m–3 | Coniferous and non-coniferous sawn timber | 0.96 | 0.86 | 0.76 | 0.65 | 0.55 | Sawn products, other than glued laminated timber | 1.43 |
| Wood-based panels | 1873 | m3 × 106 | 500 kg m–3 | Plywood, OSB, particle board, fiberboards | 0.49 | 0.43 | 0.38 | 0.33 | 0.28 | Glued laminated timber | 1.27 |
3 Results
Applying the High DFs resulted in 2.5 times higher avoided fossil emissions due to wood use than applying the Low DFs in Finland (Fig. 1). From the wood-based product groups, sawn timber was the largest contributor to the avoided fossil emissions independently of DFs used. Depending on the DF set used, the total avoided fossil emissions by wood use in 2020 were ca. 15–38 MtCO2e (Finland production), 149–317 MtCO2e (EU production), and 971–2014 MtCO2e (world production) (Table 2). Finland’s rate of avoided emissions per capita due to wood use is approximately 10 times that of the EU average and 20 times the world average.
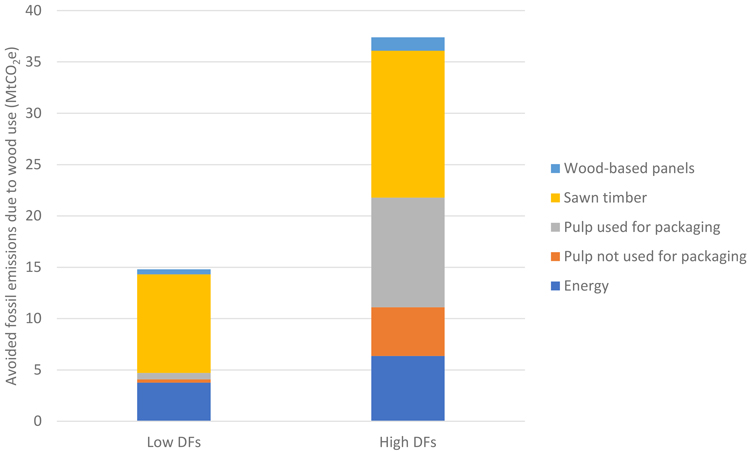
Fig. 1. Contribution of each product category to the total avoided annual fossil carbon emissions by Finnish wood products and energy in 2020, comparing different displacement factor (DF) assumptions (for components included in categories, see Table 1).
The initial choice of which DF set to use (Low vs High; Table 1) dominated other sources of uncertainty (harvest/production volume changes, decarbonization) in projections of wood’s substitution impacts in Finland (Fig. 2).
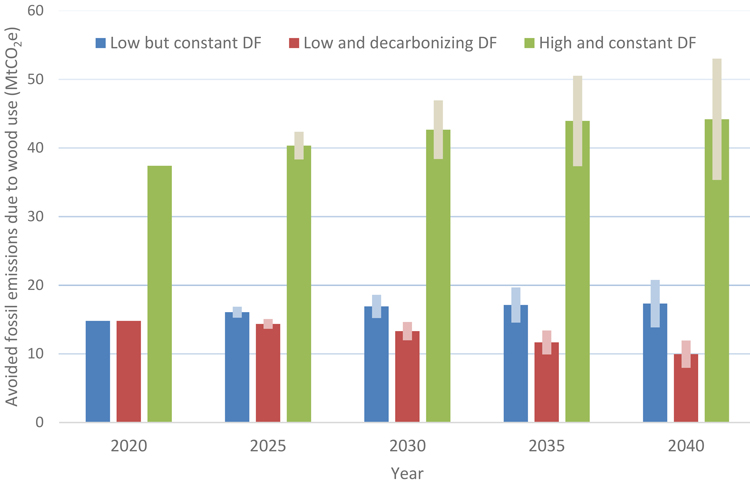
Fig. 2. Total substitution impact (avoided fossil carbon emissions due to wood use) of Finnish wood products with varying future production levels (error bars: low end referring to –20% harvest volume, high end referring to +20% harvest volume compared to Maanavilja et al. (2021)), using three displacement factor (DF) sets: Low (Hurmekoski et al. 2023) with and without decarbonization, and High (Skytt et al. (2021), (Table 1).
For Finland, the FAOSTAT wood fuel figures underestimate the use of wood in energy production by half, causing approximately a 10% underestimate in the total avoided fossil emissions in the country (Table 2). Similar estimates cannot be made for the EU and the world due to lack of data.
The avoided fossil emissions by wood use exceeded (Finland) or were within the range (EU) of the region’s LULUCF carbon sinks for 2020. Worldwide, the LULUCF sector was a 2–4 times greater carbon source than the avoided fossil emissions by wood use.
| Table 2. Avoided fossil emissions due to wood use in Finland, the European Union (EU), and the world in 2020, estimated using Low or High displacement factor (DF) sets, and total reported LULUCF and fossil emissions data. | |||||||
| Region Population 2020 (databank.worldbank.org) | Finland 5 529 543 | EU 446 870 959 | World 7 854 748 424 | ||||
| Avoided fossil emissions from wood use calculated for 2020 | DF set* | Low | High | Low | High | Low | High |
| Wood product type | |||||||
| Energy (MtCO2e) | 1.7 (3.8)** | 2.9 (6.4)** | 22.8 | 38.5 | 367.1 | 619.8 | |
| Pulp for packaging (MtCO2e) | 0.6 | 11.2 | 3.1 | 53.6 | 16.5 | 285.2 | |
| Pulp not used for packaging (MtCO2e) | 0.3 | 5.0 | 0.9 | 13.0 | 4.1 | 60.2 | |
| Sawn timber (MtCO2e) | 9.7 | 14.4 | 96.8 | 144.3 | 422.6 | 629.8 | |
| Wood-based panels (MtCO2e) | 0.5 | 1.3 | 25.8 | 67.6 | 160.4 | 419.5 | |
| Total | 12.9 (14.9)** | 34.7 (38.2)** | 149 | 317 | 971 | 2014 | |
| Per capita (tCO2e) | 2.33 (2.69) | 6.28 (6.91) | 0.33 | 0.71 | 0.12 | 0.26 | |
| Other sinks or sources reported for 2020 | Land use, land use change, and forestry (LULUCF) (MtCO2e) | 9.1*** | 241*** | 4301**** | |||
| Total fossil emissions (MtCO2e)***** | 40.7 | 2622 | 35 963 | ||||
| * Displacement factors adapted from Hurmekoski et al. (2023; “Low”) and Skytt et al. (2021; “High”) (Table 1). ** (Values in parentheses) include forestry and wood industry processing residues used for energy. Such values are not available for the EU and world. See Table 1. *** Eurostat (2024) **** Calculation based on data from Friedlingstein et al. (2023) ***** Crippa et al. (2021) | |||||||
Over 1 × 10⁹ m3 of roundwood was harvested and processed into products and energy in Finland between 2000 and 2020. Based on our conservative estimate, this production provided a cumulative substitution impact ranging from 250–675 MtCO2e (Table 3). Depending on the DF set used, the cumulative substitution impacts of harvests between years 2000–2020 for the EU range from approximately 3000 to 6000 MtCO2e, while the world figures range from 20 000 to 41 000 MtCO2e.
| Table 3. Cumulative substitution impact of wood harvested (i.e., fossil carbon emissions avoided) from 2000–2020 calculated using Low (Hurmekoski et al. 2023) and High (Skytt et al. 2021) displacement factor (DF) sets for wood products in Finland, the European Union (EU), and the world. | |||||
| Substitution intensity of harvest in 2020 (tCO2 m–3) | Cumulative harvest 2000–2020 (m3) | Cumulative substitution impact (MtCO2e) 2000–2020 | |||
| Low DF’s | High DF’s | Low DF’s | High DF’s | ||
| Finland | 0.21 | 0.58 | 1.17 × 10⁹ | 250 | 675 |
| EU | 0.31 | 0.65 | 9.41 × 10⁹ | 2900 | 6151 |
| World | 0.26 | 0.54 | 7.66 × 10¹⁰ | 19 828 | 41 149 |
4 Discussion
4.1 Magnitudes
While the LULUCF sector GHG reporting concentrates on biogenic CO2 balance, there are forest-related mechanisms that also cause fossil emissions. One is the use of fossil fuels in harvesting and transportation operations, which has a potential to diminish in future due to, e.g., machine electrification or improved operations planning (Kärhä et al. 2023). Another one is wood’s substitution impacts. Quantification of the substitutions allows assessing their relevance in relation to climate policies. While the avoided fossil emissions by wood use have, by definition, a non-existing nature, their historical and future development affects the current and future atmospheric fossil CO2 concentration.
Our lowest estimates of avoided fossil emissions due to wood products produced in Finland in 2020 (12.9 MtCO2e) are in line with the temporally contiguous estimates by Alarotu et al. (2020): 16 MtCO2e, and Hurmekoski et al. (2023): 12.5 MtCO2e. Thus, the substitution impact of current wood use exceeds the maximum estimated sum (11.35 MtCO2e) of all Finnish land use sectors’ proposed additional GHG sink potential actions (Lehtonen et al. 2021). If realized, the actions (e.g., afforestation, agricultural field management, mineral soil and wetland forest management, avoided forest loss, fertilization, seedling stand management) presented by Lehtonen et al. (2021) would require additional operations on 335 000–1 286 000 hectares, which corresponds to 1.5–5% of the productive forest land in Finland, and ranges above the average annual harvest area (Statistical Yearbook of Forestry 2023).
Depending on the DFs used, the total avoided fossil emissions by wood use in 2020 correspond with 37–94% (Finland), 6–12% (EU), and 3–6% (world) of respective region’s fossil emissions in 2020, reported by Crippa et al. (2021). Our annual estimates for substitution impacts at the global scale (1–2 GtCO2e; Table 2) are of similar magnitude to the estimates by Peng et al. (2023) (0.8–0.9 GtCO2e) for the period of 2010–2050.
Our analysis focuses solely on avoided fossil emissions by wood use. Therefore, forest or soil carbon stock changes due to harvests, as well as natural biophysical or biogeochemical processes contributing to carbon balance of the biosphere, were not included in this work. Wood harvest reduces forest (biogenic) carbon stock and decreases its increment speed by reducing living biomass. Furthermore, harvest accelerates the release of carbon due to the breakdown of harvesting residues and soil disturbance (Soimakallio et al. 2016). Thus, assuming no disturbance, forest’s carbon storage may be most rapidly increased by reducing or ceasing harvests in a particular region (Pukkala 2018; Seppälä et al. 2019). In practice, however, the net carbon benefits obtained by reduced harvests are temporary, since forests ultimately have a limited capacity to store carbon due to the growth dynamics of trees. Furthermore, the potential climate benefits of reduced harvests have several uncertainties. Firstly, in the longer term, the increased risk of associated biotic or abiotic damages may jeopardize not only the marginal carbon storage increment (= sink) but also the huge storage itself (Roebroek et al. 2023). Secondly, assuming constant or increasing global product demand, reduced harvest and subsequent increment of LULUCF sink in one nation mostly represents a geographical sink relocation rather than real climate effect (Kallio et al. 2018; Lundmark 2025). Thirdly, harvest enables increasing the HWP carbon stock which, unlike forest carbon stock, is technically controllable against risks and theoretically unlimited in size. Finally – and the focus of this paper – harvests contribute to smaller fossil carbon emissions through significant product and energy substitutions. The size of substitution impact relative to LULUCF sector supports our contention that this substitution impact should be considered in conversations on the role of forests in climate change discourse.
Substitution is important, more so for forest and forest industry centers like Finland, but also for large wood consumers such as the EU. At the global scale, the wood substitution effect is important relative to biogenic (land-use) carbon dynamics, although both remain relatively small compared with global fossil carbon emissions.
Regarding the substitution mechanisms, this study does not consider to what extent the human consumption and subsequent fossil emissions differ between optional histories or futures with different raw material palettes. One can speculate whether the overall human consumption and subsequent fossil emissions would be smaller with fewer wood products on the market, or vice versa. In Finland and the EU, the per capita avoided fossil emissions by wood use in 2020 clearly exceeded those of the world (Table 2). Interestingly, the overall per capita CO2 emission in the world (4.73 t) was just marginally smaller than that in EU (5.39 t) or Finland (5.3 t) (CO2 emissions per capita 2024). This suggests that considerable fossil emission avoidance by wood use is possible without an excessive overall emission increase.
4.2 Uncertainty of substitution impacts
In terms of the future estimates of wood’s substitution impacts in Finland, the level of DFs applied in calculation exceeds by at least tenfold the other sources of uncertainty, such as harvest volume changes or decarbonization development (Fig. 2).
In our “low” DF set the DF for pulp and paper was very low due to negative DF for dissolving pulp. Dissolving pulp is a chemically processed pulp, which is dissolved in subsequent manufacturing processes to produce regenerated fibers and films. Pulping and regeneration often take place in different countries, and similar products can be made from petrochemical sources. Dissolving pulp’s negative DF indicates that the wooden option resulted in more fossil emissions than the petrochemical-based option, because of the fossil energy-intensive infrastructure associated with regeneration. Dissolving pulp may be assigned a positive DF if the regeneration process or country is changed (Shen et al. 2010). Finnish production of dissolving pulp ended in 2021 (SCMP 2021), which would turn the Finnish pulp and paper DFs positive. This is a good example of DF’s sensitivity to relatively small changes in product portfolio.
In the case of the “high” DF set (Skytt et al. 2021), criticism by Gustavsson et al. (2022) states that the DFs are still too low, specifically with respect to energy. Bearing that in mind, the uncertainty estimate in our article is likely conservative.
A projection of an increase in harvest volume in Finland results in an increase in substitution impact, but DF differences remain a dominant factor. The scenario of a 20% increase in harvest volume and corresponding changes in forest products’ volumes did not offset the reduction in substitution impact that would be caused by the projected decarbonization of the DFs for wood products. Even the minimum substitution impact scenario we present is large: assuming a low and decarbonizing set of DFs and a 20% reduction in the harvest volume, 7.3 MtCO2 eq of avoided fossil emissions would occur in 2040 because of wood use in Finland.
The DFs applied in this article, “Low” (Hurmekoski et al. 2023) and “High” (Skytt et al. 2021) are based on Finnish and Swedish references, respectively. Despite the seemingly similar forest industry structure and technical-economic circumstances between Finland and Sweden, the two DF sets differ from each other substantially. Recognizing the even greater uncertainties in the EU and global scale analyses, our results highlight the effect of DFs on estimates of avoided emissions, also pointed out by Wedajo et al. (2025) and, on the other hand, the great volume of avoided fossil emissions regardless of the DFs used. Once enabled by data availability, it will be possible to make country-specific DFs and more accurate substitution impact estimates for larger geographic area.
Potential end-of-life substitution impacts were not considered here either for wood or its alternatives. However, they would likely further increase the substitution impacts, if using wood repeatedly results in avoiding the use of other materials or if the wood is used for energy at the end of its lifecycle. Hurmekoski et al. (2023) calculated that such impacts increased the total substitution for Finland by 42%. The current forest and HWP storage accounting, which neglects substitution impacts, not only fails to recognize the potential importance of wood reuse and recycling but also leads to the odd situation where disposal of wood in landfills is credited as a large increase in carbon stocks (65 MtCO2e in the USA in 2020; Domke et al. 2023). Such wood “waste” could also be treated as a biofuel that decreases the energy sector’s dependency on fossil fuels and, thus, provides substitution benefits.
Including the forest residues and industry by-products used for producing market energy more than doubled the Finnish wood energy’s substitution impact compared to accounting based only on FAOSTAT’s fuelwood category (Table 2). Finland produces more than 50% of its total wood-based energy from forest industry by-products (Finnish Statistical Yearbook of Forestry 2023), but this remains unaccounted in FAOSTAT fuelwood data. Based on the forest industry structure and Finland’s high efficiency biomass utilization, we estimate that this percentage is higher in Finland than in the EU and the world. Still, we assume that the EU and world substitution impacts for wood energy and, accordingly, total avoided emissions presented in Table 2 are underestimates.
Printing papers have a declining global demand. Simultaneously, packaging papers and paperboards (FAO 2022b) have a stable or increasing demand. Pulp and its resultant paper and paperboard products are an important component of Finland’s forest industry production and strongly affect the substitution impact estimates. Paperboard covered 31% of the total pulp market in Finland in 2020, and the share is expected to increase up to 35% under the projection by Maanavilja et al. (2021). In the United States, the share of pulp going to packaging has reached 70% (Taylor et al. 2023). A similar shift in Finland would almost counteract the reduction in substitution impact due to projected decarbonization (data not shown).
Decarbonization of energy systems would reduce the substitution impacts of wood products relative to currently fossil energy intensive alternative materials. However, large-scale decarbonization of major fossil CO2 emitters, such as construction sector and metals production, remains behind schedule (IPCC 2023). Total energy consumption increases proportionally to or faster than the renewable energy production, thus new global records of fossil fuel consumption are still being set (IEA 2023). While Brunet-Navarro et al. (2021) predicted a 1/3 reduction in substitution impacts by 2030, our decarbonization speed is 65% reduction by 2050, following the pace suggested by Hurmekoski et al. (2023). Such a reduction in fossil fuel intensity of the energy systems would represent tremendous progress in climate change mitigation. However, some decarbonization technologies could also apply to wood processing operations, thus moderating the decrease in the DFs relative to non-wood options. Regardless of the extent of decarbonization, and the potential reductions in wood product DFs, as long as the DFs are positive, there remains further opportunity to derive substitution impacts from wood use.
We divided forest products into five categories. More precise division of the product streams and their DFs would result in more detailed information, but we assume that the substitution impact magnitudes would not change dramatically. The future relative volumes of specific products are unknown. Thus, we assumed that changes in harvest volume would affect all product groups equally. Future harvest volume changes may result in a different share of an existing product with high or low DF, or novel products with high or low DFs may replace some existing products.
The substitution intensity of harvest in 2020 ranged widely (0.21–0.65; Table 3), reflecting the variations between low and high DF sets and the regional variations in product mix. Substitution intensity in the past was likely different due to changes in DFs and product mix but was within the range reported for 2020. Taylor et al. (2023) reported a substitution intensity of harvest ranging from 0.35 to 0.44 tCO2e m–3 for the United States over the past 30 years, which is within the range we report for 2020.
Uncertainties related to DFs are high and may be higher the larger geographical area considered. Types and volumetric use of wood and non-wood products, as well as energy and material efficiency of their manufacture, vary geographically, making global estimates of wood substitution impacts unprecise today, as well as in future projections. Given these uncertainties, we limited the future analysis to Finland, for which there are published wood production and use scenarios (Maanavilja et al. 2021).
We acknowledge the methodological limitations in the DF approach in general (Leskinen et al. 2018; Howard et al. 2021), as well as shortcomings in our simplified approach to estimate geographical ranges in substitution impacts. Therefore, we chose the most conservative option in several calculation phases. The substitution impacts presented in this article are likely underestimates.
4.3 Policy implications
Our estimates of avoided fossil carbon emissions due to wood substitution for the EU in 2020 (149–317 MtCO2e depending on DF set applied; Table 2) are of the same order of magnitude to the 410 MtCO2e reported by Holmgren (2020) for the EU, UK, Norway, and Switzerland. Grassi et al. (2021) commented that this is “about ten times higher than values typically provided by other assessments” (cited as ranging 2-43 MtCO2e year–1). Grassi et al. (2021) approached the substitutions from the climate change mitigation view, thus treating them as an additional mitigation option for the future. This approach unfortunately does not account for the current wood substitution impacts, nor the substitution impacts provided in the past. Given that fossil GHG emissions are the root cause of climate change, past and future wood use has caused and will cause climate benefits via avoiding fossil emissions. The magnitude of the substitution impacts suggests that the current fossil GHG emissions by humankind, as well as the atmospheric fossil-derived CO2 content, would be larger if less wood had been used.
In addition to sawn timber, wood-based energy is a major component of avoided fossil emissions by wood use. Past examples of national economic development have included a shift away from wood as a primary energy source, and towards fossil fuels (Taylor 2016; Perlin 2022). Recent examples of energy use trends in developing countries suggest a similar pattern. It remains to be seen whether developing economies will transition from wood directly to other renewable energy sources, without an intervening use of fossil fuels. If not, i.e., past trends of wood energy being replaced by fossil energy are repeated, this will represent a reversal in the global wood substitution impact and more fossil fuel emissions, albeit with possible increases in forest carbon storage. It is evident that in countries with extensive forest industries and ample availability of by-products, FAOSTAT wood energy statistics that exclude industrial by-products, are underestimates. Regardless, the large wood energy substitution impacts at all geographical scales reflect the continuing importance of wood as a non-fossil energy source.
Imported products, which are excluded from the production-based national LULUCF reporting, also have a climate role: they reduce the destination country’s emissions via substitutions. This is currently a completely uncredited climate benefit.
Although wood product’s substitution impact is not a component in IPCC reporting, and hence currently receives little recognition in the global carbon market, the consideration of avoided fossil emissions is not unprecedented. For example, avoided fossil emissions are a common measure of the value of alternative energy technologies (IRENA 2024). An international standard method for calculating DFs has been developed (ISO 2024) and it could be used to enable the inclusion of wood substitution impacts in the carbon market offsets associated with the production or use of wood in place of other materials, similar to how offsets are assigned to alternative electricity generation. Such a scheme raises questions about the additionality of the offsets, given that wood is already a commonly used energy and material resource. However, past usage of wood does not guarantee its future use. The per capita usage of wood is declining in some countries, e.g., the United States (Howard and Liang 2019; FAO 2020a). Wood substitution offsets would be permanent if any use of wood avoids the demand for alternative products. They would also avoid carbon leakage, for the same reason: replacement of fossil fuel intensive materials with wood in one location would not increase the use of alternative materials elsewhere; hence they would marginally decrease the demand for and production of alternative materials.
Sawn timber, with relatively high DFs, and wood energy, with large production volumes, were important independently of the DF set or harvest volume (Fig. 2). The over two-fold difference between the low and high substitution impact estimates was mostly because of very different DFs assigned to pulp and paper, and paperboard (Table 1). Sawn timber is the biggest contributor to avoided fossil emissions at all geographical scales (Table 2). Lumber production is expected to increase in Europe and globally (FAO 2022c), which suggests that its substitution impacts will also increase. Worldwide, the energy produced from wood is of similar substitution impact to sawn timber. Wood fuels are of fundamental importance as a primary energy source in developing countries. Within the wood products manufacturing industries, the use of wood residues to fuel processing (e.g., for drying lumber and paper) contributes to the positive DF of the products.
We believe that the total volume of wood-based carbon storage, i.e., forests and HWP, can be increased and maintained more efficiently by sustainable wood use than without it. This statement applies to both regional and global contexts. For example, over 1000 × 106 m3 of roundwood was processed into products and energy in Finland between 2000 and 2020, causing a cumulative substitution impact of hundreds of MtCO2e (Table 3) partially in Finland (domestic use) and partially abroad (exports). The Finnish forest growing stock volume increased by approximately 20% during the same period (FAO 2020b). Substitution impacts by HWPs are likewise huge for the EU and world with, respectively, growing or slightly decreasing inventories over the time period (FAO 2020a).
5 Conclusions
Wood-based products and fuel substitute for fossil carbon emission intensive materials and energy sources, thus reducing fossil GHG emissions. Biogenic and fossil carbon react similarly in the greenhouse effect, but the primary cause of climate change is fossil carbon emissions. Wood’s substitution effect is the only large-scale forest-related carbon benefit that reduces fossil carbon emissions.
We present a range for the avoided fossil emissions by the substitution impacts of different wood-based products in Finland, the EU and the world. The single most important computational factor affecting the present and future substitution impacts by wood use is the displacement factor (DF) set applied. Uncertainties of wood product production data are another source of variation, but less significant than the DFs. Country-specific DFs – when available – could produce more accurate substitution impact estimates for larger geographical areas.
Despite the uncertainties, our estimates suggest large climate benefits for wood use. In Finland, the substitution impact approaches to the scale of country’s total fossil emissions. At the EU and the world, wood’s substitution impact is similar in scale to the entire reported LULUCF criterion. Given this importance, in addition to the LULUCF sector’s biogenic carbon also wood’s substitution impact should be considered to obtain a holistic view on net climate effects of wood use.
In addition to their broadly studied biological functions, the role of forests in climate change should be also understood in view of avoided fossil emissions in production and consumption systems. Far greater volume of fossil carbon would have been released into the atmosphere if fewer wood products were used during the past ca. 150 years. On the other hand, it is evident that the use of fossil resources for the needs of increasing population instead of wood has contributed to the regrowth of overexploited or lost forests. Future development that maintains the sustainable use wood from renewable forests will be an important part of global efforts to reduce fossil emissions and the associated climate change.
Acknowledgements
We thank Natural Resources Institute Finland (Luke) and Fulbright Finland for funding the early phases, and University of Eastern Finland for supporting the latter progress of this work. Fruitful discussions with Dr. Elias Hurmekoski, Dr. Paula Ollila, and several others are gratefully acknowledged.
Authors’ contributions
Conceptualization (HH, AT, AM, MT), methodology (HH, AT, AM, MT, JP), analysis (AT, AM, HH), resources (HH, AT), writing – original draft (HH, AT, AM), writing – review & editing (HH, AT, AM, JP, MT), supervision (HH), project administration (HH). All authors have accepted the contents of the manuscript.
Declaration of competing interest
The authors declare that they have no affiliations or other personal relationships or interests that might have affected the study and its results.
Data availability
The data on which the analysis is based, are publicly available in the following statistics databases:
https://www.luke.fi/fi/tilastot
https://www.fao.org/faostat/en/#data/FO
https://unece.org/forests/joint-wood-energy-enquiry (only aggregates across reporting countries publicly available, but detailed information for Finland is available from the authors by request)
References
Alarotu M, Pajula T, Hakala J, Harlin A (2020) Metsäteollisuuden tuotteiden ilmastovaikutukset. [Climate effects of forest industry products]. Customer report, VTT-CR-00682-20.
Brunet-Navarro P, Jochheim H, Cardellini G, Richter K, Muys B (2021) Climate mitigation by energy and material substitution of wood products has an expiry date. J Clean Prod 303, article id 127026. https://doi.org/10.1016/j.jclepro.2021.127026.
CO2 emissions per capita (2024) https://ourworldindata.org/grapher/co-emissions-per-capita.Accessed 27 March 2026.
Crippa M, Guizzardi D, Solazzo E, Muntean M, Schaaf E, Monforti-Ferrairio F, Banja M, Olivier J, Grassi G, Rossi S, Vignati E (2021) GHG emissions of all world countries – 2021 Report. EUR 30831 EN, Publications Office of the European Union, Luxembourg. https://data.europa.eu/doi/10.2760/173513.
EUROSTAT (2024) Greenhouse gas emissions by source sector. https://doi.org/10.2908/env_air_gge.
FAO (2020a) Global forest resources assessment 2020: main report. FAO, Rome.
FAO (2020b) Global forest resources assessment: report Finland. FAO, Rome. https://openknowledge.fao.org/server/api/core/bitstreams/a037737a-25e4-4f04-be0c-5f2eb5784e36/content. Accessed 5 July 2024.
FAO (2022a) Classification of forest products 2022. FAO, Rome. https://doi.org/10.4060/cb8216en.
FAO (2022b) FAO yearbook of forest products 2020. FAO, Rome. https://doi.org/10.4060/cc3475m.
FAO (2022c) Global forest sector outlook 2050: assessing future demand and sources of timber for a sustainable economy – background paper for The State of the World’s Forests 2022. FAO Forestry Working Paper 31. FAO, Rome. https://doi.org/10.4060/cc2265en.
FAOSTAT (2023) Forestry production and trade. Food and agriculture organization of the United Nations. https://www.fao.org/faostat/en/#data/FO. FAO, Rome. Accessed 22 April 2024.
FAOSTAT (2024) Forestry production and trade. https://www.fao.org/faostat/en/#data/FO. FAO, Rome. Accessed 22 April 2024.
Friedlingstein P, O’Sullivan M, Jones MW, Andrew RM, Bakker DCE, Hauck J, Landschützer P, Le Quéré C, Luijkx IT, Peters GP, Peters W, Pongratz J, Schwingshackl C, Sitch S, Canadell JG, Ciais P, Jackson RB, Alin SR, Anthoni P, Barbero L, Bates NR, Becker M, Bellouin N, Decharme B, Bopp L, Brasika IBM, Cadule P, Chamberlain MA, Chandra N, Chau T-T-T, Chevallier F, Chini LP, Cronin M, Dou X, Enyo K, Evans W, Falk S, Feely, RA, Feng L, Ford DJ, Gasser T, Ghattas J, Gkritzalis T, Grassi G, Gregor L, Gruber N, Gürses Ö, Harris I, Hefner M, Heinke J, Houghton RA, Hurtt GC, Iida Y, Ilyina T, Jacobson AR, Jain A, Jarníková T, Jersild A, Jiang F, Jin Z, Joos F, Kato E, Keeling RF, Kennedy D, Goldewijk KK, Knauer J, Korsbakken JI, Körtzinger A, Lan X, Lefèvre N, Li H, Liu J, Liu Z, Ma L, Marland G, Mayot N, McGuire PC, McKinley GA, Meyer G, Morgan EJ, Munro DR, Nakaoka S-I, Niwa Y, O’Brien KM, Olsen A, Omar AM, Ono T, Paulsen M, Pierrot D, Pocock K, Poulter B, Powis CM, Rehder G, Resplandy L, Robertson E, Rödenbeck C, Rosan RM, Schwinger J, Séférian R, Smallman TL, Smith SM, Sospedra-Alfonso R, Sun Q, Sutton AJ, Sweeney C, Takao S, Tans PP, Tian H, Tilbrook B, Tsujino H, Tubiello F, van der Werf GR, van Ooijen E, Wanninkhof R, Watanabe M, Wimart-Rousseau C, Yang D, Yang X, Yuan W, Yue X, Zaehle S, Zeng J, Zheng B (2023) Global carbon budget 2023. Earth Syst Sci Data 15: 5301–5369. https://doi.org/10.5194/essd-15-5301-2023.
Grassi G, Fiorese G, Pilli R, Jonsson K, Blujdea V, Korosuo A, Vizzarri M (2021) In: Sanchez Lopez J, Jasinevičius G, Avraamides M (eds) Brief on the role of the forest-based bioeconomy in mitigating climate change through carbon storage and material substitution. European Commission, JRC124374. https://publications.jrc.ec.europa.eu/repository/handle/JRC124374.
Gustavsson L, Sathre R (2006) Variability in energy and carbon dioxide balances of wood and concrete building materials. Build Environ 41: 940–951. https://doi.org/10.1016/j.buildenv.2005.04.008.
Gustavsson L, Sathre R, Leskinen P, Nabuurs G-J, Kraxner F (2022) Comment on ‘Climate mitigation forestry – temporal trade-offs’. Environ Res Lett 17, article id 048001. https://doi.org/10.1088/1748-9326/ac57e3.
Harmon M (2019) Have product substitution carbon benefits been overestimated? A sensitivity analysis of key assumptions. Environ Res Lett 14, article id 065008. https://doi.org/10.1088/1748-9326/ab1e95.
Holmgren P (2020) Climate effects of the forest based sector in the European Union. Confederation of European Paper Industries. Confederation of European Paper Industries (CEPI), Brussels. https://www.cepi.org/cepi-study-climate-effects-of-the-forest-based-sector-in-the-european-union/. Accessed 13 February 2024.
Howard C, Dymond CC, Griess VC, Tolkien-Spurr D, van Kooten GC (2021) Wood product carbon substitution benefits: a critical review of assumptions. Carbon Balance Manage 16, article id 9. https://doi.org/10.1186/s13021-021-00171-w.
Hurmekoski E, Myllyviita T, Seppälä J, Heinonen T, Kilpeläinen A, Pukkala T, Mattila T, Hetemäki L, Asikainen A, Peltola H (2020) Impact of structural changes in wood‐using industries on net carbon emissions in Finland. J Ind Ecol 24: 899–912. https://doi.org/10.1111/jiec.12981.
Hurmekoski E, Kunttu J, Heinonen T, Pukkala T, Peltola H (2023) Does expanding wood use in construction and textile markets contribute to climate change mitigation? Renew Sustain Energy Rev 174, article id 113152. https://doi.org/10.1016/j.rser.2023.113152.
IEA (2023) Energy statistics data browser. IEA, Paris. https://www.iea.org/data-and-statistics/data-tools/energy-statistics-data-browser. Accessed 8 November 2024.
IPCC (2006) 2006 IPCC Guidelines for National Greenhouse Gas Inventories Volume 4 Agriculture, Forestry and Other Land Use. https://www.ipcc-nggip.iges.or.jp/public/2006gl/vol4.html, Accessed 8 February 2024.
IPCC (2023) Summary for policymakers. In: Lee H, Romero J (eds) Climate change 2023: synthesis report. Contribution of Working Groups I, II and III to the Sixth Assessment Report of the Intergovernmental Panel on Climate Change. IPCC, Geneva, Switzerland, pp –34. https://doi.org/10.59327/IPCC/AR6-9789291691647.001.
IRENA (2024) International renewable energy agency avoided emissions calculator. https://www.irena.org/Data/View-data-by-topic/Climate-Change/Avoided-Emissions-Calculator. Accessed 22 April 2024.
ISO (2024) ISO/DIS 13391-3 Wood and wood-based products. Greenhouse gas dynamics. Part 3: Displacement of greenhouse gas emissions.
Kallio M, Solberg B, Käär L, Päivinen R (2018) Economic impacts of setting reference levels for the forest carbon sinks in the EU on the European forest sector. For Pol Econ 92: 193–201. https://doi.org/10.1016/j.forpol.2018.04.010.
Kärhä K, Haavikko H, Kääriäinen H, Palander T, Eliasson L, Roininen K (2023) Fossil-fuel consumption and CO2eq emissions of cut-to-length industrial roundwood logging operations in Finland. Eur J For Res 142: 547–563. https://doi.org/10.1007/s10342-023-01541-4.
Lehtonen A, Aro L, Haakana M, Haikarainen S, Heikkinen J, Huuskonen S, Härkönen K, Hökkä H, Kekkonen H, Koskela T, Lehtonen H, Luoranen J, Mutanen A, Nieminen M, Ollila P, Palosuo T, Pohjanmies T, Repo A, Rikkonen P, Räty M, Saarnio S, Smolander A, Soinne H, Tolvanen A, Tuomainen T, Uotila, K, Viitala E-J, Virkajärvi P, Wall A, Mäkipää R (2021) Maankäyttösektorin ilmastotoimenpiteet: arvio päästövähennysmahdollisuuksista. [Climate actions on land use sector: estimate of emission reductions potentials]. Luonnonvara- ja biotalouden tutkimus 7/2021. Natural Resources Institute Finland (Luke), Helsinki. https://urn.fi/URN:ISBN:978-952-380-152-3.
Leskinen P, Cardellini G, González-García S, Hurmekoski E, Sathre R, Seppälä J, Smyth C, Stern, T, Verkerk PJ (2018) Substitution effects of wood-based products in climate change mitigation. From Science to Policy 7. European Forest Institute. https://doi.org/10.36333/fs07
Luke (2024a) Solid wood fuel consumption in heating and power plants by region (1,000 m3, GWh). https://statdb.luke.fi/PxWeb/pxweb/en/LUKE/LUKE__met__puukay__pe/0400_puukay.px/. Accessed 23 March 2024.
Luke (2024b) Production of wood pulp, and paper and paperboard (1000 t) 1955–2021. https://statdb.luke.fi/PxWeb/pxweb/en/LUKE/LUKE__met__zzz_lak__Metsateollisuus/10.02_Puumassan_seka_paperin_ja_kartongin_tuota.px/. Accessed 23 March 2024.
Luke (2024c) Production of sawn goods and wood-based panels (1000 m3) 1955–2021. https://statdb.luke.fi/PxWeb/pxweb/en/LUKE/LUKE__met__zzz_lak__Metsateollisuus/10.01_Sahatavaran_ja_puulevyjen_tuotanto_1955.px/. Accessed 23 March 2024.
Maanavilja L, Tuomainen T, Aakkula J, Haakana M, Heikkinen J, Hirvelä H, Kilpeläinen H, Koikkalainen, K, Kärkkäinen, L, Lehtonen, H, Miettinen, A, Mutanen, A, Myllykangas, J-P, Ollila P, Viitanen J, Vikfors S, Wall A (2021) Hiilineutraali Suomi 2035: maankäyttö- ja maataloussektorin skenaariot. [Carbon neutral Finland 2035: land use and agricultural sector scenarios]. Valtioneuvoston selvitys- ja tutkimustoiminnan julkaisusarja 2021:63. Prime Minister’s Office. Helsinki. http://urn.fi/URN:ISBN:978-952-383-263-3.
Miner R (2010) Impact of the global forest industry on atmospheric greenhouse gases. FAO Forestry Paper 159. FAO, Rome. https://www.fao.org/4/i1580e/i1580e00.pdf. Accessed 8 November 2024.
Nabuurs G-J, Delacote P, Ellison D, Hanewinkel M, Hetemäki L, Lindner M (2017) By 2050 the mitigation effects of EU forests could nearly double through climate smart forestry. Forests 8, article id 484. https://doi.org/10.3390/f8120484.
Peng L, Searchinger TD, Zionts J, Waite R (2023) The carbon costs of global wood harvests. Nature 620: 110–115. https://doi.org/10.1038/s41586-023-06187-1.
Perlin J (2022) A forest journey: the role of trees in the fate of civilization. 3rd revised edition. Ventura, CA, Patagonia Books. ISBN 978-1-938340-97-0.
Pingoud K, Pohjola J, Valsta L (2010) Assessing the integrated climatic impacts of forestry and wood products. Silva Fenn 44: 155–175. https://doi.org/10.14214/sf.166.
Pukkala T (2018) Carbon forestry is surprising. For Ecosyst 5, article id 11. https://doi.org/10.1186/s40663-018-0131-5.
Roebroek C, Duveiller G, Seneviratne S, Davin E, Cescatti A (2023) Releasing global forests from management: how much more carbon could be stored? Science 380: 749–753. https://doi.org/10.1126/science.add5878.
Sathre R, O’Connor J (2010) Meta-analysis of greenhouse gas displacement factors of wood product substitution. Environ Sci Policy 13: 104–114. https://doi.org/10.1016/j.envsci.2009.12.005.
SCMP (2021) Day after Xinjiang link disclosed, Finnish wood pulp giant Stora Enso says it will leave viscose market. South China Morning Post. https://www.scmp.com/news/china/article/3127542/day-after-xinjiang-link-disclosed-finnish-wood-pulp-giant-stora-enso. Accessed 2 May 2024.
Sedjo RA (1989) Forests: a tool to moderate global warming? Env Sci Policy Sustain Dev 31: 14–20. https://doi.org/10.1080/00139157.1989.9929929.
Seppälä J, Heinonen T, Pukkala T, Kilpeläinen A, Mattila T, Myllyviita T, Asikainen A, Peltola H (2019) Effect of increased wood harvesting and utilization on required greenhouse gas displacement factors of wood-based products and fuels. J Environ Manage 247: 580–587. https://doi.org/10.1016/j.jenvman.2019.06.031.
Shen L, Worrell E, Patel MK (2010) Environmental impact assessment of man-made cellulose fibres. Resour Conserv Recycl 55: 260–274. https://doi.org/10.1016/j.resconrec.2010.10.001.
Skytt T, Englund G, Jonsson B-G (2021) Climate mitigation forestry – temporal trade-offs. Environ Res Lett 16, article id 114037. https://doi.org/10.1088/1748-9326/ac30fa.
Soimakallio S, Saikku L, Valsta L, Pingoud K (2016) Climate change mitigation challenge for wood utilization. The case of Finland. Environ Sci Technol 50: 5127–5134. https://doi.org/10.1021/acs.est.6b00122.
Statistical Yearbook of Forestry (2023) Kulju I, Niinistö T, Peltola A, Räty M, Sauvula-Seppälä T, Torvelainen J, Uotila E, Vaahtera E. The Finnish Statistical Yearbook of Forestry 2022. Natural Resources Institute Finland (Luke), Helsinki. http://urn.fi/URN:ISBN:978-952-380-584-2.
Taylor A (2016) Does saving our forests cause global warming? J For 114: 144–145. https://doi.org/10.5849/jof.15-080.
Taylor A, Hurmekoski E, Domke GM, Brandeis C (2023) Substitution estimates for wood products in the United States, 1990 to 2020. For Prod J 73: 362–369. https://doi.org/10.13073/FPJ-D-23-00036.
Wedajo DY, Cristescu C, Billore S, Adamopoulos S (2025) Carbon impact of wood-based products through substitution: a review of assessment aspects and future research perspectives in life cycle assessment. Carbon Manag 16, article id 2536350. https://doi.org/10.1080/17583004.2025.2536350.
Total of 52 references.

