Yrjö Nuutinen,
Jari Miina  ,
Timo Muhonen,
Janne Uuttera,
Heikki Ovaskainen
,
Timo Muhonen,
Janne Uuttera,
Heikki Ovaskainen
Comparing the characteristics, removals and incomes of zone- and low-thinned stands of Norway spruce
Nuutinen Y., Miina J., Muhonen T., Uuttera J., Ovaskainen H. (2026). Comparing the characteristics, removals and incomes of zone- and low-thinned stands of Norway spruce. Silva Fennica vol. 60 no. 2 article id 26007. https://doi.org/10.14214/sf.26007
Highlights
- At the first thinning stage, zone thinning resulted in lower removals and incomes than low thinning
- The total removal and income from the first thinning and subsequent simulated cuttings did not differ between thinning treatments
- Zone thinning is a feasible option for the first thinning
- On peatland, zone thinning would diversify stand structure and encourage natural regeneration.
Abstract
Zone thinning is designed to improve harvesting productivity in the first commercial thinning and facilitate the transition to continuous cover forestry by encouraging natural regeneration. In zone thinning, the density of the remaining stand varies between strip roads 30 m apart, from heavily thinned roadside zones to untreated zones >10 m from the road. In the subsequent thinning, strip roads are opened in the untreated zones. This study first compared the characteristics and removals of Norway spruce (Picea abies (L.) H. Karst.) dominated stands after zone and low thinning. Thinning treatments were applied in two planted stands on mineral soil at the first commercial thinning stage, and in two advanced thinning stands on drained peatlands. The harvested removals were obtained from the harvester records. Secondly, the post-treatment development and removal of the experimental plots were predicted using a distance-dependent, individual-tree simulator that had been developed for spruce-pine (Pinus sylvestris L.) mixtures. On zone-thinned plots of young thinning stands, the number of stems per ha was significantly higher, and the amount harvested was significantly lower, compared to low-thinned plots. In advanced thinning stands, the stand basal area and volume were higher on zone-thinned plots than on low-thinned plots. Total removals (harvested and simulated) and cutting incomes during the rotation period did not differ between zone and low thinning treatments. This suggests that zone thinning could be used for the first thinning without reducing timber production or revenues.
Keywords
Picea abies;
peatland;
simulation;
first thinning;
hpr-data;
thinning removal
-
Nuutinen,
Natural Resources Institute Finland (Luke), Yliopistokatu 6B, FI-80101 Joensuu, Finland
 https://orcid.org/0000-0003-3360-4444
E-mail
yrjo.nuutinen@luke.fi
https://orcid.org/0000-0003-3360-4444
E-mail
yrjo.nuutinen@luke.fi
-
Miina,
Natural Resources Institute Finland (Luke), Yliopistokatu 6B, FI-80101 Joensuu, Finland
https://orcid.org/0000-0002-8639-4383
E-mail
jari.miina@luke.fi
- Muhonen, E-mail tmuhonen@saunalahti.fi
- Uuttera, UPM Forest, Vankanlähde 7, FI-13100 Hämeenlinna, Finland E-mail janne.uuttera@upm.com
-
Ovaskainen,
https://orcid.org/0000-0001-5063-6662
E-mail
heikki.ovaskainen1@gmail.com
Received 30 January 2026 Accepted 23 May 2026 Published 18 June 2026
Views 4286
Available at https://doi.org/10.14214/sf.26007 | Download PDF

Supplementary Files
1 Introduction
The primary aim of thinning is to improve the growth and quality of the remaining trees, allowing them to develop into valuable timber, by removing undesirable trees. Thinning young stands also enhances the forest’s vigour and resilience, improving the forest’s ability to withstand wind and snow damage (Venäläinen et al. 2020). Despite their silvicultural importance (Mäkinen and Isomäki 2004; Huuskonen and Hynynen 2006; Nilsson et al. 2010; Niemistö et al. 2018), first commercial thinnings are frequently postponed or not carried out (Korhonen et al. 2024), largely because current harvesting systems yield limited economic returns when stem size and removal volumes are low (Kärhä et al. 2004; Ahtikoski et al. 2021). Therefore, there is a need to develop a thinning method that is operator-friendly and considers both efficient harvesting and forest management recommendations for young stands.
Selective thinning from below (hereafter low thinning) has emphasised uniform spacing and timber yield, often resulting in relatively homogeneous stand structures (Kellomäki 2024). Implementing continuous cover forestry (CCF) instead of traditional rotation forestry, which involves thinnings and clearcutting, would likely yield significant ecological, economic and social benefits (Rautio et al. 2025). However, beginning CCF on logging sites where the forest stand is quite regularly structured and has only undergone low thinning may be challenging (Bianchi et al. 2023). Selecting and successfully implementing the appropriate harvesting method requires thorough preliminary planning specific to each stand, as well as the right technology, working methods and skilled personnel (Leppänen et al. 2025). Therefore, a thinning method is needed to encourage natural regeneration and start the transition to CCF by moving towards an irregular stand structure.
Variable density thinning (VDT) differs from conventional thinning in that the density of the remaining trees within a stand varies (Carey 2003). VDT is a silvicultural strategy designed both to accelerate forest growth and to promote spatial heterogeneity and structural complexity. The zone thinning method, a variant of VDT, was developed for the first thinning to create three harvesting zones along the strip roads (Fig. 1). The idea is that thinning intensity decreases from the strip road towards the 10-m-wide untreated zone in the middle of the strip roads. In the first thinning, the distance between the strip roads is set at 30 m, with the area 0–6 meters from the centre of the strip roads being thinned heavily. Only individual trees that are easy to cut are harvested from the 4-m-wide zone between the heavily thinned and untreated zones. The aim is that the subsequent thinning will open the strip roads into the untreated zone, after which the remaining density will be at the same level throughout the stand area. In principle, the strip roads from the first thinning will not be used for the subsequent thinning.
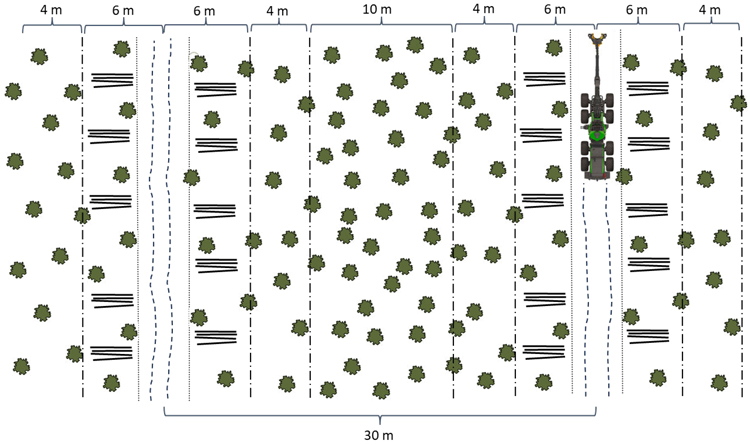
Fig. 1. The schematic picture showing the first thinning according to the zone thinning method. The strip roads are 30 m apart, with a 10-m-wide unharvested zone between them. The zones parallel to the strip roads have varying intensity of thinning. In the second thinning, the strip roads are opened into the unharvested zone, and the stand is thinned to create a uniform density throughout the stand area. Source: Ovaskainen et al. (2024).
The zone thinning method offers several potential benefits in logging, all of which would encourage the adoption of this new working method (Ovaskainen 2009; Palander et al. 2012; Ovaskainen et al. 2024). The thinning intensity is high near the strip road, meaning many trees to be removed are located close to the strip road and harvester. The search time and distance of the trees to the harvester are shorter, there is more working space due to lower tree density, and fewer growing trees are damaged. Furthermore, the harvester head can be controlled more accurately when the harvester is closer to the trees. The harvester operator has better visibility, and the machine’s lights are more effective. More logging residue accumulates on the strip roads as more trees are harvested close to roads. As a result of this method, the forest has a varied density, comprising both thinned and untreated areas. Zone thinning thus diversifies stand structure and can serve as a transition cutting to CCF, especially if natural seedlings regenerate on the strip roads of the first thinning and on the heavily thinned zone alongside them.
Karhumaa (2021) compared the time consumption and productivity of zone and low thinning using a harvester simulator and virtual stands, with first and second thinnings performed by professional harvester operators. Zone thinning increased combined productivity by 17–21% compared to low thinning, mainly due to larger trees felled during the second thinning. It also reduced tree damage in the first thinning, while no differences were observed in the second thinning. Ovaskainen et al. (2024) examined the harvesting productivity in zone and low thinning in Norway spruce-dominated stands at the first thinning stage. On their harvesting areas, the removal harvested in low thinning was almost 50% higher than in zone thinning. Despite lower removal volumes, the cutting of zone thinning was about 8% more productive than low thinning in the first thinning. Zone thinning also resulted in less damage to remaining trees, although the difference was not statistically significant (Uusitalo 2023).
These results suggest that the zone thinning method could increase the harvesting productivity of the first thinning operation, as its features are similar to those of systematic thinning methods (boom-corridor thinning) and make the harvester’s boom easier to use (Bergström et al. 2010; Nuutinen et al. 2020; Nuutinen et al. 2021; Bergström et al. 2022). However, the zone thinning method raises questions about its effects on the structure, growth and quality of the growing stock, while simultaneously diversifying stand structure and facilitating the implementation of CCF. Further information is required on thinning removals and the spatial distribution of remaining trees, as well as on how stands will develop in future compared to low-thinned stands.
This study aimed to compare the characteristics, removals and incomes of zone- and low-thinned stands dominated by Norway spruce. Thinning treatments were implemented on the plots in two young thinning stands on mineral soil and in two advanced thinning stands on drained peatland. Due to different harvesting strategies, the post-treatment stand structure (stem number, stand basal area and volume, mean diameter and height) and volumes harvested (sawlogs, pulpwood and mean stem volume) are expected to differ between the methods. The future development and subsequent cuttings of the plots were predicted using a distance-dependent stand growth simulator. Our hypothesis was that total removals and cutting incomes during the rotation period do not differ, regardless of whether zone or low thinning was done on the plots.
2 Material and methods
2.1 Description of sites, treatments and data collection
Thinning experiments were established, and the data were collected as outlined in Table 1. The thinning treatments were carried out in four stands dominated by Norway spruce (Picea abies (L.) H. Karst.) in Central and Eastern Finland (Fig. 2, Table 2, Supplementary file S1: Fig. S1). Stands 1 and 2 were planted and represent young thinning stands at the stage of the first commercial thinning, whereas Stands 3 and 4 were naturally regenerated and represent advanced thinning stands that have not been thinned previously (Table 2). According to the Finnish site type classification (Cajander 1949), Stands 1 and 2 were growing on medium-fertile mineral soil (Myrtillus type). Stands 3 and 4 were growing on drained peatlands of medium fertility, i.e., Vaccinium myrtillus drained peatland forest type (Laine et al. 2018). In young thinning stands, zone thinning was aimed to improve harvesting productivity, and in peatland stands, this thinning method was used as a transition to CCF.
| Table 1. Workflow of establishing experiments, collecting data and conducting simulations in the study stands in Central and Eastern Finland. | |
| Stands 1 and 2 in Central Finland | Stands 3 and 4 in Eastern Finland |
| 1. Selecting stands for thinning treatments. 2. Allocating the treatments within stands. 3. Cutting and recording the hpr files. 4. Locating plots within stands and measuring the remaining trees on the plots. 5. Calculating the plot-wise removal using plot locations and the hpr files. 6. Calculating the stand characteristics and harvested removals for each plot. 7. Running simulations using the remaining trees as initial stand states. | 1. Selecting stands for thinning treatments. 2. Locating the plots within the stands. 3. Allocating the treatments for the plots. 4. Cutting and recording the hpr file for each plot. 5. Measuring the remaining trees on the plots. 6. Calculating plot-wise removal using hpr files. 7. Calculating stand characteristics and harvested removals for each plot. 8. Running simulations using the remaining trees as initial stand states. |
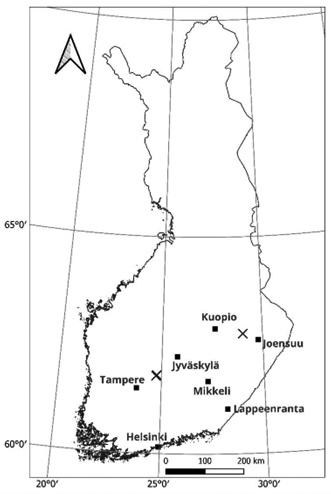
Fig. 2. Locations of the spruce-dominated stands (×) used to study the zone and low thinning treatments in Central and Eastern Finland.
| Table 2. Number of plots measured in Stands 1–4 located in Central (1 and 2) and Eastern Finland (3 and 4) and stand age according to UPM-Kymmene’s forest resources data. In total, 30 plots were included in the study: 18 zone-thinned plots and 12 low-thinned plots. | ||||||||
| Stand | Location | Stand age (years) | Number of plots | Second thinning** | Time since final cutting (years) | |||
| Zone thinning* | Low thinning | Total | Time since (years) | Thinning intensity (%) | ||||
| 1 | Jämsä (61°48´N, 24°46´E) | 37 | 4 | 2 | 6 | 10–15 / 15 | 24–34 / 17–25 | 30 |
| 2 | Orivesi (61°47´N, 24°44´E) | 33 | 2 | 1 | 3 | 15 / 10 | 29 / 31 | 30 |
| 3 | Outokumpu (62°46´N, 29°01´E) | 63 | 6 | 4 | 10 | 10–15 / 10–15 | 33–46 / 28–35 | 25 |
| 4 | Outokumpu (62°45´N, 29°00´E) | 68 | 6 | 5 | 11 | 10–15 / 15–20 | 27–38 / 21–24 | 35 |
| * On the zone thinning plots of Stands 1–3, trees were removed using thinning from below, whereas in Stand 4, both large and small trees were removed. ** Time since and intensity in second thinning are given separately for zone- and low-thinned plots. Three low-thinned plots in Stand 4 had no second thinning before clearcutting. | ||||||||
Zone and low thinning treatments were applied in all the four stands. Low thinning removed suppressed and subdominant trees, while aiming at an even density of the remaining trees between strip roads 20 m apart. In the zone thinning method, the trees were thinned at different intensities depending on their distance from the strip roads (Fig. 1). The strip roads were spaced 30 m apart, with a 10-m-wide unharvested zone between them and heavily thinned zones close to the strip roads. Young thinning stands (1 and 2) were pre-cleared and harvested in October 2022. In advanced thinning stands (3 and 4), thinning treatments (without pre-clearing of undergrowth) were carried out in February–March 2025. In young thinning stands, the harvester base machine was the John Deere 1170G harvester equipped with the CH6 crane (reach of 10.7 m) and the H424 harvester head, and in advanced thinning stands, the Komatsu 901 harvester with the 200H crane (reach of 11 m) and the C93 harvester head. Both forest-machine manufacturers have their versions of boom-tip control which assists the harvester operator in coordinating boom-tip movements. Boom-tip control also enables the determination of the stump position of the felled tree. Harvester production (hpr) files recorded by harvesters were used to calculate the volumes of sawlogs and pulpwood (Skogforsk 2025). This study does not report species-specific timber assortments due to the varying mixture of Scots pine (Pinus sylvestris L.) and birch (Betula spp.) among the plots.
Field measurements were taken in spring (Stands 1 and 2) and late summer (Stands 3 and 4) of 2025. In each stand, rectangular plots of 30 × 30 m (900 m2) or 30 × 20 m (600 m2), depending on the distance of strip roads (30 m in zone thinning and 20 m in low thinning), were established (Suppl. file S1: Figs. S2–S4). All remaining trees (height > 1.3 m) were mapped and measured by species, diameter at breast height (dbh) and harvesting damage. Damage was classified as tree top broken and stem or root wound, including broken roots at least 2 cm in diameter and no further than 1 m from the stem. All visible wounds, regardless of size, were recorded. In cases of both wounds and breakage, a broken treetop was recorded. On each plot, 30 trees were sampled for height (dm), and the sample was designed to be representative of the diameter distribution and species. The Cartesian coordinates of the trees were determined by their distance from a reference point and their angle from a reference direction (north).
In advanced thinning stands (3 and 4), the plots were set up prior to harvesting, and the harvesting removal on each plot was obtained from the plot-specific hpr files. In young thinning stands (1 and 2), the plots were established and measured after harvesting. Information on thinning removal from the plots was obtained by referring the plot locations and the locations of the removed trees in the hpr files (i.e., harvester head location at the time the tree was cut). For two low thinning plots, the hpr data only included the location of the harvester itself rather than the location of the removed trees. Therefore, the thinning removal on these plots was less precise than on the others.
2.2 Calculations, simulations and data analyses
The post-thinning stand characteristics were calculated for each plot using field measurements and the KPL software (Heinonen 1994). The remaining trees were partitioned into timber assortments by using the taper curve functions of Laasasenaho (1982). No deductions were made for defects; the volumes of timber assortments were based on the dimensions of the trees only. As the plots had not been measured prior to treatment, the pre-thinning volume for each plot was obtained using the remaining trees and harvested removals.
Zone and low thinning affect differently the spatial distribution of the remaining trees. The clustering or regularity of locations of the remaining trees was examined using the Clark-Evans test (Clark and Evans 1954). This test for aggregation in a spatial point pattern of trees was performed with the statistical software R version 4.5.1, and the clarkevans.test function in the statspat package (R Core Team 2025). The Clark-Evans index, R, is defined as the average nearest-neighbour distance for randomly sampled points, divided by the expected distance to the nearest neighbour. This dimensionless index R is equal to 1 in a completely random pattern. R > 1 indicates regularity, while R < 1 indicates clustering. The null hypothesis of complete spatial randomness at the 0.05 level was tested by using a two-sided test, a Monte Carlo simulation and a Donnelly edge correction.
The future development of the remaining trees and subsequent cuttings of the plots were simulated using a distance-dependent individual-tree models (Pukkala et al. 1998). The simulation started by using the spatial location, species, dbh and height of the trees remaining on the plots as inputs. Since the stand simulator predicted the diameter and height increments of pines and spruces, birches were considered as pines. Laasasenaho’s (1982) functions were used to calculate the timber assortments of the removed trees, without making any deductions for defects. Following Tapio’s (2025) silvicultural recommendations, the second thinning was simulated after 10–20 years as low thinning with a minimum distance of 1 m between remaining trees on each plot (Table 2). Three low-thinned plots in Stand 4 had no second simulated thinning before clearcutting, because stand basal area did not reach the thinning threshold (26 m2 ha−1) within the first 20 years. In advanced thinning stands, the intensity of thinning on half of the zone-thinned plots exceeded the recommended one-third of the stand’s basal area. In the second simulated thinning, no new strip roads were needed on the low-thinned plots, whereas new strip roads (4.5 m wide) were simulated 30 m apart on the unthinned zones of the zone-thinned plots. Clearcutting was simulated 25–35 years after the first treatment, with the same rotation length was applied to all plots within the stand. Clearcutting was also simulated in zone-thinned plots on peatland, where CCF was aimed, to achieve comparative simulation results.
Incomes from removals were calculated using the averages of the last five years stumpage prices in Central and Eastern Finland over the last five years during the felling seasons of 2020–2024 (Luke Statistics 2025). Only stumpage prices for spruce were used to avoid the confounding effects of varying species mixtures among the plots and different timber prices for pine and spruce. The following prices for spruce were applied to removals from thinning and clearcutting: 22.58 € m−3 and 26.13 € m−3 for pulpwood, and 60.87 € m−3 and 71.30 € m−3 for sawlogs, respectively. Due to the smaller size of the stems removed in the first thinning of Stands 1 and 2, all the thinning removal was considered pulpwood and a pulpwood stumpage price of 17.48 € m−3 was applied.
Analyses of variance were performed using the Univariate GLM procedure in IBM SPSS Statistics (version 30; IBM Corp. 2024) to evaluate the effects of the thinning treatments on the measured stand characteristics, as well as the harvested and simulated removals and incomes from removals. These analyses were performed separately for the young (1 and 2) and advanced thinning stands (3 and 4). A two-way ANOVA was performed using the stand and treatment effects, as well as their interaction, as fixed factors. When evaluating the effects of the thinning treatments on the volumes of and incomes from removals, initial differences between plots were corrected for using the pre-thinning stand volume of the plot as a continuous covariate. Pairwise multiple comparisons between treatments were performed using the Least Significant Difference (LSD) test with a significance level of 0.05.
3 Results
3.1 Stand structure after thinning
In young thinning stands (1 and 2) on mineral soil, the number of remaining stems per ha was significantly higher on zone-thinned plots than on low-thinned plots (Table 3). In advanced thinning stands (3 and 4) on peatland, the stand basal area and volume of the zone-thinned plots were higher than those of the low-thinned plots. Based on removals and post-thinning characteristics of peatland stands, low thinning favoured pine. No significant differences were found in the proportion of trees that were damaged in the thinning treatments. In young thinning stands (1 and 2), no broken treetops were observed, and in advanced thinning stands (3 and 4), 92% of damage occurred as stem or root wounds.
| Table 3. Means and standard deviations (SD) of post-thinning stand characteristics for all trees taller than 1.3 m on zone- and low-thinned plots in spruce-dominated stands in Central and Eastern Finland. Dbh = diameter at breast height (1.3 m). Treatment data for the same location marked with different letters are significantly different (p < 0.05) according to the two-way ANOVA with stand and treatment and their interaction as factors and post hoc LSD tests based on estimated marginal means. | |||||||||||||||||
| Thinning treatment | No. of plots | No. of stems (ha−1) | Stand basal area (m2 ha−1) | Stand volume (m3 ha−1) | Mean dbh, basal area-weighted (cm) | Mean height, basal area-weighted (m) | Proportion of spruce in volume (%) | Pre-thinning stand volume * (m3 ha−1) | Harvesting damage ** (%) | ||||||||
| Mean | SD | Mean | SD | Mean | SD | Mean | SD | Mean | SD | Mean | SD | Mean | SD | Mean | SD | ||
| Stands 1 and 2 in Central Finland | |||||||||||||||||
| Zone | 6 | 1233a | 272 | 16.0 | 3.7 | 100.1 | 26.7 | 14.9 | 1.4 | 13.3 | 1.3 | 76.5 | 11.5 | 133.4 | 43.5 | 0.7 | 1.3 |
| Low | 3 | 900b | 153 | 14.2 | 4.6 | 95.2 | 45.8 | 16.0 | 3.3 | 14.0 | 2.3 | 89.9 | 7.0 | 155.9 | 89.5 | 3.8 | 3.9 |
| Stands 3 and 4 in Eastern Finland | |||||||||||||||||
| Zone | 12 | 1332 | 604 | 21.8a | 3.4 | 160.1a | 40.2 | 19.7 | 3.5 | 18.7 | 3.5 | 53.4a | 13.3 | 334.9a | 99.1 | 5.8 | 3.2 |
| Low | 9 | 1265 | 314 | 17.2b | 4.6 | 123.1b | 43.4 | 18.9 | 3.3 | 17.7 | 3.6 | 34.3b | 13.4 | 249.8b | 58.6 | 3.2 | 3.8 |
| * Pre-thinning stand volume was calculated as the sum of the merchantable volume of the remaining trees and the volume harvested. ** Proportion of remaining trees with dbh > 70 mm that were damaged in thinning. | |||||||||||||||||
Significant differences in the pre-thinning volumes were observed in advanced thinning stands, so that the low thinning plots initially had a lower stand volume than the zone thinning plots (Table 3). In young thinning stands, the pre-thinning volumes also differed between treatments, resulting in a significant interaction of treatment and stand (p = 0.040). These initial differences between the plots were controlled by using the pre-thinning stand volume as a continuous covariate when evaluating the harvested and simulated removals and incomes.
In young thinning stands, the spatial distribution of trees after zone thinning was regular, i.e., the Clark-Evans index R was significantly (p < 0.01) greater than 1 (Suppl. file S1: Figs. S2–S4). The regular spatial distribution of trees was also observed on zone-thinned plots in advanced thinning stands. The spatial pattern of trees was random on each low-thinned plot.
3.2 Harvested and simulated removals
Based on the estimated marginal means, the removal harvested in low thinning of young thinning stands (1 and 2) was significantly 55% higher than in zone thinning (F = 25.16, p = 0.007) (Table 4). On the contrary, the removal of the subsequent simulated cuttings was higher on zone-thinned plots, especially for pulpwood (F = 12.49, p = 0.024). However, summing up the harvested and simulated removals of young thinning stands over the rotation period revealed no significant difference between zone- and low-thinned plots. Also, the total incomes from thinnings and clearcutting were not significantly different between the treatments (Fig. 3A). Based on the estimated marginal means, no significant difference was found in the mean stem volume in the first thinning of zone (72.6 ± 3.5 dm3) and low (71.1 ± 5.0 dm3) thinning plots.
| Table 4. Estimated marginal means (EMM) and standard errors (SE) of the harvested and simulated removals on zone- and low-thinned plots in spruce-dominated stands in Central and Eastern Finland. Treatment data marked with different letters are significantly different (p < 0.05) according to the two-way ANOVA with stand and treatment and their interaction as factors and pre-thinning stand volume as covariate (150 m3 ha−1 for Stands 1 and 2, and 300 m3 ha−1 for Stands 3 and 4), and post hoc LSD tests based on EMMs. | |||||||||||||||||||
| Thinning treatment | No. of plots | Harvested removal in zone or low thinning | Simulated removal in the subsequent thinning and clearcutting | Harvested and simulated removal in total | |||||||||||||||
| Sawlog (m3 ha−1) | Pulpwood (m3 ha−1) | Total (m3 ha−1) | Sawlog (m3 ha−1) | Pulpwood (m3 ha−1) | Total (m3 ha−1) | Sawlog (m3 ha−1) | Pulpwood (m3 ha−1) | Total (m3 ha−1) | |||||||||||
| EMM | SE | EMM | SE | EMM | SE | EMM | SE | EMM | SE | EMM | SE | EMM | SE | EMM | SE | EMM | SE | ||
| Stands 1 and 2 in Central Finland | |||||||||||||||||||
| Zone | 6 | --* | -- | 39.7a | 2.2 | 39.7a | 2.2 | 264.4 | 8.4 | 120.9a | 6.1 | 385.3 | 12.4 | 264.4 | 8.4 | 160.6 | 4.6 | 425.0 | 10.2 |
| Low | 3 | --* | -- | 61.4b | 3.2 | 61.4b | 3.2 | 255.2 | 12.2 | 79.6b | 8.8 | 334.8 | 18.0 | 255.2 | 12.2 | 141.0 | 6.6 | 396.2 | 14.7 |
| Stands 3 and 4 in Eastern Finland | |||||||||||||||||||
| Zone | 12 | 70.8 | 5.4 | 90.8a | 4.7 | 161.6 | 6.1 | 238.5 | 11.0 | 99.3a | 3.9 | 337.7 | 10.4 | 309.3 | 9.2 | 190.1 | 5.4 | 499.3 | 5.1 |
| Low | 9 | 50.8 | 6.5 | 108.5b | 5.6 | 159.2 | 7.3 | 265.8 | 13.2 | 79.7b | 4.7 | 345.6 | 12.5 | 316.6 | 11.0 | 188.2 | 6.5 | 504.8 | 6.2 |
| * All wood harvested in the first thinning was classified as pulpwood in Stands 1 and 2. | |||||||||||||||||||
In advanced thinning stands (3 and 4), total removals (harvested and simulated) of the zone- and low-thinned plots were not significantly different (Table 4). No significant differences were found in mean stem volume in the first thinning of zone (295.3 ± 17.4 dm3) and low (254.6 ± 20.8 dm3) thinning plots. The total incomes did not differ between treatments (Fig. 3B).
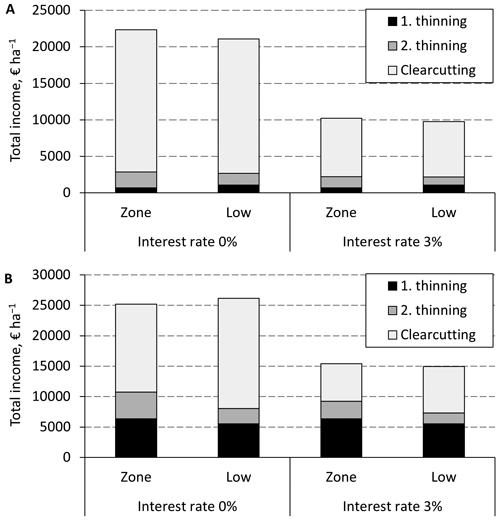
Fig. 3. Estimated marginal means of the total income (€ ha–1) from thinnings and clearcutting in Stands 1 and 2 in Central Finland (A) and in Stands 3 and 4 in Eastern Finland (B). The net present value of incomes, using an interest rate of 0% and 3%, is determined at the time of the first thinning treatment, performed using either zone or low thinning. Treatment had no significant (p > 0.05) effect based on the two-way ANOVA.
4 Discussion
This study described and compared how zone and low thinning influence stand structure and timber removals over time in Norway spruce-dominated stands. Empirical measurements combined with growth simulations were used to evaluate subsequent harvest outcomes. The simulations accounted for the spacing of the remaining trees and strip roads, examining the effects of thinning methods throughout the entire rotation period.
Thinning treatments were implemented in young thinning stands on mineral soil and in advanced thinning stands on drained peatland as their first thinning. These two different stages of stand development and growing sites enabled us to compare the treatments under different conditions. Spruce-dominated stands at medium-fertile sites were selected for this study. Using plot-level data, we were now able to compare the effects of the thinning treatments on post-treatment stand characteristics, as well as on harvested and simulated removals. Follow-up studies will analyse the post-treatment growth, quality and damage at tree level.
The post-thinning growing stock (either stem number or stand basal area and volume, depending on the development stage of the stands) was higher on zone-thinned plots than on low-thinned plots. Geometrical thinning methods such as boom-corridor and zone thinning both typically leave more stems per hectare than low thinning (Nuutinen et al. 2021; Becs et al. 2024). Despite the varying density of the remaining trees, the spatial distribution after zone thinning did not differ greatly from that after low thinning. After the second thinning, the spatial distribution of the trees will be more even once the untreated zones have also been thinned. In young thinning stands, fewer remaining trees were damaged in zone thinning than in low thinning (Uusitalo 2023), whereas the opposite was true in advanced thinning stands; however, the difference was not significant.
At the first thinning stage (Stands 1 and 2), low thinning resulted in significantly higher (55%) removal and income compared to zone thinning. This was consistent with the simulation study by Karhumaa (2021) and the thinning experiments by Ovaskainen et al. (2023). However, when the unharvested zone was excluded, the volume harvested from the operational area of the zone thinning plots did not differ significantly from that of the low thinning plots. This suggests that the volume of timber removal per meter of strip road is similar in zone- and low-thinned stands. On zone-thinned plots, the second simulated thinning yielded a significantly higher income (36%) than on low-thinned plots. Therefore, zone thinning delays part of the removal and income from the first thinning until the next one. Carbon balance (i.e., the difference between the amount of carbon present on-site after and before thinning) is achieved more quickly after moderate thinning intensity than after heavy thinning (Bianchi et al. 2024). Lower thinning intensity has been suggested as a means of mitigating climate change in forest management. Zone thinning would therefore align with this goal.
In advanced thinning stands (3 and 4), removals in the zone and low thinning did not differ significantly. Theoretically, the removal in the operational area of zone thinning was 60% higher than in low thinning. In these peatland stands, the higher removal of zone thinning may be explained by the removing of both larger and smaller trees, which was intended to imitate CCF thinning. Based on measurements and simulations of zone- and low-thinned plots, there were no significant differences in total removals or income during the rotation period. Also, Mäkinen et al. (2006) and Becs et al. (2024) found that geometrical thinning and selective thinning from below resulted in only minor growth differences in Norway spruce stands.
In future studies, particular attention should be given to stand development and the timing of the subsequent thinning to prevent depressed tree growth, wind and snow damage and mortality on untreated zones. In addition, the intensity of subsequent thinning should not exceed the recommended one-third of the stand’s basal area. CCF could be a key focus of peatland forestry in the future, and thus advance regeneration (height < 1.3 m) was also measured on all the plots. Follow-up growth and yield studies, as well as regeneration studies, particularly in peatland stands, are needed to confirm the simulated development of zone-thinned stands and their transition towards uneven-aged forests.
5 Conclusions
The observed post-treatment stand structures, together with projections of subsequent stand development, indicated that zone thinning can be a viable management approach for both young and advanced thinning stands dominated by Norway spruce. Rather than reducing long-term yield potential, zone thinning primarily affects the temporal distribution of removals by retaining a larger share of the growing stock after the first thinning and shifting part of the removal to subsequent thinning. In addition to these stand-level effects, zone thinning may provide practical advantages in harvesting operations and facilitate more diverse stand structures. This is particularly relevant in management systems that aim for CCF. The broader application of zone thinning, however, depends on its acceptance by forest owners, companies and contractors, as well as on a clearer understanding of its economic implications. Specifically, further research is needed to quantify how zone thinning influences harvesting efficiency and profitability under operational conditions.
Authors’ contributions
The authors confirm contribution to the paper as follows:
YN; Conceptualisation, Methodology, conception and study design, Data collection, Funding acquisition, Project administration, Resources, Writing – review & editing.
JM; Methodology, Analysis and interpretation of results, First draft, Writing – review and editing.
TM; Study design, Data collection, Writing – review and editing.
JU; Methodology, conception and study design, Data collection, Writing – review & editing.
HO; Methodology, conception and study design, Data collection, Writing – review & editing.
Declaration of generative AI and AI-assisted technologies in the writing process
During the preparation of this work, the authors used DeepL to improve language. After using this tool, the authors reviewed and edited the content as needed and take full responsibility for the content of this publication.
Funding
This work was supported by the Regional Council of North Karelia, through the project JATKUVA – Multi-objectively targeted implementation of continuous cover forest management (grant number A81140, European Regional Development Fund), and by the Regional Council of Lapland, Finland, and Länsstyrelsen Norrbotten, Sweden and Interreg Aurora, through the project NordicForestry – Planning, management methods and technology for young boreal forests (grant number 20370327, European Regional Development Fund).
Declaration of openness of research materials, data, and code
The data and SPSS syntax are available through the open research repository Zenodo: https://doi.org/10.5281/zenodo.20068293.
Acknowledgements
We would like to thank UPM-Kymmene Oyj and Metsäteho Oy for providing the experiment stands and harvester data for the study. We would also like to thank the contractors, especially Teemu Tiitinen, Metsäkoneurakointi Teemu Tiitinen Oy, for the helpful discussions and for conducting the thinning treatments in Outokumpu, as well as Tapio Ylimartimo and Ville Lumberg at Luke for carrying out the field measurements.
References
Ahtikoski A, Laitila J, Hilli A, Päätalo M-L (2021) Profitability of the first commercial thinning, a simulation study in Northern Finland. Forests 12, article id 1389. https://doi.org/10.3390/f12101389.
Becs A, Kuglerová L, Bergström D, Holmström E, Egnell G (2024) Development of crop trees after different thinning methods in mixed Norway spruce (Picea abies L.) and Birch (Betula spp.) forests in Southern Sweden. For Ecol Manag 566, article id 122055. https://doi.org/10.1016/j.foreco.2024.122055.
Bergström D, Bergsten U, Nordfjell T (2010) Comparison of boom-corridor thinning and thinning from below harvesting methods in young dense Scots pine stands. Silva Fenn 44: 669–679. https://doi.org/10.14214/sf.134.
Bergström D, Fernandez-Lacruz R, de la Fuente T, Höök C, Malinen J, Nuutinen Y, Triplat M, Nordfjell T (2022) Effects of boom-corridor thinning on harvester productivity and residual stand conditions. Int J Forest Eng 33: 226–242. https://doi.org/10.1080/14942119.2022.2058258.
Bianchi S, Ahtikoski A, Muhonen T, Holmström E, Valkonen S, Nuutinen Y (2023) Evaluation of operating cost management models for selection cutting in Scandinavian continuous cover forestry. iForest 16: 218–225. https://doi.org/10.3832/ifor4204-016.
Bianchi S, Huuskonen S, Hynynen J, Niemistö P (2024) Comparing wood production and carbon sequestration after extreme thinnings in boreal Scots pine stands. For Ecol Manag 553, article id 121641. https://doi.org/10.1016/j.foreco.2023.121641.
Cajander AK (1949) Forest types and their significance. Acta For Fenn 56. https://doi.org/10.14214/aff.7396.
Carey AB (2003) Bio-complexity and restoration of biodiversity in temperate coniferous forest: inducing spatial heterogeneity with variable-density thinning. Forestry 76: 127–136. https://doi.org/10.1093/forestry/76.2.127.
Clark PJ, Evans FC (1954) Distance to nearest neighbour as a measure of spatial relationships in populations. Ecology 35: 445–453. https://doi.org/10.2307/1931034.
Heinonen J (1994) KPL – Koealojen puu- ja puustotunnusten laskentaohjelman käyttöohje. [A computer programme package (KPL) for computing stand and single tree characteristics from sample plot measurements. User manual]. Finnish Forest Research Institute, Research Paper 504. https://urn.fi/URN:ISBN:951-40-1369-7.
Huuskonen S, Hynynen J (2006). Timing and intensity of precommercial thinning and their effects on the first commercial thinning in Scots pine stands. Silva Fenn 40: 645–662. https://doi.org/10.14214/sf.320.
IBM Corp. (2024) IBM SPSS Statistics for Windows, Version 30.0. IBM Corp, Armonk, NY.
Kärhä K, Rönkkö E, Gumse S-I (2004) Productivity and cutting costs of thinning harvesters. Int J For Eng 15: 43–56. https://doi.org/10.1080/14942119.2004.10702496.
Karhumaa M (2021) Hakkuun tuottavuus ja korjuujälki vyöhykeharvennusmenetelmässä. [The productivity and quality of harvesting in the zone-thinning method]. Master’s thesis. University of Helsinki, Faculty of Agriculture and Forestry. http://hdl.handle.net/10138/331563.
Kellomäki S (ed) (2024) Forest management for timber production and climate change mitigation: linking Dynamics of Carbon Cycle in Ecosystem Management. Springer, Cham. Managing Forest Ecosystems 44. https://doi.org/10.1007/978-3-031-71575-4.
Korhonen KT, Räty M, Haakana H, Heikkinen J, Hotanen J-P, Kuronen M, Pitkänen J (2024) Forests of Finland 2019–2023 and their development 1921–2023. Silva Fenn 58, article id 24045. https://doi.org/10.14214/sf.24045.
Laasasenaho J (1982) Taper curve and volume functions for pines, spruce and birch. Commun Inst For Fenn 108. https://urn.fi/URN:ISBN:951-40-0589-9.
Laine J, Vasander H, Hotanen J-P, Nousiainen H, Saarinen M, Penttilä T (2018) Suotyypit ja turvekankaat – kasvupaikkaopas. [Peatland types and transformed mires – guide for classification]. Metsäkustannus. ISBN 978-952-338-036-3.
Leppänen V, Torppa K, Rauhala E, Muhonen T, Nuutinen Y (2025) Digital planning of continuous cover forestry logging: airborne LiDAR and spatial analysis approach. Natural Resources and Bioeconomy Studies 76/2025. https://urn.fi/URN:ISBN:978-952-419-111-1.
Luke Statistics (2025) Statistics database, Natural Resources Institute Finland (Luke). http://statdb.luke.fi. Accessed 5 December 2025.
Mäkinen H, Isomäki A (2004) Thinning intensity and growth of Norway spruce stands in Finland. Forestry 77: 349–364. https://doi.org/10.1093/forestry/77.4.349.
Mäkinen H, Isomäki A, Hongisto T (2006) Effect of half-systematic thinning on the increment of Scots pine and Norway spruce in Finland. Forestry 79: 103–121. https://doi.org/10.1093/forestry/cpi061.
Niemistö P, Kilpeläinen H, Poutiainen E (2018) Effect of first thinning type and age on growth, stem quality and financial performance of a Scots pine stand in Finland. Silva Fenn 52, article id 7816. https://doi.org/10.14214/sf.7816.
Nilsson U, Agestam E, Ekö P-M, Elfving B, Fahlvik N, Johansson U, Karlsson K, Lundmark T, Wallentin C (2010) Thinning of Scots pine and Norway spruce monocultures in Sweden: effects of different thinning programmes on stand level gross- and net stem volume production. Studia Forestalia Suecica 219. ISBN 978-91-86197-76-6.
Nuutinen, Y, Saksa T, Saarinen V-M (2020) Harvennustavan vaikutus koneellisen hakkuun tehokkuuteen, harvennuskertymään ja kasvatettavaan puustoon nuorissa metsissä: kirjallisuuskatsaus. [The impact of thinning method on the productivity of harvester work, volume of thinning removal and growing stock in young forests: literature review]. Luonnonvara- ja biotalouden tutkimus 61/2020. http://urn.fi/URN:ISBN:978-952-380-035-9.
Nuutinen Y, Miina J, Saksa T, Bergström D, Routa J (2021) Comparing the characteristics of boom-corridor and selectively thinned stands of Scots pine and birch. Silva Fenn 55, article id 10462. https://doi.org/10.14214/sf.10462.
Ovaskainen H (2009) Timber harvester operators’ working technique in first thinning and the importance of cognitive abilities on work productivity. Diss For 79. https://doi.org/10.14214/df.79.
Ovaskainen H, Poikela A, Härmä T, Uusitalo T (2024) Puunkorjuun tuottavuus, puuston tila ja korjuujälki vyöhykeharvennusmenetelmässä. [The productivity and quality of harvesting and the state of the growing stock in the zone-thinning method]. Metsätehon tuloskalvosarja 4/2024. https://www.metsateho.fi/wp-content/uploads/Vyohykeharvennus_tuloskalvosarja-v2.pdf. Accessed 5 December 2025.
Palander T, Ovaskainen H, Tikkanen L (2012) An adaptive work study method for identifying the human factors that influence the performance of a human–machine system. For Sci 58: 377–389. https://doi.org/10.5849/forsci.11-013.
Pukkala T, Miina J, Kurttila M, Kolström T (1998) A spatial yield model for optimizing the thinning regime of mixed stands of Pinus sylvestris and Picea abies. Scand J For Res 13: 31–42. https://doi.org/10.1080/02827589809382959.
Rautio P, Routa J, Huuskonen S, Holmström E, Cedergren J, Kuehne C (2025) Continuous cover forestry in boreal Nordic countries. Springer, Cham. Managing Forest Ecosystems 45. https://doi.org/10.1007/978-3-031-70484-0.
R Core Team (2025) R: a language and environment for statistical computing. R Foundation for Statistical Computing, Vienna, Austria. https://www.R-project.org/. Accessed 5 December 2025.
Skogforsk (2025) StanForD 2010 – standard for forest machine data and communication. Skogforsk, Sweden. http://www.skogforsk.se/english/projects/stanford/. Accessed 21 November 2025.
Tapio (2025) Best practices for sustainable forest management in Finland. https://metsanhoidonsuositukset.fi/en. Accessed 21 November 2025.
Uusitalo T (2023) Vyöhykeharvennuksen korjuujälki. [Logging footprint of zone thinning]. Bachelor’s thesis. Tampere University of Applied Sciences, Degree Programme in Forestry.
https://urn.fi/URN:NBN:fi:amk-2023121136085.
Venäläinen A, Lehtonen I, Laapas M, Ruosteenoja K, Tikkanen O-P, Viiri H, Ikonen V-P, Peltola H (2020) Climate change induces multiple risks to boreal forests and forestry in Finland: a literature review. Glob Change Biol 26: 4178–4196. https://doi.org/10.1111/gcb.15183.
Total of 36 references.
