Liam Donnelly  ,
Sven-Olof Lundqvist,
Conor O’Reilly
,
Sven-Olof Lundqvist,
Conor O’Reilly
Inter- and intra-annual wood property variation in juvenile wood between six Sitka spruce clones
Donnelly L., Lundqvist S.-O., O’Reilly C. (2017). Inter- and intra-annual wood property variation in juvenile wood between six Sitka spruce clones. Silva Fennica vol. 51 no. 4 article id 7728. https://doi.org/10.14214/sf.7728
Highlights
- Wood property differences resulted primarily from variation in the proportions of early- and latewood in each annual ring
- Width of early- and latewood bands in each ring was found to be a more important determinant of juvenile wood quality than the characteristics of the cells within each band
- Wood properties differed greatly between clones, suggesting that there is potential to improve juvenile wood properties through selective breeding.
Abstract
Increased growth rates have reduced rotation lengths, increasing the proportion of juvenile wood relative to mature wood, which may negatively affect mechanical performance of sawn timber. However, there is limited information available on the potential impact of breeding for vigour on juvenile wood in Sitka spruce (Picea sitchensis (Bong.) Carrière). In this study, the relationship between vigour (based on total height) and wood properties was investigated in six-year-old Sitka spruce clones grown in two replicated field trials in Ireland. Six clones were evaluated, two clones from each of three vigour (high, intermediate and low) classes. Discs were cut from the base of one ramet per replication for each clone to assess wood quality attributes. Radial tracheid width was significantly and positively correlated with ring width and height, and was negatively correlated with density. The wood of the most vigorous clone had significantly larger ring width with thinner cell walls and wider tracheids than all clones in the two other vigour classes, resulting in lower mean wood density. Latewood properties for all wood attributes measured differed significantly between the two sites. Wood property differences resulted primarily from variation in the proportions of early- and latewood in each annual ring. Additionally, the width of early- and latewood bands in each ring was found to be a more important determinant of juvenile wood quality than the characteristics of the cells within each band. Wood properties differed greatly between clones, suggesting that there is potential to improve juvenile wood properties through selective breeding.
Keywords
productivity;
wood properties;
Picea sitchensis;
clonal forestry;
selective breeding;
stem height
-
Donnelly,
UCD Forestry, University College Dublin, Belfield, Dublin 4, Ireland
E-mail
liam.donnelly@ucdconnect.ie
- Lundqvist, Innventia Ab, Drottning Kristinas väg 61, SE-114 86 Stockholm, Sweden E-mail svenolof.lundqvist@innventia.com
- O’Reilly, UCD Forestry, University College Dublin, Belfield, Dublin 4, Ireland E-mail conor.oreilly@ucd.ie
Received 13 May 2017 Accepted 6 July 2017 Published 19 July 2017
Views 91259
Available at https://doi.org/10.14214/sf.7728 | Download PDF

1 Introduction
Sitka spruce (Picea sitchensis (Bong.) Carrière) is the dominant forestry species in Ireland accounting for approximately 52.4% of forested land or 334 560 hectares (Forest Service 2012). A Sitka spruce improvement programme was initiated in Ireland in the early 1970’s to improve the productivity of this species (Thompson 2013). The objective of any tree improvement programme is to exploit genetic variability within a population to improve traits of economic value by maximising genetic gains over a short time period. However, the combination of faster growth rates of elite material, economic factors and constraints on rotation length have increased the relative proportion of juvenile wood (first nine annual rings) harvested from forest plantations, which may negatively influence wood properties (Mitchell and Denne 1997).
Juvenile wood varies between genotypes, indicating the potential to select for wood property traits at an early age (Lee et al. 2002; Lenz et al. 2013). Furthermore, important wood properties, such as wood density and tracheid morphology, show moderate to high degree of inheritance (Zobel and van Buijtenen 1989). Zobel and Sprague (2012) suggested that the presence of juvenile wood is a critical determinant in the quality of solid wood products. However, if selection of trees with juvenile wood characteristics more similar to mature wood is possible, e.g. lower microfibril angle (MFA) and higher density, as well as an earlier transition from juvenile to mature wood, then rotation length could be reduced with less adverse effects on wood quality (Zobel and Van Buijtenen 1989).
Traditionally, wood density has been the main attribute assessed due to its influence on most wood properties and ease of measurement (Apiolaza 2009). For construction uses, wood stiffness (modulus of elasticity; MOE) is of major importance and it is related not only to wood density, but also to MFA. Therefore, wood density alone is not a reliable indicator of MOE so additional wood properties need to be assessed (McLean 2008). Furthermore, focusing too much on selecting for one trait may restrict the ability to select for other traits in the future by narrowing the genetic base in the breeding population (Wu et al. 2008). The inclusion of tracheid properties, such as tracheid wall thickness and radial tracheid width, into a breeding strategy may enable breeders to consider other potential end-uses of timber rather than structural products alone.
To date, Sitka spruce improvement has focused mainly on selection for vigour with only cursory attention being paid to wood properties. To increase timber utilisation for a broad range of products, the annual variation of mechanical and physical properties must be determined as increased timber yields alone may not meet industry’s needs (Zobel and Van Buijtenen 1989). To assess internal wood properties, indirect screening methods are used. These methods are restricted by their penetrative depth, typically limited to the outer few millimetres (e.g. pilodyn) or centimetres (e.g. acoustic wave) of the stem. Therefore, direct measurement methods provide more accurate results, particularly when assessing trees that contain high proportions of juvenile wood (McLean 2008). However, direct methods may be more costly to carry out as large numbers of trees must be screened. Clonal material has less genetic variation than seedling material, therefore reducing the number of trees needed to be screened, while increasing breeding efficiencies and decreasing screening costs (Park 2002).
Typically wood properties of Sitka spruce have been assessed in older material (Lee 1999; Livingston et al. 2004; Moore et al. 2008; Moore et al. 2009; Treacy et al. 2000), but to the authors’ knowledge little information is available on intra- and inter-annual variation in the juvenile wood of Sitka spruce clones. Juvenile wood is becoming an increasingly important component in harvested wood; acquiring such information is critical when developing new clonal varieties for deployment. Therefore, it is important that research efforts be directed towards improving the quality of juvenile wood, regardless of the link with mature wood. Additionally, it is essential to determine how selecting highly vigorous trees affects wood properties.
In the above context, the objectives of this study were to: (1) provide baseline information on intra- and inter-annual variation in juvenile wood properties; and (2) assess juvenile wood property variation between Sitka spruce clones displaying significant variation in stem height growth rates.
2 Materials and methods
2.1 Field material
Clonal field trials were established at Kilmacurra (KMC), Co. Wicklow (52°56´N, 06°10´W; 133 m elevation) and Cappoquin (CQN), Co. Waterford (52°08´N, 07°54´W; 24 m elevation), Ireland in spring 2010. Long-term meteorological data (1981 to 2010) showed that mean annual temperature and annual precipitation were 9.9 °C and 1981 mm for KMC and 10.2 °C and 1711 mm for CQN, respectively (Met Eireann, Ireland). The 30-year mean values showed that October is the wettest month at both KMC and CQN with 118 and 161 mm of rain, respectively. During the same period temperatures reached a mean daily maximum for both KMC and CQN in July of 15.7 °C and 16.8 °C, respectively.
All trees used were emblings derived from genetically improved full-sib crosses used in the Irish tree improvement programme and were propagated as described by Thompson (2013). The two-year old containerised ramets of the same 57 clones were manually planted at both sites, but three additional clones were planted at CQN.
Both experiments were established on high productivity sites; KMC has a sandy loam soil and was previously used as a nursery, while CQN has a brown podzolic soil and had previously been used as pasture. The trials were established as randomised (complete) block designs with four replicates per site. Square plots were planted with the emblings at 1 × 1.5 m spacing in KMC and line plots were planted at 2 × 2 m spacing in CQN. The sites were fenced to exclude rabbits. Each plot had four measurement trees.
2.2 Clonal selection
The height of all ramets at both sites was measured in 2013 and 2015. Clones were assigned to one of three vigour (high, intermediate and low) classes based on their mean height (pooled across both sites) in January 2015. Two clones from each vigour class were randomly selected for wood property analysis in this study. In total four ramets, one from each block for each clone and site, were destructively harvested in January 2015 (2 × 3 × 2 × 4 = 48 ramets in total). To facilitate presentation, the clones were numbered 1 to 6 (i.e. tallest to shortest), based on their height measurements in January 2015.
2.3 Sampling observations and measurements
2.3.1 Leader growth and needle characteristics
In January 2015, the previous year’s leader growth (2014), mean needle density of 2014 leader (i.e. needle number per unit length of leader) and specific leaf area (SLA, cm2 g–1) were measured for all ramets of the six selected clones. Needle density was determined by counting the number of needles from the proximal (needle-bearing part, above the 2013 bud scars) and distal 5 cm (excluding the bud) of the 2014 leader. SLA was measured by removing one north-orientated branch from the uppermost distal whorl of each clone. Needles were removed from a 5 cm mid-section of the branch and their area was measured using a Li-Cor 3000 leaf area meter (Li-Cor, Lincoln, NE, USA) and then weighed (Adam Equipment model PW 124, Adam Equipment, South Africa).
2.3.2 Sampling and sample preparation
Discs were cut at approximately 15 cm above ground level from four ramets of each clone at both KMC and CQN in January 2015. The northern orientation was marked on the bark of each disc prior to cutting. Once discs were cut they were brought immediately to University College Dublin, Ireland. Discs were stored at –20 °C to prevent drying and/or mould growth until mid-February 2015 when they were dispatched to Innventia AB research Institute, Stockholm, Sweden where the wood property attributes were assessed using SilviScan (Evans 1994, 2006). These measurements were performed on 2 mm thick sample strips extending from pith to bark.
To reduce formation of cracks on drying, each disc was cut radially, from bark to pith using a circular saw, in the direction from the northern side of the disc, after which the disc was dried at room temperature (Lundqvist et al. 2007). Following this, a high-precision twin-bladed saw was used to produce the radial strips for analysis with Silviscan; the strip measured 2 mm in thickness (transverse tangential direction) and 7 mm in height (longitudinal direction). The upper sides of the strips were then polished to allow imaging of the tracheid cross-sections. The samples were soaked in acetone for 5 h to remove extractives from the wood. Subsequently, the samples were air-dried in a controlled atmosphere of 23 °C and 43% relative humidity (RH) to a moisture content of about 8%, after which the length, width, height and weight of each sample was measured and the gravimetric average wood density was calculated.
2.4 Tracheid and wood property measurements
SilviScan makes use of three different measurement principles: image analysis of cell cross-sections, X-ray transmission for density and X-ray diffraction for orientations in wood (Evans 1994). These are applied by scanning the sample strip from pith to bark on three separate measurement instruments, coordinated via a server. First, cross-sectional images of tracheids were scanned with a video microscope and the radial and tangential tracheid widths were determined, expressed as averages for consecutive radial intervals of 25 μm. From these images, the fibre width in radial direction was measured for all cells contained within the sample strip for each annual ring. The radial dimensions of all cells in each annual ring were also determined, after which the samples were scanned on the two X-ray units. The information about the ring angles was then used to rotate the sample, to align the latewood band of each ring in parallel to the X-ray beam, thus making it possible to obtain the most precise information about ring interfaces and within-ring variations in cell properties.
Wood density was measured using X-ray transmission with the same radial resolution as above. Ring widths and density were used to estimate tracheid cell wall thickness (Scallan and Green 1974). Density variations were used to identify interfaces between annual rings, as well as proportions of early-, transition-, and latewood using a relative method (Lundqvist et al. 2007). Traditionally, the annual ring has been divided into the two parts, earlywood and latewood (Mork 1928). The wide-diameter, thin-walled earlywood tracheids are produced during the spring and summer and the narrow-diameter, thicker-walled tracheids are produced in the late summer and autumn, but there is often a transition zone between these two bands containing tracheids that have intermediate characteristics. In this study, each ring was divided into three wood types: earlywood (EW), transitionwood (TW) and latewood (LW). EW was defined in this study as the part within an annual ring where wood density was < 20% of the range from minimum to maximum density. LW was defined as wood with density > 80% of the range, while TW was classified as everything between these two extremes (Lundqvist et al. 2007).
Microfibril angle (MFA) was measured using a focused X-ray beam which interacted with the wood samples (Evans 1999). The resulting diffraction patterns obtained from the reflections from the 002 planes of cellulose allowed radial variation of MFA to be estimated at a resolution of 0.2 mm (Fig. 5; Lundqvist et al. 2007). Wood stiffness (MOE) was derived from wood density and diffractogram information, following the method described by Evans (2006). Ring-level averages were calculated for wood density and tracheid properties: coarseness (mass per unit length), cell wall thickness, radial tracheid widths and MFA, as well as the average measurement for each band (EW, TW and LW) within each annual ring.
The outermost ring along the radius was excluded from the analysis as it is sometimes incomplete or damaged during sampling. Furthermore, the image analysis routines used to measure radial tracheid width are based on the assumption that tracheids are rectangular and approximately organised in parallel cell files. This is generally a sound approximation, except for cells closest to the pith. The thin LW bands in these sections are highly curved, meaning that it is not possible to record LW data. For these reasons, the central 2 mm radial portion of each disc was excluded (annual rings 1 and 2). Therefore, only annual rings 3 to 5 were included in the analysis, with most attention focused on the wood in ring 4.
2.5 Data analysis
A repeated measures ANOVA was used to test the effect of time (annual ring; cambial age) and differences between sites, clones and site × clone effects on wood properties.
The following model (1) was then used to estimate the variation in traits of interest:
![]()
where Yijk is mean value of a particular component of ith clone, jth block and kth site, μ is overall mean, αi is ith clone, β is jth block, γ is kth site and eijk is error.
The analysis was repeated separately for each ring (rings 3–5). No significant site effects were observed for EW and TW, therefore data for the two sites were pooled. However, some significant site effects were observed for LW, so these are presented separately. When clones differed significantly, Student–Newman–Keuls (SNK) post-hoc tests were used to determine which means were significantly different at P ≤ 0.05. All data was analysed using SAS 9.3 (SAS, SAS Institute Inc., Cary, NC, USA).
Relationship between MFA and MOE was tested using polynomial regression, while relationships between ring width, stem height and radial tracheid width were tested using linear regressions.
3 Results
3.1 Stem height, diameter and needle traits
Ramets of clone 1 had significantly greater stem height than all other clones in January 2015, while ramets of clone 2 also differed significantly with several other clones in stem height (Table 1). The ramets of these two clones also had significantly greater diameters than those of all other clones on the same date. No significant differences between the ramets of the four clones which comprised the lower productivity classes in either height or diameter were observed in January 2015. Clonal ranking remained unchanged from 2013 to 2015, with the ramets of clone 1 having significantly greater leader growth in 2014 than all other clones. The ramets of clone 2 also had significantly greater leader growth than ramets of clones 3 and 5 (Table 1). The ramets of clone 1 had significantly lower needle density than clone 2, 3 and 5. Additionally, SLA differed significantly between clone 3 and 4, with the ramets of clone 4 having approximately one third greater specific leaf area than clone 3.
| Table 1. Stem height and diameter at base (0.1 cm sampling height) (January 2015), leader length (2014), mean needle density (* per 5 cm mid-section of branch) in 2014 leader, and SLA (specific leaf area) for 2014 for all assessed clones. Values shown are means ± 1 S.E pooled across the two sites. Means sharing the same letter did not differ significantly (P ≤ 0.05). n = 8. | |||||
| Clone | Height (m) | Diameter (mm) | Leader length ʼ14 (cm) | Needle density * | SLA (cm2 g−1) |
| 1 | 2.32 ± 0.1a | 1 42.4 ± 5a | 87 ± 4.11a | 64 ± 4.05b | 7.50 ± 0.39ab |
| 2 | 1.99 ± 0.1b | 41.8 ± 5a | 68 ± 8.18b | 85 ± 5.32a | 7.86 ± 0.31ab |
| 3 | 1.77 ± 0.1bc | 34.9 ± 5b | 50 ± 3.00c | 86 ± 6.19a | 6.86 ± 0.46b |
| 4 | 1.69 ± 0.1c | 32.8 ± 5b | 56 ± 2.27bc | 76 ± 3.69ab | 9.06 ± 0.50a |
| 5 | 1.56 ± 0.2c | 33.1 ± 4b | 42 ± 4.89c | 86 ± 5.87a | 8.27 ± 0.43ab |
| 6 | 1.53 ± 0.1c | 32.6 ± 5b | 56 ± 7.63bc | 71 ± 4.75ab | 7.84 ± 0.27ab |
3.2 Wood Properties
3.2.1 Clonal variation in ring composition
For the reasons described above, the analysis focused on rings 3–5 from pith to bark. In these rings, significant differences were found between clones in mean annual ring width and the width of the different wood types (early-, transition- and latewood). However, differences in TW were only observed for ring 3. The width of ring 3 was significantly greater in ramets of clones 1 and 2 than those of clone 5.
The largest differences in EW growth characteristics occurred in ring 4, where approximately 35% of the mean annual width in the ramets of clone 1 was composed of EW and its width was significantly greater than in all other clones (Table 2; Fig. 1). The two fastest growing clones had the highest proportion of EW. Mean TW for the ramets of all clones ranged from 51 to 68% of the annual ring width in ring 4. Significant differences in LW production were also found between clone 1 and clone 3 in ring 4, with the ramets of the latter clone producing approximately 2.6 time more LW then clone 1. Mean ring width was significantly greater in the ramets of clone 1 than those of clone 4, 5 and 6 in rings 4 and 5.
| Table 2. ANOVA summary for sources of variation and significance of P-values for mean ring width, ring density, mean radial tracheid width and cell wall thickness with each of their corresponding values for early, transition, and late wood respectively in ring 4. NS = > 0.05, * = < 0.05 and ** = < 0.01. | ||
| P-value | ||
| Source of variation | Site (S) | Clone (C) |
| Mean ring width | NS | ** |
| 1. Earlywood ring width | NS | ** |
| 2. Transitionwood ring width | NS | NS |
| 3. Latewood ring width | NS | * |
| Mean density | NS | ** |
| 1. Earlywood density | NS | ** |
| 2. Transitionwood density | NS | NS |
| 3. Latewood density | * | NS |
| Mean radial tracheid width | NS | ** |
| 1. Earlywood radial tracheid width | NS | ** |
| 2. Transitionwood radial tracheid width | NS | * |
| 3. Latewood radial tracheid width | ** | * |
| Mean cell wall thickness | NS | ** |
| 1. Earlywood cell wall thickness | NS | * |
| 2. Transitionwood cell wall thickness | NS | NS |
| 3. Latewood cell wall thickness | ** | NS |
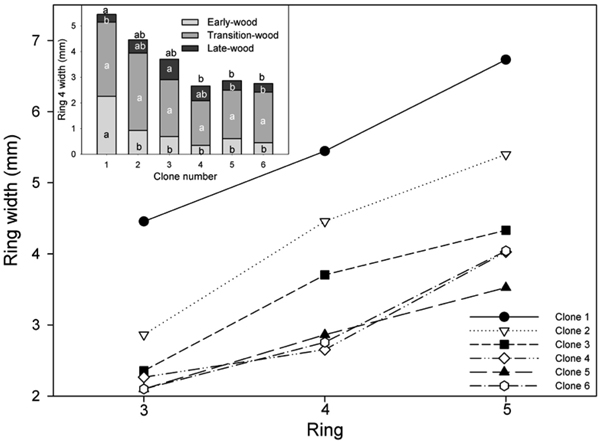
Fig. 1. Mean ring width for all clones for annual rings 3–5 and (inset) width of EW, TW and LW in ring 4. Values shown are means pooled across the two sites (site effects not significant). Means sharing the same letter did not differ significantly (P ≤ 0.05). Letters above each bar denote significant differences in mean ring width pooled across the three wood types (P ≤ 0.05). n = 8.
3.2.2 Clonal variation in wood density
Mean annual wood density was highest in ring 3, ranging from 597 to 762 kg m–3 for all clones (Fig. 2). Wood density decreased in ring 4 by up to 23% in comparison with ring 3. Mean wood density in ring 4 ranged from 539 to 679 kg m–3 (Fig. 2, inset).
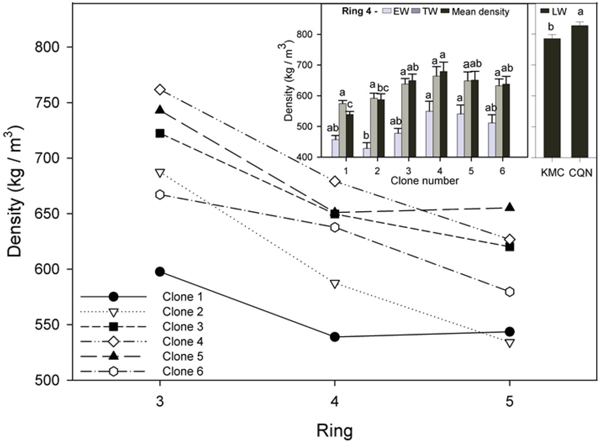
Fig. 2. Mean density for all clones for annual rings 3–5 and (inset) EW, TW, and mean density for all clones in ring 4. Values shown are means ± 1 S.E pooled across the two sites for EW and TW (site effects not significant). Values for LW varied by site and are shown separately. Means sharing the same letter did not differ significantly (P ≤ 0.05). n = 8.
In ring 4, LW density varied little between clones, ranging from 778 kg m–3 to 829 kg m–3. EW densities were between 33 to 45% less dense than the LW. The ramets of clone 2 had significantly lower EW density than clone 4 and 5 and significantly lower mean density than those of clone 4. The ramets of clone 1 had significantly lower mean wood density than those of all other (less vigorous) clones. Ramets had significantly denser LW in CQN (827.7 kg m–3) than in KMC (785.3 kg m–3).
In ring 5, wood density decreased by approximately 10% for most clones in comparison to ring 4, but small non-significant increases were observed in ramets of clones 1 and 5. The ramets of clones 4 and 5 had significantly denser EW and TW than those of clone 2 in ring 5. Additionally, ramets of clone 5 had significantly higher mean wood density than those of clone 1.
3.2.3 Clonal variation in tracheid diameter and tracheid wall thickness
Radial tracheid width increased from ring 3 to 4 in most clones, and also from ring 4 to 5, but to a lesser degree, but there was a slight decrease in clone 1 (Fig. 3). Significant differences in EW, TW and mean radial tracheid width were recorded in ring 4 (Fig. 3, inset). The ramets of clone 1 had significantly wider mean radial tracheid width than those of clone 3, 4, 5 and 6 in ring 4. These narrower tracheid widths occurred primarily in EW and TW where tracheid diameters were approximately 10% narrower than in clone 1 and 2. Tracheid widths were significantly wider in ramets grown in CQN (20.7 µm) than KMC (19.2 µm).
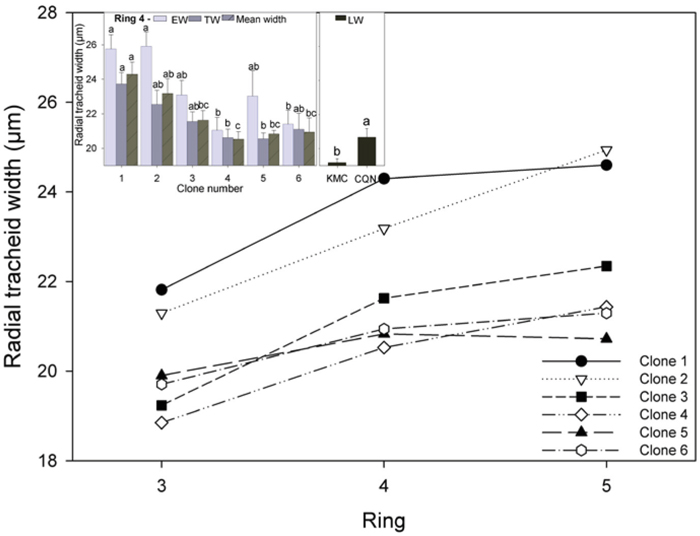
Fig. 3. Mean radial tracheid width for all clones for rings 3–5 and (inset) EW, TW, and mean radial tracheid width in ring 4. Values shown are means ± 1 S.E pooled across the two sites for EW and TW (site effects not significant). Values for LW varied by site and are shown separately. Means sharing the same letter did not differ significantly (P ≤ 0.05). n = 8.
Mean tracheid cell wall thickness varied between wood types and across the annual rings. The largest and most significant differences occurred between clones in EW. Tracheid wall width was thinnest in the EW, ranging from approximately 1.6 µm to 3.5 µm, while in LW tracheids walls ranged from 2.5 to 4.7 µm. Tracheid wall thickness decreased from ring 3 to 5 for all clones, but it slightly increased from ring 4 to 5 in the ramets of the two tallest clones (Fig. 4). In ring 4, the production of thinner tracheid cell walls in the EW in the ramets of clone 1 resulted in this clone having significantly thinner mean tracheid cell walls than those of clones 3, 4, 5 and 6 (Fig. 4, inset). Tracheid wall thickness was up to 80% thicker in the LW than the EW. Ramets had significantly thicker tracheid cell walls in the LW in CQN (2.86 µm) than in KMC (2.71 µm).
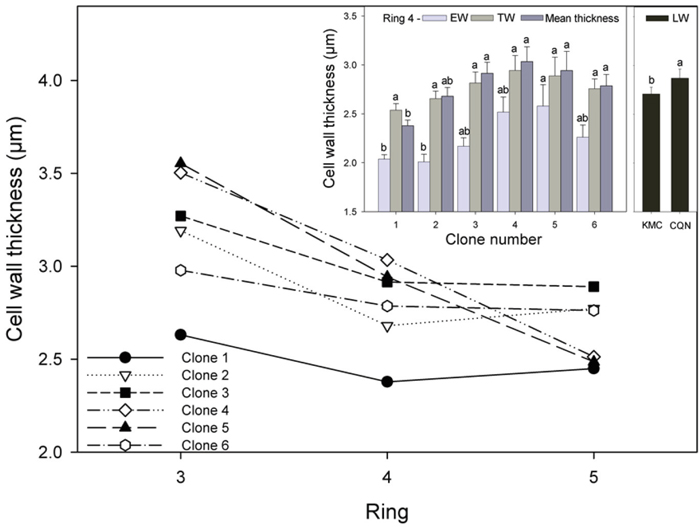
Fig. 4. Mean cell wall thickness for all clones for rings 3–5 and (inset) EW, TW, and mean cell wall thickness for all clones in ring 4. Values shown are means ± 1 S.E pooled across the two sites for EW and TW (site effects not significant). Values for LW varied by site and are shown separately. Means sharing the same letter did not differ significantly (P ≤ 0.05). n = 8.
3.2.4 Relationships between measured wood traits
A highly significant positive polynomial relationship was observed between MFA and MOE (Fig. 5). Highly significant positive relationships were also found between ring width and radial tracheid width (Fig. 6a) and between tree height and radial tracheid width (Fig. 6b). The relationships between MFA and wood density (R2 = 0.33) and MOE and stem height (R2 = –0.22) were weak. No significant differences were observed between clones in either MFA or MOE.
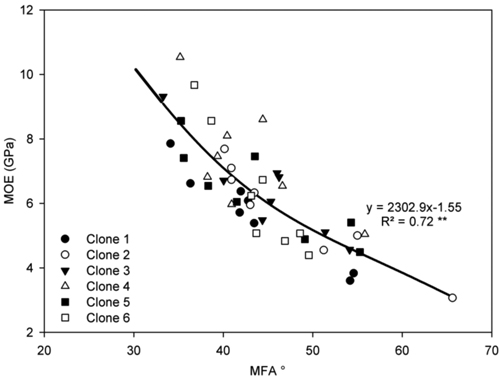
Fig. 5. Relationship between MFA and MOE in ring 4 for all ramets of each clone on both sites. Curve represent a polynomial regression. **P < 0.001. n = 48.
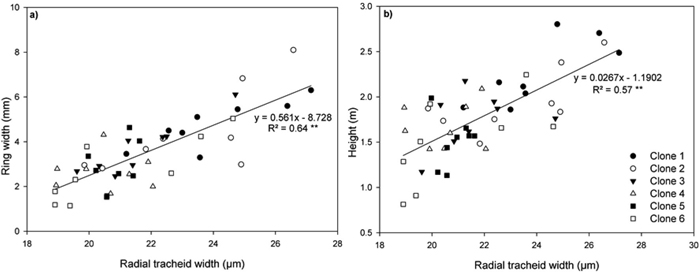
Fig. 6. Relationship between (a) ring width and radial tracheid width and (b) height and radial tracheid width in ring 4 for all clones on both sites. Each line represent linear regressions through all data points. Symbols represent each individual clone. **P < 0.001. n = 48. View larger in new window/tab.
4 Discussion
4.1 Clonal variation in growth rates and wood density
A selection of improved clones differing in stem height growth rates were chosen to determine the potential impact of vigour on juvenile wood properties in clonal material of Sitka spruce. Wood density is, to a major extent, a function of the cross-sectional dimensions of its cells. It increases as radial tracheid width declines and tracheid wall thickness increases and as the proportion of LW increases. Significant differences in intra-annual density between the most vigorous and least vigorous clones were mostly due to the larger width of low-density EW band and the narrower width of high-density LW band in each ring. This growth pattern may be undesirable, depending on the wood’s intended end use, as there is evidence that timber containing a high proportion of EW has lower mechanical strength properties, which would result in lower quality, less valuable timber (Saranpää 2009).
Clone 4, in the medium vigour class, had the highest mean density, indicating that it may be possible to improve both growth and quality by excluding the most vigorous clones. Fast-growing families had significantly less LW than slower growing families and unimproved control trees in previous studies of Sitka spruce (Cameron et al. 2005; Livingston et al. 2004). Including wood quality traits in breeding programmes requires estimates of genetic variance and covariance. Although wood density is a composition of several traits, high heritability estimates have been observed in several conifer species for tracheid wall diameter and radial width (Rozenberg and Cahalan 1997; Zobel and Jett 1995). Heritability estimates for LW density and its proportion in 10-year-old Norway spruce trees were higher than for overall density (Hylen 1997). Additionally, very high heritability estimates have been reported for mean density in juvenile wood of Norway spruce (0.85) and Sitka spruce (0.96) in rings 6 and 9, respectively (Hylen 1997; Lee et al. 2002). Similarly, EW density has been found to be under strong genetic control in Pinus pinaster (Gaspar et al. 2008).
The results of the studies cited above indicate that wood quality traits are under strong genetic control. Therefore, consideration should be given to including several wood quality traits, such as proportion of EW and LW, as selection criteria rather than focusing on mean density alone as a way of improving wood quality in Sitka spruce. However, selecting for increased density without a corresponding increase in the mechanical properties of timber, by including e.g. MFA, may be of limited benefit (Donaldson et al. 1995).
4.2 Tracheid properties
Reports of the relationships between annual ring width and tracheid dimensions have been conflicting in Norway spruce (Bergqvist et al. 2000; Brix and Mitchell 1980; Denne 1973). Radial tracheid width was significantly and positively correlated with ring width (Fig 6a) and stem height (Fig. 6b), indicating that increased diameter and height growth may result in wider tracheid diameters.
The fastest growing clones had significantly larger tracheid width (Fig. 3) and thinner tracheid cell walls (Fig. 4) than all clones in the other growth classes. These results are in agreement with previous studies of Norway spruce, which found that faster stem growth was associated with a decrease in mean fibre length and cell wall thickness but increased mean fibre diameter (Mäkinen et al. 2002). In contrast, Denne (1973) found no difference in cell wall thickness between Sitka spruce trees which differed in vigour. Increased vigour is associated with increased MFA in juvenile wood, previous studies (e.g. Cameron et al. 2005) have observed that faster growing Sitka spruce progeny had higher MFA in their juvenile wood. Although clones differed in stem growth, no significant difference in MFA were observed between clones in agreement with Park et al. (2012).
The presence of significant site effects for LW tracheid properties might complicate testing and selection of trees for inclusion in an improvement programme and it is likely that predicted genetic gains might be less accurate due to the presence of significant site effects. Clones are more sensitive to different environmental conditions than seed material as there is less variation due to genetic effects and can therefore be useful for evaluating genotypic stability. To increase the accuracy of clonal performance, site conditions also need to be considered in a breeding programme and clonal trials should be established on a wide range of representative sites to determine the magnitude of site effects on LW characteristics. Thus, the optimal selection criteria for clones for wide scale planting would be to select clones with high growth rates with no decrease in wood quality and are stable across a range of environmental and edaphic conditions. However, only six clones were included in this study so genetic differences may be over-estimated while the variance may be under-estimated, especially in comparison to material derived from seed (i.e. families). Therefore, these results are only applicable to juvenile Sitka spruce clonal material and may not represent the full range of Sitka spruce clones available; rather they only indicate the potential to improve wood quality based on the presence of genetic variation in tracheid properties.
5 Conclusions
The larger proportion of juvenile wood in improved material presents tree breeders with the challenge of maintaining wood quality while increasing productivity. Lower wood density in faster growing clones was associated with increased radial tracheid width and decreased cell wall thickness. These differences were primarily due to greater differences in the proportions of EW than LW. Therefore, selecting for higher earlywood and latewood density and a lower proportion of earlywood with more latewood, rather than mean density, could be an effective method of improving juvenile wood density in Sitka spruce. However, the presence of significant site effects could complicate testing and selection of clones with desirable wood properties. Although undesirable genetic relationships between tracheid properties and vigour were found, the large range of values observed and the high degree of heritability for most wood properties, indicates the potential to improve wood quality through selective breeding of specific clones.
Acknowledgements
This study has been supported in part by a research grant from Department of Agriculture, Food and the Marine, Ireland (grant no. FORGEN 10/RD/717) and Trees4Future (grant no. 284181). Coillte Teoranta kindly provided the experimental site and all plant material. Thanks to David Thompson, Stuart Kennedy and Olga M. Grant for suggestions. Thanks to Lars Olsson, Innventia, Sweden for conducting laboratory measurements and advising on sampling protocols. Additional, thanks to Vasiliki Balogianni and staff at Kilmacurra for assistance in fieldwork.
References
Apiolaza L.A. (2009). Very early selection for solid wood quality: screening for early winners. Annals of Forest Science 66(6): 601. https://doi.org/10.1051/forest/2009047.
Barnett J.R., Bonham V.A. (2004). Cellulose microfibril angle in the cell wall of wood fibres. Bioogical Reiews 79(2): 461–472. https://doi.org/10.1017/s1464793103006377.
Brix H., Mitchell A.K. (1980). Effects of thinning and nitrogen fertilization on xylem development in Douglas-fir. Canadian Journal of Forest Research 10(2): 121–128. https://doi.org/10.1139/x80-023.
Cameron A.D., Lee S.J., Livingston A.K., Petty J.A. (2005). Influence of selective breeding on the development of juvenile wood in Sitka spruce. Canadian Journal of Forest Research 35(12): 2951–2960. https://doi.org/10.1139/x05-219.
Denne M.P. (1973). Tracheid dimensions in relation to shoot vigour in Picea. Forestry 46(2): 117–124. https://doi.org/10.1093/forestry/46.2.117.
Donaldson L.A. R.D. Burdon. (1995). Clonal variation and repeatability of microfibril angle in Pinus radiata. New Zealand Journal of Forestry Science 25(2): 164–174.
Evans R. (1994). Rapid measurement of the transverse dimensions of tracheids in radial wood sections from Pinus radiata. Holzforschung 48(2): 168–172. https://doi.org/10.1515/hfsg.1994.48.2.168.
Evans R. (1999). A variance approach to the x-ray diffractometric estimation of microfibril angle in wood. Appita 52(4): 283–289.
Evans R. (2006). Wood stiffness by X-ray diffractometry. In: Stokke D.D., Groom L.H. (eds.). Characterization of the cellulosic cell wall. p. 138–146.
Forest Service (2007). National Forest Inventory Republic of Ireland – results. Department of Agriculture Fisheries and Food, Johnstown Castle Estate, Wexford, Ireland.
Gaspar M.J., Louzada J.L.P.C., Silva M.E., Aguiar A., Almeida M.H. (2008). Age trends in genetic parameters of wood density components in 46 half-sibling families of Pinus pinaster. Canadian Journal of Forest Research 38(6): 1470–1477. https://doi.org/10.1139/X08-013.
Hylen G. (1997). Genetic variation of wood density and its relationship with growth traits in young Norway spruce. Silvae Genetica 46(1): 55.
Lee S.J. (1999). Improving the timber quality of Sitka spruce through selection and breeding. Forestry 72(2): 123–146. https://doi.org/10.1093/forestry/72.2.123.
Lee S.J., Woolliams J., Samuel C.J.A., Malcolm D.C. (2002). A study of population variation and inheritance in Sitka spruce. Silvae Genetica 51(2–3): 55–64.
Lenz P., Auty D., Achim A., Beaulieu J., Mackay J. (2013). Genetic improvement of White spruce mechanical wood traits – early screening by means of acoustic velocity. Forests 4(3): 575–594. https://doi.org/10.3390/f4030575.
Livingston A.K., Cameron A.D., Petty J.A., Lee S.L. (2004). Effect of growth rate on wood properties of genetically improved Sitka spruce. Forestry 77(4): 325–334. https://doi.org/10.1093/forestry/77.4.325.
Lundqvist S.O., Hansson Å., Olsson L. (2007). SilviScan measurements on maritime pine. STFI-Packforsk, report no. 326.
Mäkinen H., Saranpää P., Linder S. (2002). Effect of growth rate on fibre characteristics in Norway spruce (Picea abies (L.) Karst.). Holzforschung 56(5): 449–460. https://doi.org/10.1515/hf.2002.070.
McLean J.P. (2008). Wood properties of four genotypes of Sitka spruce. PhD Thesis. Department of Analytical and Environmental Chemistry, University of Glasgow.
Mitchell M.D., Denne M.P. (1997). Variation in density of Picea sitchensis in relation to within-tree trends in tracheid diameter and wall thickness. Forestry 70(1): 47–60. https://doi.org/10.1093/forestry/70.1.47.
Moore J., Lyon A.J., Ridley-Ellis D., Gardiner B.A. (2008). Properties of UK-grown Sitka spruce: extent and sources of variation. Engineered Wood Products Association.
Moore J.R., Lyon A.J., Searles G.J., Vihermaa L.E. (2009). The effects of site and stand factors on the tree and wood quality of Sitka spruce growing in the United Kingdom. Silva Fennica 43(3): 383–396. https://doi.org/10.14214/sf.195.
Mork E. (1928). Die qualität des fichtenholzes unter besonderer rücksichtnahme auf schleif-und papierholz. Der Papier-Fabrikant 26(48): 741–747.
Park Y.S. (2002). Implementation of conifer somatic embryogenesis in clonal forestry: technical requirements and deployment considerations. Annals of Forest Science 59(5–6): 651–656. https://doi.org/10.1051/forest:2002051.
Park Y.S., Weng Y., Mansfield S.D. (2012). Genetic effects on wood quality traits of plantation-grown White spruce (Picea glauca) and their relationships with growth. Tree Gentics and Genomes 8(2): 303–311. https://doi.org/10.1007/s11295-011-0441-z.
Rozenberg P.H., Cahalan C.H. (1997). Spruce and wood quality: genetic aspects (a review). Silvae Genetica 46: 270–279.
Saranpää P. (2009). Wood density and growth. In: Barnett J., Jeronimidis G. (eds.). Wood quality and its biological basis. John Wiley and Sons. p. 87.
Scallan A.M., Green H.V. (1974). A technique for determining the transverse dimensions of the fibres in wood [softwoods, hardwoods]. Wood and Fiber 5(4): 323–333.
Thompson D. (2013). Development of improved Sitka spruce for Ireland. Irish Forestry 70: 104–118.
Treacy M., Evertsen J., Ni Dhubhain A. (2000). The mechanical and physical wood properties of a range of Sitka spruce provenances. Coford.
Wu H.X., Ivković M., Gapare W.J., Baltunis B.S., Powell M.B., McRae T.A. (2008). Breeding for wood quality and profit in radiata pine: a review of genetic parameters. New Zealand Journal of Forestry Science 38(1): 56–87.
Zobel B.J., Van Buijtenen J.P. (1989). Wood variation. Its causes and control. Springer Verlag, Berlin. 363 p. https://doi.org/10.1007/978-3-642-74069-5.
Zobel B.J., Jett J.B. (1995). Genetics of wood production. Springer-Verlag, Berlin. https://doi.org/10.1007/978-3-642-79514-5.
Zobel B.J., Sprague J.R. (2012). Juvenile wood in forest trees. Springer Science and Business Media.
Total of 34 references.
