Franz Holzleitner  ,
Christian Kanzian,
Norbert Höller
,
Christian Kanzian,
Norbert Höller
Monitoring the chipping and transportation of wood fuels with a fleet management system
Holzleitner F., Kanzian C., Höller N. (2013). Monitoring the chipping and transportation of wood fuels with a fleet management system. Silva Fennica vol. 47 no. 1 article id 899. https://doi.org/10.14214/sf.899
Abstract
Controlling and organizing the complex forest-to-consumer supply chain of wood fuels is a challenging task, especially for the chipping and transport processes. Truck mounted chippers and transport trailer-trucks must be scheduled to minimize delay to be profitable. Job management within the supply chain, including machine activity based controlling, offers a new way to increase efficiency and productivity. However, detailed data are required to detect and analyze potential gaps and improve forest fuel supply. Generally, data regarding the wood fuel supply chain process are obtained from extensive time studies that are based on a specific process step. Although time studies can detect details during the production of forest fuels, they only describe certain time frames. Long-term data that are recorded during the entire year could encompass seasonal and short term effects. This study aims to monitor the forest fuel supply processes (semi-automated), specifically regarding time and fuel consumption. Large data sets were automatically and efficiently gathered with little effort by drivers and operators. Data were recorded with fleet management equipment for more than 14 months. Vehicle data, including GPS data, were logged at an interval of one minute. Data management was conducted in a pre-configured database that contained pre-defined reports and were run by the Institute of Forest Engineering, Vienna. Work step assignments were implemented with Structured Query Language (SQL)-routines by using the raw machine activities data and GPS. The chipping and transport activities of more than 240 loads were analyzed by focusing on fuel consumption, time needed and traffic. The average distance between chipping sites and plants was approximately 54 kilometers. Fuel consumption from transport reached 50 l/100 km. The chipping unit reached a productivity of 12.8 odt/PSH15 and had a fuel consumption of 58 liters per operating hour.
Keywords
forest fuel;
supply chain;
monitoring;
logistic;
fleet management;
wood chips
-
Holzleitner,
Institute of Forest Engineering, Department of Forest and Soil Sciences, University of Natural Resources and Life Sciences, Peter Jordanstrasse 82/3, 1190 Vienna, Austria
E-mail
franz.holzleitner@boku.ac.at
- Kanzian, Institute of Forest Engineering, Department of Forest and Soil Sciences, University of Natural Resources and Life Sciences, Peter Jordanstrasse 82/3, 1190 Vienna, Austria E-mail christian.kanzian@boku.ac.at
- Höller, Institute of Forest Engineering, Department of Forest and Soil Sciences, University of Natural Resources and Life Sciences, Peter Jordanstrasse 82/3, 1190 Vienna, Austria E-mail norbert.hoeller@boku.ac.at
Received 11 May 2012 Accepted 15 January 2013 Published 11 June 2013
Views 90650
Available at https://doi.org/10.14214/sf.899 | Download PDF

1 Introduction
An increasing share of renewable energy, projected to increase up to 20% in the EU in 2020, has resulted in a building boom for combined heating plants (CHP). Therefore, the demand for forest biomass is rapidly growing. Besides small and medium sized CHPs also large CHPs have been installed with large supply areas. These additional installations can directly influence the overall supply cost. Furthermore, installation of new combined heating plants will directly increase and move supply areas due to competition for raw materials. New plants will influence supply costs for existing and new CHPs (Kanzian et al. 2009).
Controlling the complex supply chain of wood fuels from the forest to the customers is a complex task to organize, especially for the interface between chipping and transport processes. Truck mounted chippers and trailer-trucks for transport must be scheduled with minimum operational delay to be profitable. Delays are not easy to detect and are a critical factor for the success or failure of these businesses (Spinelli and Visser 2009). Job management within the supply chain, including machine activity based control, offers a method to increase efficiency. Daily reports from machinery operation in the field can support control activities within the supply chain management.
State of the art information technology is already used in other branches of business to meet customer demands in a cost effective way. Supporting the supply chain processes from the forest to the plant with on-board monitoring equipment is becoming more important. The use of mobile terminals in combination with GPS for controlling the transport of wood chips was studied by Sikanen et al. (2005). This study showed that state of the art information technology is able to fulfill basic requirements. However, further improvements are needed in terms of user-friendly hardware and software and data exchange. Furthermore, Windisch et al. (2010) showed the potential for increasing productivity by implementing supply chain management tools that improve process handling in terms of efficiency.
Therefore, detailed real time data are required to detect and analyze potential gaps to improve forest fuel supply and to initiate immediate improvements. Spinelli et al. (2012) also discussed the benefit of accurate and reliable data for making decisions regarding wood fuel consumption and productivity. Based on analyzed data, Spinelli and Magagnotti (2010) developed a spreadsheet based medium and long-term performance cost calculator for predicting chipping costs.
Typically, data from the entire forest fuel supply chain are gained from extensive time studies for specific process steps. Although time studies can detect details within wood fuel production, they can only describe certain time windows. Nonetheless, detailed short term studies are efficient for detecting and analyzing delays during chipping operations but not for long or rare types of delays (Spinelli and Visser 2009). Long-term year-round data recording could also be used to observe seasonal and short term effects.
Drivers do not always fulfill the requirements for accurately capturing data or determining needed inputs, especially over long periods. Furthermore, the quality of inputs decreases over the recording duration. Another approach is the use of automated data recording to analyze time consumption of the wood fuel supply chain processes.
Regarding time, fuel consumption and traffic ability, Holzleitner et al. (2011) successfully used fleet management equipment to analyze transport processes. Five logging trucks with trailers were observed to obtain a detailed analysis of the timber transport process from the forest to the mill.
This study aims to monitor the supply processes of forest fuels based on time and fuel consumption by using a semi-automated method. Large data sets were automatically, efficiently and accurately gathered by the operators. Data were recorded with fleet management equipment. Work step assignments were made from either the driver’s input or were implemented with Structured Query Language (SQL)-routines that used raw data from the machine activities and GPS.
2 Materials and methods
2.1 Vehicles with fleet management systems
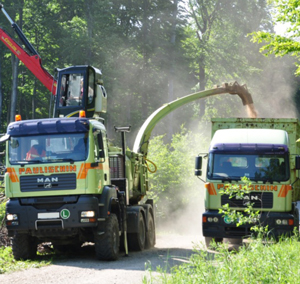
A chipping unit was mounted on a three-axle MAN-truck chassis and was powered by the truck´s engine by an intermediate transmission. This unit was equipped with a crane for feeding and an extra cabin for the operator during chipping (Table 1). To reduce insurance costs, the speed of the chipper-truck was limited to a maximum of 60 km/h. Forest fuels varied from hard- to softwood and from round wood to tops. Data were recorded from October 2009 until January 2011. Based on the aims of this study, the drivers were instructed by the dealer and project team to ensure suitable handling of the fleet management system.
| Table 1. Machine concept chipper truck and its attributes. | ||
| Chipper [ ] | Jenz HEM 561 R | |
| Type [ ] | MAN TGA 28.480 6x4-4BL | |
| Drum [mm] | 820 | |
| Blades [n] | 10/20 | |
| Drive [ ] | MAN chassis | |
| Engine power [kw] | 353 | |
| Loading unit [ ] | Epsilon E110L Plus | |
| Weight [t] | 20 | |
| Discharge [ ] | Blowing unit | |
| Year | 2007 | |
 | ||
Because chip transport is not the only business division of the entrepreneur, the transport of chips was made by trucks and trailers with roll-on/roll off containers. Containers were fixed on the chassis for transporting wood chips and were changed for the delivery of goods other than wood fuel supply. The type of chassis differed between 1998 and 2007 (Table 2).
| Table 2. Transporting vehicle attributes. | ||
| Code | Type of engine and chassis | Year of construction |
| 184-1 | Mercedes Benz Actros 2640 L 6x4 | 2000 |
| 214-2 | MAN 27364 DFC T48 6x4 | 2000 |
| 734-4 | Mercedes Benz Actros 2640 6x4 | 1998 |
| 728-3 | MAN TGA 33.4440 BB H 35 6x4 | 2007 |
Hardware and software for recording data were obtained from Funkwerk eurotelematik GmbH, a German manufacturer that specializes in fleet management applications. The delivered version included an installed database with pre-configured reporting and data management tools. This system is a commercial fleet management system for controlling the transport of goods and orders from the producer or distributer to the customer. The core of the data management system is a database that runs on a server at the Institute of Forest Engineering, Vienna, where all collected raw data are stored, prepared and merged for further analyses.
The installed hardware in the driver’s cabin consists of a terminal for handling navigation and documenting the progress of the delivery notes and the additional driver input (according to the study layout). Positioning is determined with an integrated GPS antenna. Data transmission to the server is conducted with a GSM network module (Fig. 1). Engine related data were directly recorded from the Fleet Management Systems Interface (FMS) of each vehicle. The interval for capturing data is flexible and was set to 1 minute during the study. The data sets contain the following information: time stamp, vehicle ID, position and additional engine related data, which depends on the FMS version and data availability.
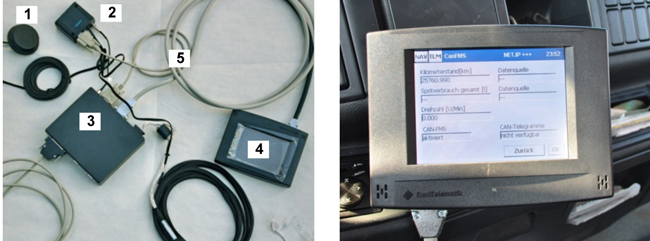
Telematics kit: GPS antenna1, GSM module2, Onboard computer system3,
Terminal4 and Wiring5 (left), and Terminal showing status of vehicle (right)
Fig. 1. Fleet management equipment with the components that were used during the project.
Creating and processing delivery notes and the controlling progress were conducted from a desktop in the entrepreneur’s office. Potentially necessary settings were executed with the GSM network from the institute’s desktop, including the intervals and the additional vehicles setting within the listings. Parallel working was enabled with different access rights.
Due to the age of the vehicles, not all engine data were available via FMS from every truck. Therefore, fuel consumption was analyzed with a digital refueling report from the entrepreneur, which was linked to the rest of the data after collection.
2.2 Data management and analysis
Every delivery note sent from the entrepreneur’s office to the truck driver’s cab had to be dispatched by a logistician. After transfer to the driver’s cab, the driver was required to pick out the necessary tasks that were based on predefined working steps with a touch screen on the terminal. Without the driver’s input, the work step assignment was switched to a scheme based on machine activities. Therefore, semi-automated assignment routines for the working steps were developed based on the recorded engine signals. These routines were developed and tested with pre-tests in the field to determine if the observed time fit the automatic assignment method (Fig. 2).
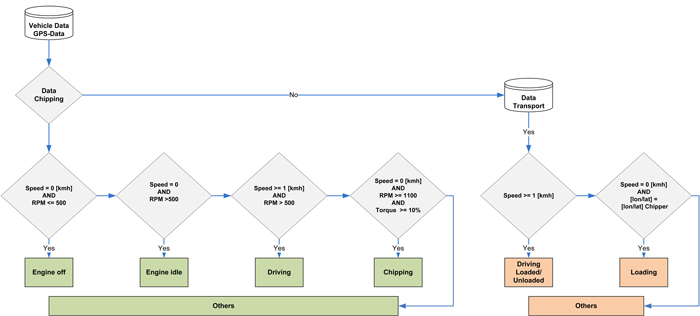
Fig. 2. Flow-process-chart for semi-automated process assignment. View larger in new window/tab.
The progress of each chipping site was monitored by the entrepreneur and was supported by the automated reports that were generated with a standard software package. These reports contained basic information regarding time consumption, distances and additional driver input. These reports could be produced for each load, daily or even weekly.
To reference the chipping and transport productivity, load data from the digital delivery notes were combined with the transportation data. Every load was weighted and the moisture content information was included. Sampling and moisture content determinations (on a wet basis) were conducted by following the Austrian Standards and by using the oven dry method (ÖNORM M 7132 and M 7133, 1998). These data were imported into the database and were linked with the vehicle and route data. The route data were linked and referenced in the Austrian national road database, which contains all public roads and their attributes. Afterwards all the recorded and prepared data were analyzed using descriptive statistics like mean values, minimum value, maximum values and percentiles. All statistical analysis were done with the statistic software package PASW statistics 18 and the results were documented in tables.
3 Results
3.1 Load characteristics
The chipper produced 436 delivered loads of wood chips between October 2009 and January 2011. These wood chips were transported by four vehicles and these loads were used for analysis of loading capacities of transport but not all loads were covered by the fleet management system due to lack of data caused by technical restrictions. Altogether, more than 650 000 rows of data were recorded from the participating vehicles. The average load per truck with the trailer reached 22.4 or 13.9 tons wet and dry mass, respectively (oven dry tons – odt) (Table 3 and Table 4).
| Table 3. Average load data [green-tons] of participating trucks during the study period. | ||||||
| Vehicle ID | Mean | Maximum | Minimum | 5th percentile | 95th percentile | [n] |
| 184-1 | 22.5 | 28.9 | 10.4 | 17.0 | 27.1 | 101 |
| 214-2 | 23.0 | 26.9 | 14.1 | 19.2 | 25.5 | 77 |
| 728-3 | 22.3 | 28.7 | 14.7 | 16.5 | 27.5 | 79 |
| 734-4 | 22.1 | 27.4 | 8.4 | 18.2 | 25.5 | 179 |
| Sum | 22.4 | 28.9 | 8.4 | 17.2 | 26.2 | 436 |
| Table 4. Average load data [odt] of the participating trucks during the study period. | ||||||
| Vehicle ID | Mean | Maximum | Minimum | 5th percentile | 95th percentile | [n] |
| 184-1 | 14.3 | 18.1 | 7.1 | 10.4 | 17.2 | 101 |
| 214-2 | 14.1 | 17.8 | 8.3 | 10.3 | 17.4 | 77 |
| 728-3 | 13.9 | 18.2 | 9.0 | 10.2 | 16.9 | 79 |
| 734-4 | 13.7 | 19.2 | 5.3 | 9.5 | 16.7 | 179 |
| Sum | 13.9 | 19.2 | 5.3 | 10.2 | 17.2 | 436 |
3.2 Process analysis
According to the predefined study layout that used driver input from the terminal, 46 transport orders were analyzed. The average empty driving time was 75 min. The loading process for the truck and trailer lasted 71 min (Table 5). A single tour that included all processes lasted for 287 min.
In addition, scaling and unloading processes were analyzed based on the electronic data from the plant. In this case, the time used is slightly higher because additional driving time between the scaling unit and the unloading point is included. Thus, the average time used was 37 minutes. With driver input, the process of unloading was more precisely defined (Table 6).
Additionally, engine use during the study period was analyzed based on FMS-data. The chipping unit was operating for nearly 1981 hours per year. Almost 50% of that time was used for chipping. Only a quarter of that time was used for driving. The rest of the time was spent in idle running and other necessary processes (Table 7).
| Table 5. Time consumption [min] of the recorded processes for transport based on recorded and dispatched delivery notes. | ||||||
| Process | Mean | Maximum | Minimum | 5th percentile | 95th percentile | [n] |
| Driving empty | 75.0 | 118.2 | 20.4 | 48.6 | 105.0 | 42 |
| Loading | 70.8 | 118.2 | 42.6 | 48.0 | 116.4 | 46 |
| Driving loaded | 81.0 | 159.6 | 46.8 | 56.4 | 137.4 | 43 |
| Scaling/Unloading | 25.2 | 51.6 | 12.6 | 13.2 | 48.0 | 40 |
| Other delays | 6.0 | 13.8 | 0.0 | 0.0 | 13.8 | 6 |
| Waiting delays | 24.6 | 69.6 | 3.6 | 3.6 | 69.6 | 12 |
| Others | 4.2 | 11.4 | 0.0 | 0.0 | 11.4 | 22 |
| Table 6. Time consumption [min] for scaling and unloading activities at the plant for participating trucks during the study period. | ||||||
| Vehicle ID | Mean | Maximum | Minimum | 5th percentile | 95th percentile | [n] |
| 184-1 | 37.6 | 93.0 | 12.0 | 14.0 | 77.0 | 85 |
| 214-2 | 34.0 | 67.0 | 12.0 | 14.0 | 56.0 | 67 |
| 728-3 | 32.9 | 97.0 | 12.0 | 14.0 | 64.0 | 73 |
| 734-4 | 39.3 | 95.0 | 12.0 | 15.0 | 69.0 | 146 |
| Sum | 36.7 | 97.0 | 12.0 | 14.0 | 67.0 | 371 |
| Table 7. Process time with a running engine during the study period based on automatically assigned processes. | |||
| Process with running engine | Sum [h] 15 Months | Sum [h] 12 Months | [%] |
| Chipping | 1203.0 | 962.4 | 48.6 |
| Driving | 585.8 | 468.7 | 23.7 |
| Idle running | 608.4 | 486.7 | 24.6 |
| Others | 79.4 | 63.5 | 3.2 |
| Sum | 2476.6 | 1981.3 | 100 |
From the automated activity based work step assignments, a sum of 253 load for the productivity and 242 loads for distance and driving were available and covered by the fleet management system with data. The chipper reached an average productivity of 12.8 odt/PSH15 (productive system hours including breaks smaller than 15 min). Driving distances between the forest road-side storage and the plant was approximately 54 km. In addition, 1.4 hours of transport were needed for each direction (Table 8).
Fuel consumption during transport and chipping were based on the distances driven. Two analysis methods were available, one based on electronic data from the company and one based on the FMS-data from one vehicle. Based on refueling data, nearly 50 l of diesel were consumed per 100 km in all transport trucks. Based on the analyzed FMS-data from the engine of vehicle 728-3, this truck had a fuel consumption of 54.7 l per 100 km. This same vehicle had a fuel consumption of 56.8 l/100 km according to the entrepreneur fuelling data base. This figure contains all of the processes that occur when the truck engine is running. When only driving is considered for fuel consumption, this value is reduced to 50 l/100 km (Table 9 and Table 10). Different goods were not split in this determination. Regarding transport processes, at a distance of 55 km 3.9 l/odt will be used.
| Table 8. Chipper productivity, load data, distance and time consumption for transport activities based on automated assignment of processes. | ||||
| Productivity of the Chipper [odt/PSH15] | Load/Truck [odt] | Chipping site-plant distance [km] | Time consumption/ distance [h] | |
| Mean | 12.8 | 13.8 | 53.7 | 1.4 |
| Maximum | 29.7 | 18.2 | 97.0 | 2.9 |
| Minimum | 5.3 | 5.3 | 28.0 | 0.7 |
| 5th percentile | 6.2 | 9.6 | 35.0 | 0.9 |
| 95th percentile | 20.7 | 16.9 | 85.0 | 2.1 |
| [n] | 242 | 242 | 253 | 253 |
| Table 9. Fuel consumption [l/100 km] based on the electronic fueling data of the enterprise. | ||||||
| Vehicle ID | Mean | Maximum | Minimum. | 5th percentile | 95th percentile | [n] |
| 184-1 | 47.7 | 61.5 | 20.4 | 41.7 | 56.2 | 76 |
| 214-2 | 48.3 | 73.1 | 26.4 | 29.7 | 69.7 | 28 |
| 728-3 | 56.8 | 85.1 | 31.8 | 43.9 | 78.2 | 63 |
| 734-4 | 45.9 | 78.8 | 20.7 | 24.4 | 61.8 | 67 |
| Sum | 49.7 | 85.1 | 20.4 | 34.4 | 71.5 | 234 |
| Table 10. Fuel consumption based on the analyzed FMS-data of vehicle 728-3. | ||||||
| Consumption | Mean | Maximum | Minimum. | 5th percentile | 95th percentile | [n] |
| All activities [l/100 km] | 54.7 | 88.0 | 25.9 | 39.9 | 80.3 | 191 |
| Driving [l/100 km] | 50.0 | 90.0 | 24.0 | 38.0 | 69.6 | 215 |
| Table 11. Fuel consumption of the chipper. | ||||||
| Fuel consumption | Mean | Maximum | Minimum. | 5th percentile | 95th percentile | [n] |
| [l/h] | 40.5 | 130.6 | 20.2 | 21.6 | 92.3 | 127 |
| [l/machine hour] | 57.6 | 143.4 | 21.4 | 25.0 | 105.4 | 151 |
Fuel consumption during chipping was also analyzed based on the electronic fuelling protocols. In this case, the fuel consumption during chipping reached 40.5 l/hour referenced on clock time. Based on operating hours, the engine consumed 57.6 l/hour of fuel for all processes (Table 11). On average, the chipping process consumes 3.2 l/odt of wood chips.
A transport model was developed and applied based on the recorded data. Based on the distance and the processes needed for one cycle, it is possible to estimate and show the effect of moisture content on the productivity and cost of wood chips. For the truck and trailer, an hourly rate that included the driver cost of 77 Euros was considered. Natural drying at the chipping site can effectively improve these processes and reduce costs by increasing the transport capacity (Fig. 3). Reducing moisture content from 45% to 37% productivity differs at a distance from 55 km close to 9%.
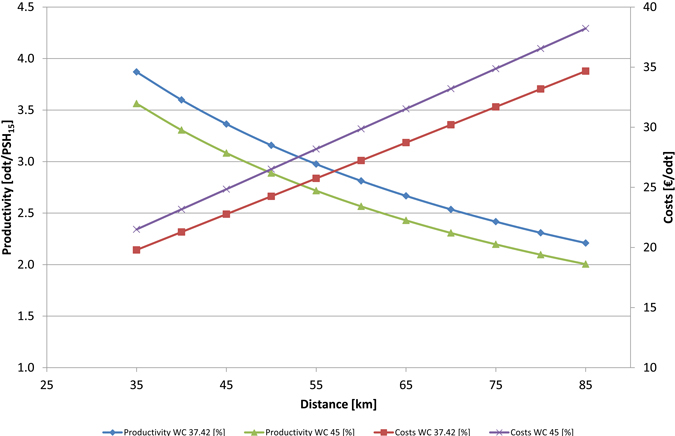
Fig. 3. Effects of moisture content on transport productivity costs that are based on recorded data.
The fleet management system used in this study is available for rental or purchase. Based on the summarized costs that include the hardware, software and additional installation costs and a monthly data transmission fee, the entire system cost 0.72 €/odt. This calculation is based on the use of 5 vehicles with 200 disposed loads per vehicle and year transporting an average load volume of 14 odt. This cost could be reduced if the entrepreneur increases the business within this branch. Compared to the renting model, the investment strategy is 0.23 €/odt cheaper (Table 12).
| Table 12. Cost calculation for the equipment used in the study based on the conditions during data recording. | |
| Component | Figure |
| Hardware server [€] | 4657.50 |
| Hardware vehicle [€] | 13925.00 |
| Software server [€] | 9885.00 |
| Software vehicle [€] | 2860.00 |
| Installation [€] | 12249.00 |
| Additional costs [€/month] | 119.00 |
| Summarized costs | 43576.50 |
| Depreciation [years] | 5 |
| Number of vehicles | 5 |
| Number of loads [n/a] | 200 |
| Costs without taxes [€/odt] | 0.72 |
4 Discussion
The aim of this study was to automatically monitor wood fuel supply with onboard fleet management equipment. Time consumption of the defined processes, including fuel consumption during the entire wood fuel supply chain, was analyzed. Overall, all delivery notes with wood fuel were less than expected due to technical problems and differing market conditions. However, enough data were available for a detailed and precise analysis. Therefore identifying of processes with machine activity based assignment was developed and applied. The creation of additional daily reports for the entrepreneur worked well and required little programming effort. Only a lack of data, due to old trucks in the case of shorted FMS-data, limited the detailed analysis.
Nonetheless, the project, which used a digital onboard data recording system, and its focus on forest fuel supply and chipping and transport activities, yielded high quality and precise data. Furthermore, the developed SQL-routines were able to conduct an automated time study with relatively no additional input from the drivers themselves (Stampfer et al. 2011).
Compared with the results of round wood transport by Holzleitner et al. (2011), the fuel consumption was lower (49.7 compared to 77 l/100 km). This difference could be explained by the use of different vehicles and the inclusion of different activities in the transport process of round wood, including loading and unloading. Additionally, the terrain in the present study was not as difficult to traverse relative to the terrain in the other study. Lindholm and Berg (2005) estimated that the average fuel consumption for timber was 56 l/km.
These results are necessary for implementing and improving cost estimates and for using least cost surfaces for wood chip transport (Möller and Nielsen 2007). In addition, these results allow the development of simulation models for biomass supply based on discrete-event simulation or static simulation approaches (Asikainen 1995, Asikainen 2007).
Therefore such data is needed to develop vehicle routing algorithm or verify respectively improve already existing models in the timber transport sector especially for minimizing driving times and reducing greenhouse gas emissions. The study results were also used in the vehicle routing analysis from Oberscheider et al. (2012).
Regarding the productivity of the analyzed transport system, the average moisture content of the chipped material was 37.4%. If the material was stored longer, the moisture content would decrease and the transport capacity could increase. With natural drying, the moisture content can be lowered to 32% (Erber et al. 2012). Nurmi and Hillebrand (2007) showed that it was possible to reduce the moisture content to 30%. Thus, the transport costs could be reduced easily.
In the future, FMS-protocols will become easier to handle in different truck models. In addition, new machinery enables the availability of digital data for monitoring machine activity based on logistic process analysis (e.g., digital tachographs). Furthermore, the use of software applications must become easier to use. Interfaces between already existing systems, such as book-keeping or enterprise resource planning systems, are necessary to support the implementation of fleet management systems. Nevertheless, detailed process analysis requires more detailed data collection with additional effort by the drivers. Replacing an on-site time study with skilled scientists by using a fleet management system with automated analysis will be still difficult to conduct.
Acknowledgements
Authors want to thank the entrepreneur for enabling data recording and the Austrian Research Promotion Agency FFG for funding the project.
References
Asikainen A. (1995). Discrete-event simulation of mechanized wood-harvesting systems. Faculty of Forestry, University of Joensuu, Research Notes 38.
Asikainen A. (2007). Simulation of stum crushing and truck transport of chips. Scandinavian Journal of Forest Research 25: 245–250.
Erber G., Kanzian C., Stampfer G. (2012). Predicting moisture content in a pine logwood pile for energy purposes. Silva Fennica 46(4): 555–567.
Holzleitner F., Kanzian C., Stampfer K. (2011). Analyzing time and fuel consumption in road transport of round wood with an onboard fleet manager. European Journal of Forest Research 130(2): 293–301.
Kanzian C., Holzleitner F., Stampfer K., Ashton S. (2009). Regional energy wood logistics – Optimizing local fuel supply. Silva Fennica 43: 113–128.
Lindholm E., Berg S. (2005). Energy requirement and environmental impact in timber transport. Scandinavian Journal of Forest Research 20: 184–191.
Möller B., Nielsen P.S. (2007). Analysing transport costs of Danish forest wood chip resources by means of continuous cost surfaces. Biomass and Bioenergy 31: 291–298.
Nurmi J., Hillebrand K. (2007). The characteristics of whole-tree fuel stocks from silvicultural 600 cleanings and thinnings. Biomass and Bioenergy 31(6): 381–392.
Oberscheider M., Zazgornik J., Bugge Henriksen C., Gronalt M., Hirsch P. (2012). Minimizing driving times and greenhouse gas emissions in timber transport with a near-exact solution approach. Scandinavian Journal of Forest Research. [Accepted manuscript]. doi:10.1080/02827581.2012.758309.
ÖNORM M 7132.1998. Energy-economical utilization of wood and bork as fuel – definitions and properties. Österreichisches Normungsinstitut 1021. Wien.
ÖNORM M 7133.1998. Chipped wood for energetic purposes – requirements and test specifications. Österreichisches Normungsinstitut 1021. Wien.
Sikanen L., Asikainen A., Lehikoinen M. (2005). Transport control of forest fuels by fleet manager, mobile terminals and GPS. Biomass and Bioenergy 28:183–191.
Spinelli R., Magagnotti N. (2010). A tool for productivity and cost forecasting of decentralised wood chipping. Forest Policy and Economics 12: 194–198.
Spinelli R., Visser R. (2009). Analyzing and estimating delays in wood chipping operations. Biomass and Bioenergy 33: 429.
Spinelli R., Cavallo E., Facello A., Magagnotti N., Nati C., Paletto G. (2012). Performance and energy efficiency of alternative comminution principles: chipping versus grinding. Scandinavian Journal of Forest Research 27(4): 393–400.
Stampfer K., Gronalt M., Holzleitner F., Kanzian C., Kühmaier M., Leitner T., Zazgornik J. (2011). Development of a model for eco-efficient supply of woody biomass. Forschungsbericht Im Auftrag Von FFG Und Klima- Und Energiefonds Im Rahmen Ausschreibung Programmlinie Neue Energien 2020. p. 218.
Windisch J., Sikanen L., Röser D., Gritten D. (2010). Supply chain management applications for forest fuel procurement – cost or benefit? Silva Fennica 44(5): 845–858.
Total of 16 references
