Anna Saarsalmi  ,
Pekka Tamminen,
Mikko Kukkola
,
Pekka Tamminen,
Mikko Kukkola
Effects of long-term fertilisation on soil properties in Scots pine and Norway spruce stands
Saarsalmi A., Tamminen P., Kukkola M. (2014). Effects of long-term fertilisation on soil properties in Scots pine and Norway spruce stands. Silva Fennica vol. 48 no. 1 article id 989. https://doi.org/10.14214/sf.989
Highlights
- N fertilisation increased the amount of carbon in the organic layer
- N fertilisation decreased the C/N ratio in the surface soil
- N addition increased the amount of most nutrients in the organic layer
- N fertilisation tended to lower pH, although only slightly.
Abstract
The response of surface soil after 45- to 52-years to repeated nitrogen and phosphorus fertilisation was studied. This study included 30 factorial experiments established in young (5- to 30-year-old) stands using plots of 900 m2, on average, and by randomising treatments within each experiment. Total amount of N added varied from 534 to 1908 kg ha–1 and that of P from 69 to 193 kg ha–1, repeated at every second N fertilisation. Liming was performed twice; in total, 6000 kg ha–1 of dolomite was applied. Nitrogen fertilisation increased the mass of the organic layer and the amount of carbon and consequently the amounts of most of the elements in the organic layer. In both the organic layer and the 0–10 cm layer of mineral soil, nitrogen fertilisation decreased the C/N ratio and tended to lower pH, although only slightly. Phosphorus fertilisation increased the amounts of P and Ca. Liming increased the total amounts of most elements in the organic layer, except for C and N. We were able to derive models to describe how changes in the chemical properties of the surface soil depended on doses of elements and on site and stand properties.
Keywords
boreal forest;
nitrogen;
Pinus sylvestris L.;
phosphorus;
liming;
forest soils;
Picea abies (L.) Karst.
-
Saarsalmi,
Finnish Forest Research Institute, P.O. Box 18, FI-01301 Vantaa, Finland
E-mail
anna.saarsalmi@metla.fi
- Tamminen, Finnish Forest Research Institute, P.O. Box 18, FI-01301 Vantaa, Finland E-mail pekka.tamminen@metla.fi
- Kukkola, Finnish Forest Research Institute, P.O. Box 18, FI-01301 Vantaa, Finland E-mail mikko.kukkola@metla.fi
Received 28 August 2013 Accepted 15 January 2014 Published 29 January 2014
Views 277484
Available at https://doi.org/10.14214/sf.989 | Download PDF

1 Introduction
In the 1950’s it was not clear which nutrients were most limiting for tree growth on upland soils in Finland, what would be suitable dosages of each nutrient and what would be the duration of a possible growth response. It was also unclear how site fertility, weather conditions, tree species and stand age would correlate with a possible growth response. Therefore, to explore these questions, fertilisation experiments were established in Finland (Viro 1967).
Since the 1950’s many types of fertilisation experiments in the Nordic countries have revealed that nitrogen is the only nutrient which given alone could significantly increase tree growth on upland sites i.e. on sites with mor or moder layer on the top of mineral soil (Viro 1967; Nilsen 2001; Nohrstedt 2001; Saarsalmi and Mälkönen 2001; Jacobson and Pettersson 2010). It follows that nitrogen fertilisation will increase the amounts of soil organic matter, carbon and nitrogen, and in some cases also calcium, magnesium and phosphorus, and decrease the C/N ratio in the organic layer (Mälkönen et al. 1990; Högberg et al. 2006; Ring et al. 2011). Long-term nitrogen fertilisation in reasonable doses (150 to 200 kg ha–1 per 5–10 years) seems to have no or very small effects on soil acidity, at least in terms of pH (Mälkönen et al. 1990; Högberg et al. 2006; Derome et al. 2009).
Additional nitrogen by deposition or fertilisation has been suspected to cause in addition to an increase in tree growth, enrichment of nitrogen in forest ecosystems with harmful consequences such as leaching of nitrate and base cations to ground and surface waters (Smolander et al. 1995; Ring et al. 2006), imbalance between nitrogen and other nutrients, e.g. boron deficiency (Möller 1983), and changes in ground vegetation (Ellenberg 1988; Mäkipää 1995; Strengbom and Nordin 2008; Hedwall et al. 2011). According to the reviews of Binkley and Högberg (1997) and Saarsalmi and Mälkönen (2001), however, there is no general risk for nitrogen saturation or even milder harmful effects in Finnish forests due to repeated nitrogen fertilisation. The relative effects of nitrogen fertilisation on tree stand and soil seem to be greater on less fertile sites with a high C/N ratio and in pine-dominated stands than on more fertile sites with a low C/N ratio and in spruce- dominated stands (Mälkönen et al. 1990; Nohrstedt 2001; Saarsalmi and Mälkönen 2001). If the C/N ratio of the organic layer is very low, around 20, intensive nitrogen fertilisation may, instead of increasing stand growth, cause or worsen growth disturbances due to boron deficiency (Aronsson 1983; Möller 1983; Saarsalmi and Tamminen 2005) and lead to leakage of nitrate from surface soil (Matzner and Grosholz 1997; Tietema et al. 1998).
In Finland, fertilisation in practical silviculture reached its maximum in 1975, decreasing sharply in the late 1970’s and again in the late 1980’s (Kukkola and Nöjd 2000). During the last 15 years fertilisation areas have increased again, and at present on uplands the annual area fertilised is c. 20 000 ha–1. Nitrogen deposition has decreased as much as 50% during the last 40 years: from maximum 8 kg ha–1 a–1 (1971–1988) to maximum 4 kg ha–1 a–1 (2009) (Järvinen and Vänni 1990) (http://www.metla.fi/metinfo/kestavyys/c2-deposition-of-air.htm).
Liming was one of the treatments used in Finnish fertilisation experiments because in agricultural soils, liming was a basic method used to increase plant production; on the other hand, Scots pine productivity was found to correlate with calcium in the soil (Viro 1951). However, broadcast liming on forested upland sites decreased or had no effect on tree growth (Derome et al. 1986; Nilsen 2001; Nohrstedt 2001). Later on, in the 1980’s and 1990’s, liming was used to counteract acidification of soils and waters, which was efficient in terms of acidity (pH) or acid buffering capacity, but hardly useful in Nordic boreal forests (Derome et al. 1986; Binkley and Högberg 1997; Derome et al. 2000; Sikström et al. 2001). However, liming raised soil pH, increased concentrations of Ca and Mg (Derome et al. 1986; Saarsalmi and Levula 2007; Saarsalmi et al. 2011) and also increased the mass and N content of the organic layer (Derome et al. 1986).
Phosphorus was included in Finnish fertilisation experiments as a heritage from agricultural practice, similarly to liming, and possibly due to some positive results from regeneration experiments (Nilsen 2001). Phosphorus and potassium have been shown to limit tree growth on many peat soils (Moilanen 2005), but not on upland sites (Nilsen 2001; Nohrstedt 2001; Saarsalmi and Mälkönen 2001). In some cases, when given together with nitrogen, phosphorus may also increase tree growth on upland sites, mostly in productive spruce stands (Viro 1972; Tamm 1991; Kukkola and Saramäki 1983). Phosphorus fertilisation increases the concentration and amount of phosphorus in surface soil (Kaunisto and Paavilainen 1988; Braekke and Finér 1991; Fransson and Bergkvist 2000) due to effective chemical (e.g. Ca, Al and Fe compounds) and biological fixation (plant structures), the level being higher years after the last fertilisation (Fransson and Bergkvist 2000).
Forest fertilisation has seldom been monitored for 50 years as it has in our Finnish fertiliser trials. Monitoring the characteristics of a tree stand is much easier than monitoring soil properties, because the dimensions of tree stems are systematically larger after every growing season, unlike most soil properties. Soil parameters may have trends, but may also show unsystematic annual, seasonal and human-induced (cuttings, sampling) variation (Kilian1981; Lockman and Molloy 1984; Lundell 1987; Ilvesniemi 1991; Roberts et al. 1998; Tamminen and Derome 2005). During the past 50 years, soil sampling, pretreatment and analyses have varied considerably. In addition, in our Finnish case, there are no samples from before the first fertilisation, sampled soil layers have changed and storing of samples has not always been the same. To study the effects of long-term fertilisation on soil, temporal cross-section, i.e. sampling of all experiments at the same moment, is often the only option (Derome et al. 1986; Mälkönen et al. 1990; Högberg et al. 2006; Ring et al. 2011).
Our aim in this study was to ascertain what has happened in surface soil, when nitrogen, lime or phosphorus has been spread in the forest over a period of 45 to 52 years. We expect that nitrogen fertilisation has, on average, increased the amounts of carbon and nitrogen, decreased the C/N ratio but not changed the pH in the organic layer. We also expected that liming has increased pH and the amounts of calcium, magnesium and organic matter in the surface soil. In addition, we expected that phosphorus fertilisation would have increased the amount of phosphorus both in the organic layer and in the mineral soil. A further aim was to determine how soil changes due to fertilisation are correlated with the doses of fertilised elements and with site and stand properties.
2 Material and methods
2.1 Experiments
Professor P. J. Viro and his colleagues established about 200 factorial fertilisation experiments throughout the country during the years 1958–1965. Of these we were able to use 30 experiments which had been monitored until the year 2009 (Table 1, Fig. 1). The experimental treatments contained nutrients N, P and liming (Ca+Mg), arranged in a factorial design (23 = 8 plots). The eight treatment combinations were: unfertilised control, N, P, lime, N+P, N+lime, P+lime and N+P+lime.
| Table 1. Site and stand characteristics of the experiments and total amount of the applied fertilisers. | ||||||||||||
| Exp. | Lat. °N | Long. °E | Tempsum d.d. (>5 °C) | Tree species | Started at | Stand age at 2009 | SI a), m | Prod a) , m3 ha–1 a–1 | N, kg ha–1 | P, kg ha–1 | Lime, kg ha–1 | Soil texture b) |
| 25 | 61.817 | 29.329 | 1239 | Pine | 1958 | 84 | 27.9 | 7.4 | 1676 | 149 | 6000 | SL |
| 33 | 61.875 | 29.343 | 1234 | Pine | 1958 | 70 | 29.3 | 5.9 | 1908 | 120 | 6000 | LS |
| 35 | 62.409 | 28.707 | 1168 | Spruce | 1958 | 77 | 18.3 | 8.3 | 714 | 144 | 6000 | SL |
| 36 | 62.409 | 28.710 | 1168 | Spruce | 1958 | 77 | 19.9 | 8.5 | 714 | 144 | 6000 | SL |
| 37 | 61.415 | 28.545 | 1240 | Pine | 1958 | 75 | 20.0 | 7.4 | 714 | 109 | 6000 | LS |
| 38 | 61.416 | 28.542 | 1233 | Pine | 1958 | 75 | 21.5 | 8.2 | 714 | 109 | 6000 | S |
| 52 | 62.024 | 24.811 | 1154 | Pine | 1959 | 58 | 25.9 | 8.1 | 1496 | 149 | 6000 | LS |
| 55 | 61.662 | 29.304 | 1170 | Pine | 1959 | 65 | 26.1 | 9.8 | 534 | 69 | 6000 | SL |
| 56 | 62.927 | 25.607 | 1025 | Pine | 1959 | 76 | 22.8 | 4.5 | 1496 | 149 | 6000 | SL |
| 57 | 62.935 | 25.678 | 1020 | Spruce | 1959 | 77 | 19.4 | 5.9 | 1496 | 149 | 6000 | SL |
| 58 | 62.935 | 25.677 | 1024 | Spruce | 1959 | 77 | 21.5 | 6.9 | 1496 | 149 | 6000 | SL |
| 60 | 62.930 | 25.666 | 1020 | Spruce | 1959 | 77 | 23.0 | 7.7 | 1136 | 109 | 6000 | SL |
| 64 | 61.493 | 29.066 | 1215 | Pine | 1959 | 90 | 22.0 | 5.3 | 714 | 109 | 6000 | LS |
| 67 | 61.537 | 29.062 | 1160 | Pine | 1959 | 70 | 21.1 | 9.3 | 714 | 109 | 6000 | SL |
| 68 | 61.956 | 27.575 | 1147 | Pine | 1959 | 84 | 21.5 | 7.6 | 1404 | 149 | 6000 | S |
| 73 | 62.759 | 24.747 | 1034 | Pine | 1959 | 55 | 25.9 | 8.0 | 1254 | 160 | 6000 | SL |
| 75 | 62.913 | 24.571 | 1028 | Pine | 1959 | 54 | 25.3 | 4.9 | 742 | 109 | 6000 | SL |
| 76 | 62.912 | 24.570 | 1028 | Pine | 1959 | 54 | 26.3 | 5.2 | 742 | 109 | 6000 | SL |
| 77 | 62.911 | 24.568 | 1028 | Pine | 1959 | 54 | 23.3 | 4.1 | 742 | 109 | 6000 | SL |
| 82 | 63.300 | 25.340 | 999 | Pine | 1959 | 54 | 17.6 | 3.7 | 965 | 193 | 6000 | SL |
| 97 | 62.574 | 24.119 | 1074 | Pine | 1960 | 61 | 24.8 | 8.5 | 742 | 193 | 6000 | LS |
| 98 | 62.579 | 24.125 | 1074 | Pine | 1959 | 60 | 24.5 | 6.9 | 1356 | 69 | 6000 | SL |
| 103 | 63.215 | 24.624 | 1006 | Pine | 1960 | 58 | 22.2 | 4.2 | 742 | 109 | 6000 | LS |
| 106 | 63.389 | 24.300 | 1013 | Pine | 1960 | 73 | 15.0 | 3.0 | 1136 | 120 | 6000 | LS |
| 107 | 63.095 | 24.294 | 1013 | Pine | 1960 | 63 | 18.0 | 2.6 | 742 | 153 | 6000 | LS |
| 113 | 61.172 | 26.050 | 1251 | Spruce | 1961 | 58 | 28.4 | 12.8 | 1486 | 193 | 6000 | SL |
| 135 | 67.250 | 23.869 | 791 | Pine | 1961 | 87 | 17.6 | 4.6 | 1194 | 120 | 6000 | SL |
| 155 | 61.169 | 26.048 | 1250 | Spruce | 1962 | 59 | 28.2 | 13.4 | 1074 | 160 | 6000 | SL |
| 157 | 61.111 | 26.026 | 1229 | Pine | 1962 | 62 | 24.2 | 7.1 | 1317 | 160 | 5000 | LS |
| 194 | 66.855 | 27.133 | 754 | Spruce | 1964 | 74 | 19.5 | 1.5 | 1110 | 160 | 6000 | SL |
| a) SI is H100 and Prod is the mean annual stem volume production for plots not fertilised with N (4 per experiment). b) Soil texture classes: S = sand, LS = loamy sand and SL = sandy loam. | ||||||||||||
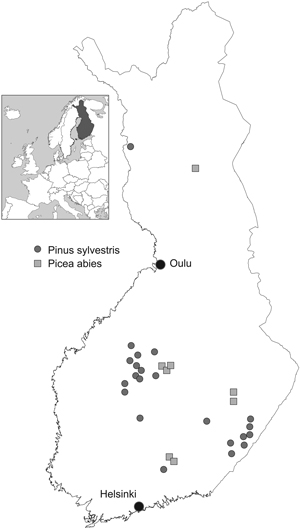
Fig. 1. Fertilisation experiments.
Experiments were established in young (5- to 30-year-old) Scots pine (Pinus sylvestris L.) and Norway spruce [(Picea abies (L.) Karst] stands using square plots with an average area of 900 m2 (625–1000 m2) and by randomising treatments within each experiment. The distance between plots was at least 10 m. When thinning was needed, the trees to be removed were chosen in connection with tree stand measurements in order to control the removal. After that, thinning was carried out before the next growing season. Branches and tops were always left in the stand. Natural removal is included in the growth results.
2.2 Fertilisation
At the beginning the nitrogen fertiliser was ammonium sulphate (N 26%) (1958–1963). Later urea was used (N 46%). From 1972 on ammonium nitrate with lime (N 27%, Ca 6%, Mg 3%) (1972–1996) was used. From 1997 its composition was a bit different (N 26%, Ca 3%, Mg 1%, B 0.02%). Nitrogen doses were at first 82 kg ha–1 (1958–1962), ending up with 180 kg ha–1 (1970–). In Lapland smaller doses were used (120–150 kg ha–1). Fertilisation intervals were usually 5 or 10 years, in some cases 4 or 6 years. The total amount of N added varied from 534 to 1908 kg ha–1. The time period from the most recent N fertilisation to soil sampling varied from 1 to 20 years.
Liming was performed twice, first with 2000 kg ha–1 of dolomite powder when the experiment was established and later with 4000 kg ha–1 of dolomite after 17–23 years had elapsed. The time period from the most recent liming to soil sampling varied from 23 to 31 years. Unfortunately, the chemical composition of the lime material used is unknown.
The phosphorus fertiliser was superphosphate (P 9%, Ca 20%); and the P dose was, on average, 40 kg ha–1, a Ca dose being c. 90 kg ha–1. Phosphorus fertilisation was repeated not as often as nitrogen fertiliser. The total amount of P added varied from 69 to 193 kg ha–1. The time period from the most recent P fertilisation to soil sampling varied from 2 to 30 years.
All fertilisers were spread manually and thus evenly. Fertilisation and thinning were carried out also on a 5 m wide buffer zone surrounding the plot.
2.3 Soil sampling
Soil samples were taken in spring 2009, i.e. 45 to 52 years after the first treatments. A composite sample from the organic layer (forest floor) consisted of 25 subsamples (d = 60 mm) taken systematically. A composite sample from the 0–10 cm mineral soil layer was taken with a volumetric cylinder (d = 39 mm, h = 100 mm) or on stony sites with spades at five spots, i.e. the plot center and corners. Thickness of the organic layer and average penetration of a steel rod (d = 10 mm) into the mineral soil to estimate stoniness (max. to 30 cm) was measured at every spot where the organic layer was sampled. The volumetric proportion of stones and boulders (d > 20 mm) was estimated based on mean penetration of the steel rod: percentage of stones in the 0–30 cm layer = 82.5 – 2.75*penetrationcm and percentage of stones in the 0–10 cm layer = 82.5 – 8.25*penetrationcm (Viro 1952; Tamminen 1991).
Bulk density for mineral soils sampled with spades was predicted with a regression equation (1).
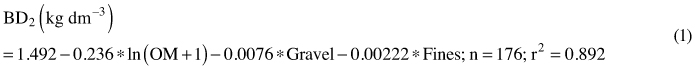
where OM is concentration of organic matter (%), Gravel is the mass percentage (%) of the 2–20 mm fraction, Fines is the mass percentage (%) of the under 63 µm fraction, n is the number of volumetric samples and r2 is a squared correlation coefficient between the measured and predicted bulk densities.
2.4 Pretreatment of soil samples
Samples were delivered to the laboratory within 2 to 3 days after collection, where they were first weighed fresh and then dried at c. 40 °C. After drying, the samples were weighed as air-dry. Organic samples were ground in a mill with a 2 mm bottom sieve, and mineral soil samples were sieved with a 2 mm sieve to obtain the mass of fine earth and the proportion of gravel.
2.5 Laboratory analysis
All samples were analysed at the laboratory of the Finnish Forest Research Institute in Vantaa. Moisture and concentration of organic matter of samples were determined with a Leco TGA 601 oven and total C and N concentrations with a Leco CHN 1000 instrument. pH was determined in a 0.01 M CaCl2 suspension, where 10 ml of sample was wetted with 25 ml of liquid, stirred and measured after 2 hours with a calibrated (buffer solutions of pH = 4.0 and 7.0) pH meter. All samples were extracted with 1 M acid ammonium acetate (pH = 4.65) (abbreviation AAA) (Halonen et al. 1983). Then 10 ml of sample and 100 ml of extractant were shaken for 2 hours and filtered. For organic samples, dry combustion was used. Ashed samples (Leco TGA 601 oven) were extracted with HCl (Halonen et al. 1983). Elemental concentrations in AAA and dry combustion analyses were determined with the ICP device Thermo Jarrell Ash Iris Advantage.
2.6 Tree stand measurements
Tree stands were measured at the time the experiments were established and after that at intervals of 4 to 10 years. The breast-height diameter (d1.3) of all trees was measured. On each plot permanent sample trees representing different size categories were chosen for tree height measurements using a hypsometer. The sample trees were used for estimating the height and stem volume.
Stand characteristics were calculated using the KPL calculation programme (Heinonen 1994). A function based on breast height diameter and tree height was used for calculating the volume of the sample trees (Laasasenaho 1982). Plotwise volume equations based on breast height diameter were then calculated using the data from the sample trees in order to estimate the volume of the other trees. Mean annual production was obtained by dividing total stem volume production, including removals, by the number of years since first fertilisation.
2.7 Statistical analyses
Preliminary checking of data revealed that only N fertilisation had increased the thickness of the organic layer; and therefore a new variable, mean thickness of the organic layer on plots not fertilised with N, was introduced to be used as a covariate in ANOVA and as an independent variable in regression analyses. The aim was to remove the effect of the originally variable thickness of the organic layer between experiments on soil analysis variables.
Skewed distributions of some variables were normalised by using logarithm transformation, ln(x) or ln(x + 1). In the logarithmic models, i.e. in the models where a dependent variable was in the form ln(yi), the constant was adjusted to yield the original arithmetic mean by adding a residual variance of the regression model to the constant, i.e. constant + sf2/2.
Analyses of variance or covariance and regression analyses were performed using a mixed model technique. The experiment was treated as a random effect, and fertilisation treatment and possible covariates or independent variables as fixed effects. In all statistical tests the level of significance was set at p < 0.05. For statistical calculations a PASW Statistics 17 package was used.
3 Results
3.1 Tree growth
Mean annual production of the plots not fertilised with N was 6.2 (2.6–9.8) m3 ha–1 a–1 in pine stands and 8.1 (1.5–13.4) m3 ha–1 a–1 in spruce stands. Only N fertilisation increased stand production. In the pine stands, growth increased, on average, 2.2 (0.4–4.7) m3 ha–1 a–1 and in spruce stands 1.8 (0.1–3.2) m3 ha–1 a–1. Relative growth response to N fertilisation correlated negatively with annual production of the site (Fig. 2), and positively with the C/N ratio of the organic layer (rSpearman = 0.61).
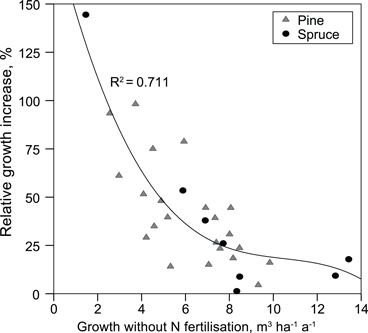
Fig. 2. Relative increase in stand production caused by nitrogen fertilisation as a function of mean annual production on unfertilised (no N) plots.
3.2 Effects of fertilisation treatments on soil
N and P fertilisation and liming affected soil characteristics independently, regardless of treatment combination (Tables 2 and 3), i.e. there was no interaction between treatments. Hence, the effects of N, P and lime treatments on soil characteristics could be analysed using dummy variables N (0/1), P (0/1) and lime (0/1) or cumulative N (kg/ha), P (kg/ha) and lime (Mg/ha) doses as independent variables.
| Table 2. Concentrations of elements by fertilisation treatment. Covariates in the ANOVA were effective temperature sum, tree species, i.e. pine (0//1), and mean thickness of the organic layer on plots not fertilised with N. | |||||||||
| Variable b) | Treatments a) | ||||||||
| Cntrl | N | P | L | NP | NL | PL | NPL | F value c) | |
| Organic layer | |||||||||
| Ctot, g kg–1 | 442a | 443a | 428ab | 362e | 444a | 403bc | 370de | 396cd | 28.4 |
| Ntot, g kg–1 | 12.6b | 15.2a | 12.1b | 10.5c | 15.1a | 14.4a | 10.9c | 14.3a | 60.0 |
| C/N | 35.7a | 29.6b | 38.1a | 35.2a | 29.8b | 28.7b | 34.9a | 28.4b | 66.7 |
| Catot, mg kg–1 | 2823c | 2960c | 4261c | 8246b | 4378c | 9420ab | 10471a | 10525a | 87.2 |
| K tot, mg kg–1 | 769a | 622cd | 734ab | 693bc | 597d | 620d | 738ab | 641cd | 13.6 |
| Mgtot, mg kg–1 | 396b | 502b | 386b | 1841a | 491b | 2019a | 2104a | 2231a | 30.5 |
| Ptot, mg kg–1 | 796b | 757bc | 946a | 706c | 912a | 714bc | 951a | 966a | 33.4 |
| pHCaCl2 | 3.22d | 3.21d | 3.38bc | 4.06a | 3.35cd | 4.07a | 4.19a | 4.18a | 191 |
| CaAAA, mg kg–1 | 1964d | 2014d | 2902cd | 5157b | 2963c | 5922ab | 6212a | 6255a | 118 |
| KAAA, mg kg–1 | 784a | 581c | 752ab | 687b | 583c | 583c | 704b | 570c | 28.1 |
| MgAAA, mg kg–1 | 273b | 347b | 252b | 773a | 337b | 904a | 782a | 912a | 45.3 |
| PAAA, mg kg–1 | 230bc | 179de | 270a | 184de | 232bc | 157e | 246ab | 212bcd | 25.9 |
| Mineral soil | |||||||||
| C, g kg–1 | 25.9bc | 30.5ab | 25.3c | 29.2abc | 29.6abc | 28.4abc | 27.5abc | 31.8a | 4.39 |
| Ntot g kg–1 | 1.03cd | 1.25ab | 1.02d | 1.13bcd | 1.20abcd | 1.21abc | 1.05cd | 1.34a | 7.80 |
| C/N | 25.9ab | 24.6bc | 25.1abc | 26.1ab | 24.8bc | 23.7c | 27.0a | 24.4bc | 5.51 |
| pHCaCl2 | 3.99b | 3.80b | 3.92b | 4.68a | 3.81b | 4.37a | 4.71a | 4.55a | 74.1 |
| CaAAA, mg kg–1 | 63c | 78c | 120c | 680a | 105c | 474b | 694a | 683a | 52.2 |
| KAAA, mg kg–1 | 31.3a | 30.2a | 32.7a | 33.2a | 29.6a | 27.8a | 32.4a | 30.1a | 2.17 |
| MgAAA, mg kg–1 | 11.1b | 15.3b | 12.9b | 83.5a | 16.3b | 80.7a | 81.1a | 86.0a | 42.5 |
| PAAA, mg kg–1 | 9.6c | 8.8cd | 12.4a | 7.1de | 11.8ab | 6.1e | 10.0bc | 9.2cd | 20.3 |
| a) Cntrl = control, N = nitrogen fertilisation, P = phosphorus fertilisation, L = liming. b) AAA = acid ammonium acetate extraction, tot = dry combustion concentration. c) F value from mixed model ANOVA with covariates. If F7,200 > 3.64, then p < 0.001. | |||||||||
| Table 3. Amounts of elements by fertilisation treatment. Potential covariates in the ANOVA were effective temperature sum, tree species, i.e. pine (0/1), and mean thickness of the organic layer on plots not fertilised with N. | |||||||||
| Variable b) | Treatments a) | ||||||||
| Cntrl | N | P | L | NP | NL | PL | NPL | F value c) | |
| Organic layer | |||||||||
| Ctot, Mg ha–1 | 16.8b | 22.8a | 17.5b | 16.0b | 22.5a | 21.0a | 16.4b | 20.5a | 25.2 |
| Ntot, kg ha–1 | 488b | 778a | 496b | 468b | 764a | 741a | 485b | 734a | 58.9 |
| Catot, kg ha–1 | 112d | 150cd | 177cd | 373b | 221c | 488a | 485a | 545a | 64.9 |
| Ptot, kg ha–1 | 30.5e | 38.2cd | 38.8cd | 31.7e | 46.1ab | 36.8d | 42.2bc | 49.8a | 35.6 |
| Mineral soil | |||||||||
| Ctot, Mg ha–1 | 20.8bc | 24.3ab | 20.3c | 22.6abc | 23.7ab | 22.7abc | 22.6abc | 24.5a | 5.28 |
| Ntot, kg ha–1 | 842d | 998a | 822d | 883bcd | 961abc | 977ab | 860c | 1023a | 9.38 |
| Org. + min. soil | |||||||||
| CaAAA, kg ha–1 | 127d | 162d | 214d | 771bc | 233d | 693c | 862ab | 870a | 88.8 |
| PAAA, kg ha–1 | 16.4cd | 16.1cd | 21.2a | 14.0de | 21.5a | 13.2e | 19.4ab | 18.5bc | 33.3 |
| a) Cntrl = control, N = nitrogen fertilisation, P = phosphorus fertilisation, L = liming. b) AAA = acid ammonium acetate extraction, tot = dry combustion concentration. c) F value from mixed model ANOVA with covariates. If F7,200 > 3.64, then p < 0.001. | |||||||||
According to the mixed model ANOVA, the main treatments N, P and liming had statistically significant effects on soil concentrations of the respective elements N, P and Ca, both in the organic layer and in the mineral soil (Table 2). Liming had the strongest effect on soil as the variables pH and Ca concentrations differed most between the treatments (Table 2). About 6000 kg ha–1 of lime increased soil pHCaCl2, on average, 0.4 to 1 units. In the organic layer, soil pH was higher in the P and NP treatment than in the control and N treatment probably due to extra Ca added in P fertilizer (Table 2).
According to the F values from ANOVA, liming had the most striking effect on amounts of soil Ca; but N and P fertilisation also increased the amounts of the respective elements (Table 3). The amount of total Ca seemed to be higher in the organic layer in the NL (L = lime), PL and NPL treatments compared to the L-alone treatment, perhaps due to extra Ca in the N and P fertilisers; in ammonium nitrate-based N fertilisers the amount of Ca was 3–6% and in superphosphate 20%. In addition, the amount of total P in the organic layer tended to be higher in the combined NP and NPL treatments than in the P treatment, perhaps due to the higher mass of the organic layer in the N-fertilised plots.
Nitrogen fertilisation increased the concentrations of N, and decreased the C/N ratio and pH both in the organic layer and in the 0–10 cm layer of mineral soil (Tables 4 and 5). According to the N equation in Table 4, the N concentration of the organic layer would have increased from 11.7 g kg–1 (no N) to 14.8 or to 17.7 g kg–1 with the N dose 1000 or, respectively, with the N dose 2000 kg ha–1. The corresponding C/N ratios would have been 37, 32 and 26. According to the pH equations, the N dose 2000 kg ha–1 would have lowered the pHCaCl2 in the organic layer from 3.1 (no N) to 3.0, and in the 0–10 cm mineral soil layer from 4.0 to 3.5. Similarly, N fertilisation tended to decrease the concentrations of AAA-extractable P and K and total K. For instance, with the N dose 2000 kg ha–1 the AAA- extractable concentration of P in the organic layer would have decreased from 222 to 154 mg kg–1 (Table 5). In both soil layers, P fertilisation increased total and AAA- extractable concentrations of P (Tables 4 and 5). Liming increased both pH and the concentrations of Ca, but decreased the AAa- extractable concentrations of P in both soil layers. In the organic layer, liming also decreased the concentrations of N and KAAA (Tables 4 and 5).
| Table 4. Regression equations for total concentrations of elements as a function of cumulative amounts of fertilisers, and site and tree-stand properties. All coefficients are statistically significant (p < 0.05). | ||||||||
| Dependent variables | ||||||||
| Organic layer | Mineral soil 0–10 cm | |||||||
| Independent variables a) | Ntot g kg–1 | C/N | lnCatot mg kg–1 | Ktot mg kg–1 | Ptot mg kg–1 | ln(Ntot+1) g kg–1 | C/N | |
| Constant b) | –4.61 | 50.9 | 7.16 | 237 | 316 | –.278 | 22.3 | |
| N, Mg ha–1 | 3.07 | –5.76 | –116 | .0820 | –1.40 | |||
| P, kg ha–1 | .000849 | 1.47 | ||||||
| Lime, Mg ha–1 | –.208 | .167 | ||||||
| Ol. thickn., cm | 1.22 | |||||||
| Stand age, a | .0978 | .00701 | 5.77 | 5.56 | ||||
| Pine (0/1) | –2.24 | 8.09 | –129 | –.278 | 3.10 | |||
| Tempsum, d.d. | .00703 | –.0197 | .000896 | |||||
| Fines, % | .0107 | 3.47 | 4.72 | .00680 | ||||
| Stones, % | .0531 | |||||||
| R2 (obs./pred.) | .667 | .738 | .688 | .441 | .619 | .667 | .256 | |
| a) N = cumulative amount of fertilised nitrogen, P = cumulative amount of fertilised phosphorus, Lime = cumulative amount of spread lime, Ol. thickn. = mean organic layer thickness on plots not fertilised with nitrogen, Stand age = stand age at year 2009, Pine = 1, if pine, 0 if spruce, Tempsum = average effective temperature sum, Fines = sum of clay + silt, i.e. under 63 µm fraction, Stones = Volumetric percentage of stones. b) In the logaritmic models the constant has been adjusted to yield the original arithmetic mean by adding a residual variance of the regression model, constant + sf2/2. | ||||||||
| Table 5. Regression equations for pH and concentrations of elements extracted with acid ammonium acetate as a function of cumulative amounts of fertilisers and site and tree-stand properties. All coefficients are statistically significant. | |||||||||||
| Dependent variables | |||||||||||
| Organic layer | Mineral soil 0–10 cm | ||||||||||
| Independent variables a) | pHCaCl2 | CaAAA mg kg–1 | KAAA mg kg–1 | PAAA mg kg–1 | pHCaCl2 | lnCaAAA mg kg–1 | lnKAAA mg kg–1 | lnPAAA mg kg–1 | |||
| Constant b) | 3.88 | 2879 | 932 | 163 | 3.31 | 4.00 | 2.29 | 1.97 | |||
| N, Mg ha–1 | –.0874 | –135 | –33.7 | –.248 | –.207 | ||||||
| P, kg ha–1 | .412 | .00295 | |||||||||
| Lime, Mg ha–1 | .139 | .562 | –6.46 | –4.75 | .114 | .360 | –.0464 | ||||
| Ol. thickn., cm | –.120 | –.240 | –.163 | –.150 | |||||||
| Stand age, a | 5.27 | ||||||||||
| Pine (0/1) | –.342 | –1222 | .421 | ||||||||
| Tempsum, d.d. | –.495 | .000855 | |||||||||
| Fines, % | 1.96 | .0101 | .0292 | .0189 | .0231 | ||||||
| Stones, % | .00565 | ||||||||||
| R2 (obs./pred.) | .811 | .756 | .442 | .346 | .646 | .575 | .583 | .540 | |||
| a) N = cumulative amount of fertilised nitrogen, P = cumulative amount of fertilised phosphorus, Lime = cumulative amount of spread lime, Ol. thickn. = mean organic layer thickness on plots not fertilised with nitrogen, Stand age = stand age at year 2009, Pine = 1, if pine, 0 if spruce, Tempsum = average effective temperature sum, Fines = sum of clay + silt, i.e. under 63 µm fraction, Stones = Volumetric percentage of stones. b) In the logaritmic models the constant has been adjusted to yield the original arithmetic mean by adding a residual variance of the regression model, constant + sf2/2. | |||||||||||
Nitrogen fertilisation increased the mass of the organic layer and the amount of C and consequently the amounts of most elements in the organic layer (Tables 6 and 7) because the mass of the organic layer systematically correlated with the amounts of all elements from K (r = 0.53) to C (r = 0.81). According to the C equation in Table 6, the N dose 2000 kg ha–1 would have increased the amount of C in the organic layer from 18 (no N fertiliser) to 27 Mg ha–1. Correspondingly, the N dose 1000 or 2000 kg ha–1 would have increased the amount of N in the organic layer from 454 (no N) to 699 or 944 kg ha–1, respectively.
Phosphorus fertilisation increased the amounts of P in both the organic and the mineral soil layers, and the amount of Ca in the organic layer (Table 6 and 7). In the organic layer, liming increased the amounts of total and AAA- extractable Ca and total K but decreased the amounts of C and N (Tables 6 and 7). In the mineral soil, liming increased the amounts of C and CaAAA and decreased the amounts of PAAA (Tables 6 and 7).
| Table 6. Regression equations for total amounts of elements as a function of cumulative amounts of fertilisers, and site and tree-stand properties. All coefficients are statistically significant. | |||||||
| Dependent variables | |||||||
| Organic layer | Mineral soil 0–10 cm | ||||||
| Independent variables a) | Ctot kg ha–1 | Ntot kg ha–1 | lnCatot kg ha–1 | Ktot kg ha–1 | Ptot kg ha–1 | lnCtot, kg ha–1 | lnNtot, kg ha–1 |
| Constant b) | 8898 | 579 | 5.01 | 35.7 | 39.7 | 8.21 | 5.28 |
| N, Mg ha–1 | 4476 | 245 | .139 | 6.31 | .104 | .158 | |
| P, kg ha–1 | .000829 | .0727 | |||||
| Lime, Mg ha–1 | –229 | –4.10 | .181 | .325 | .00769 | ||
| Tempsum, d.d. | .00148 | .00134 | |||||
| Ol. thickn., cm | 2562 | ||||||
| Fines, % | .00957 | .00845 | |||||
| Pine (0/1) | –125 | –.338 | –8.01 | –.278 | –.405 | ||
| R2 (obs./pred.) | .400 | .544 | .593 | .192 | .468 | .578 | .641 |
| a) N = cumulative amount of fertilised nitrogen, P = cumulative amount of fertilised phosphorus, Lime = cumulative amount of spread lime, Ol. thickn. = mean organic layer thickness on plots not fertilised with nitrogen, Pine = 1, if pine, 0 if spruce, Tempsum = average effective temperature sum, Fines = sum of clay + silt, i.e. under 63 µm fraction. b) In the logaritmic models the constant has been adjusted to yield the original arithmetic mean by adding a residual variance of the regression model, constant + sf2/2. | |||||||
| Table 7. Regression equations for elemental amounts extracted with acid ammoníum acetate as a function of cumulative amounts of fertilisers and site and tree-stand properties. All coefficients are statistically significant. | ||||||||||
| Dependent variables | ||||||||||
| Organic layer | Mineral soil 0–10 cm | |||||||||
| Independent variables a) | CaAAA kg ha–1 | KAAA kg ha–1 | PAAA kg ha–1 | SAAA kg ha–1 | lnCaAAA kg ha–1 | lnKAAA kg ha–1 | lnPAAA kg ha–1 | SAAA kg ha–1 | ||
| Constant b) | 121 | 23.9 | –5.65 | –2.34 | 5.78 | 2.43 | 1.649 | 2.823 | ||
| N, Mg ha–1 | 19.2 | 1.14 | .756 | –.206 | .0854 | .201 | ||||
| P, kg ha–1 | .0193 | .00283 | .00302 | |||||||
| Lime, Mg ha–1 | 29.4 | –.113 | .36 | –.0477 | –.0983 | |||||
| Tempsum, d.d. | .000781 | |||||||||
| Ol. thickn., cm | 3.78 | 2.29 | .786 | –.305 | –.118 | |||||
| Fines, % | .0246 | .012 | .0165 | |||||||
| Stones, % | –.0065 | –.00832 | ||||||||
| Pine (0/1) | –59.8 | –8.28 | –2.86 | |||||||
| Stand age, a | .123 | .065 | –.024 | .0114 | ||||||
| R2 (obs./pred.) | .67 | .235 | .469 | .348 | .624 | .505 | .433 | .380 | ||
| a) N = cumulative amount of fertilised nitrogen, P = cumulative amount of fertilised phosphorus, Lime = cumulative amount of spread lime, Ol. thickn. = mean organic layer thickness on plots not fertilised with nitrogen, Stand age = stand age at year 2009, Pine = 1, if pine, 0 if spruce, Tempsum = average effective temperature sum, Fines = sum of clay + silt, i.e. under 63 µm fraction, Stones = Volumetric percentage of stones. b) In the logaritmic models the constant has been adjusted to yield the original arithmetic mean by adding a residual variance of the regression model, constant + sf2/2. | ||||||||||
There was a significant negative correlation between the time period from most recent fertilisation and the total amount of nutrient added in fertiliser. Consequently, possible effect of the time period from most recent N or P fertilization on the results was surpassed by the total amount of corresponding nutrient added during the study.
We estimated that, on average, 7% of P, 21% of Ca and 25% of N added in fertilisers was found in the organic layer, and 39% of added N was found in the organic + 0–10 cm mineral soil layer. The fertiliser N found, i.e. the relative surplus of N in the organic layer, correlated positively with the C/N ratio in the organic layer (Fig. 3).
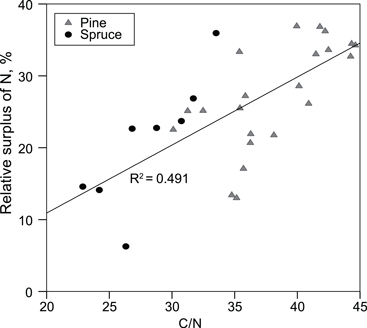
Fig. 3. Relative surplus of N in the organic layer, i.e. (amount of N on the fertilised plots – amount of N on the non-fertilised plots)/amount of N in fertilisers, as a function of the C/N ratio in the organic layer on the unfertilized plots.
4 Discussion
Trees, other plants and microbes use fertiliser N quickly, because N is a growth-limiting nutrient that circulates tightly within boreal forest ecosystem (Nömmik and Möller 1981; Nömmik and Larsson 1989; Preston and Mead 1994; Weetman et al. 1997; Tamm et al. 1999). Fertiliser N increases production and annual above- and below-ground litter deposition 5 to 10 years after each fertilisation (Kukkola and Saramäki 1983; Mälkönen et al. 1980; Lipas 1988; Mäkipää 1994; Helmisaari and Hallbäcken1998; Högberg et al. 2006; Jacobson and Pettersson 2010). In carefully selected Finnish coniferous stands, N application (150 kg ha–1) usually gives a growth increase of 12–20 m3 ha–1 (Saarsalmi and Mälkönen 2001; Nohrstedt 2001).
Long-term N fertilisation favours more demanding understorey plants, i.e. herbs and grasses, rather than dwarf shrubs and mosses (Mälkönen et al. 1980; Mäkipää 1994), producing faster-decomposable litter with a lower C/N ratio. On the other hand, N fertilisation seems to decrease microbial biomass and activity, e.g. soil respiration and hence decomposition of litter (Söderström et al. 1983; Nohrstedt et al. 1989; Smolander et al. 1994; Olsson et al. 2005). The signs of long-term N fertilisation detected in the organic layer in our study, i.e. greater amounts of organic carbon and nitrogen and a lower C/N ratio, are probably due to greater and N-richer production of plant litter and retarded decomposition (Smolander et al. 2000). Because the C/N ratio in the organic layer decreased due to N fertilisation and because the C/N ratio correlates closely with tree-stand production (Urvas and Erviö 1974; Tamminen 1993; Chen et al. 1998; Yan et al. 2012), repeatedly N-fertilised sites have been temporarily moved to a higher level of productivity. In addition to N, the amounts of Ca, P and S in the organic layer were also somewhat higher on the N-fertilised plots, where the mass of the organic layer was increased due to fertilisation. This is in accordance with the results reported by Mälkönen et al. (1990). Decreased concentrations and amounts of K in the organic layer may indicate a dilution of K in tree and other plant tissues and litter due to N fertilisation, or it may be explained also by increased leaching of K due to liming.
In accordance with this study, Nohrstedt (1992) reported decreased concentrations of acid ammonium acetate-extractable P in the organic layer after long-term N fertilisation. In a Swedish experiment with Scots pine, however, repeated N addition, a total of 1800 kg ha–1, increased concentrations of ammonium acetate-extractable P in the organic layer (Ring et al. 2011). Repeated N fertilisation has not usually changed P concentrations in needles (Mälkönen et al. 1990; Jacobson and Nohrstedt 1993; Nilsen and Abrahamsen 2003; Jacobson and Pettersson 2010), although in some cases P concentrations have been increased (Jacobson and Pettersson 2010) or decreased (Mälkönen et al. 1990; Clarholm 1993).
The most common harmful side effects of N fertilisation are possible deficiency of B and growth disturbances due to the deficiency (Möller 1983; Jalkanen 1990; Jalkanen and Aalto 1993) and leaching of nitrate to ground water (Smolander et al. 1995; Johannisson et al. 1999; Ring et al. 2006; Bergh et al. 2008). A single normal dose of N fertilisation, 120 to 180 kg/ha will seldom cause significant leaching of nitrate or B deficiency; but repeated N fertilisation may, on the other hand, more likely cause leaching of nitrate and shortage of B and may also be seen in soil parameters, such as increased amounts of N and C and decreased C/N ratio.
In spite of the rather large addition of N, on average, 1100 kg ha–1 or 22 kg ha–1 a–1 in about 50 years, N fertilisation did not lead to signs of N saturation, in which case the C/N ratio in the organic layer is low, nitrate leaches from the surface to the deeper soil layers and tree stands do not respond positively to N fertilisation (Matzner and Grosholz 1997; Aber et al. 1998; Tietema et al. 1998). Retention of deposition N or fertiliser N seems to be related to the N status of the forest ecosystem, which can be measured, e.g. by determining the C/N ratio of the organic layer (Tietema et al. 1998). This means that when there is a shortage of N and the C/N ratio is high, extra N coming from outside the ecosystem will be retained in the system and not leach out of it.
Our estimate of the relative surplus of N in the surface soil, 39%, corresponds to the N fertiliser recovery reported by Preston and Mead (1994) from a lodgepole pine stand. In their material, eight growing seasons after single fertilisation (100 kg ha–1 of N with labelled isotopes) c. 40% of N from the fertiliser remained within the 0–30 cm soil layer.
In the present study the surplus P in the organic layer was small. Most of the fertilised P had probably been retained by the mineral soil (Cade-Menun et al. 2000) as well as by the tree stand. The surplus of Ca on the limed plots related to the added amounts of Ca, 21%, corresponded moderately to the figures of Derome et al. (1986), who estimated the Ca surpluses in the organic layer of pine and spruce stands to be 16 and 36%, respectively.
Long-term N fertilisation tended to acidify soil, although only weakly. The N fertiliser used most often, Finnish ammonium nitrate, contained some lime, on average, 0.7 Mg ha–1 (0.33 to 1.18 Mg ha–1), which according to the pH equations in Table 5 would raise the pHCaCl2 in the organic layer by 0.09 pH units (+0.05 to +0.16 units) and in the mineral soil by 0.08 units (0.04 to 0.13 units). However, according to these pH equations, containing independent variables N and lime doses, the N doses used would lower the pHCaCl2 in the organic layer from 0.05 (Nminimum = 534 kg ha–1) to 0.17 (Nmaximum = 1908 kg ha–1) and, on average, 0.10 pH units (Nmedian = 1092 kg ha–1), and in the 0–10 cm mineral soil layer from 0.13 to 0.47 and, on average, 0.27 pH units. Average changes in pHCaCl2 corresponded to increases in proton concentrations of 1.33*10–4 mol dm–3 in the organic layer and 1.13*10–4 mol dm–3 in the mineral soil. Our findings of increasing acidity in the mineral soil due to N fertilisation correspond to those of Mälkönen et al. (1990) and Högberg et al. (2006).
5 Conclusions
Nitrogen fertilisation over a period of 42 to 50 years led to larger amounts of organic matter, carbon and most nutrients and to a decrease in the C/N ratio in the surface soil, as was expected on the basis of earlier observations. The amounts of C and N were, on average, 30% and 56%, respectively, higher in the organic layer and 10% and 16%, respectively, higher in the 0–10 cm mineral soil layer on the N fertilised than on the unfertilised plots. A decrease in soil concentrations of K indicates a dilution of K in tree and plant tissues due to N fertilisation. But K has certainly not become a growth-limiting factor on upland sites even after the highest doses of N, i.e. 1908 kg/ha in c. 50 years or 37 kg ha–1 a–1. Nitrogen fertilisation may decrease pH, but only slightly.
Phosphorus fertilisation increased the concentrations and amounts of total and AAA- extractable P in the organic layer and in the 0–10 cm mineral soil layer. However, very little P was retained in the surface soil. As expected, liming increased the pH and the concentrations and amounts of Ca. Liming seemed to decrease concentrations and/or amounts of AAA-extractable K, P and S.
Long-term N fertilisation led to more or less useful changes in the chemistry of the surface soil, i.e. improved fertility and accumulation of carbon; but changes due to P fertilisation and liming are more or less useless from the standpoint of forest production.
Acknowledgements
The material of this study, 30 factorial experiments, is a heritage from previous generations of researchers. Considerable work has been done during the 50 years since these experiments were established. We are very grateful to have had this material at our disposal. Many thanks to the personnel of the Soil Department of the Finnish Forest Research Institute. We thank Dr. Joann von Weissenberg for checking the English language of this paper. We also would like to thank the Nordic Forest Research Cooperation Committee (SNS) for the financial support of soil chemical analysis of the study.
References
Aber J.D., MCDowell W., Nadelhoffer K., Magill A., Berntson G., Kamakea M., McNulty S., Currie W., Rustad L., Fernandez I. (1998). Nitrogen saturation in temperate forest ecosystems. Hypotheses revisited. Bioscience 48(11): 921–934. http://dx.doi.org/10.2307/1313296.
Aronsson A. (1983). Growth disturbances caused by B deficiency in some fertilized pine and spruce stands on mineral soils. Communicationes Instituti Forestalis Fenniae 116: 116–122.
Bergh J., Nilsson U., Grip H., Hedwall P.-O., Lundmark T. (2008). Effects of frequency of fertilisation on production, foliar chemistry and nutrient leaching in young Norway spruce stands in Sweden. Silva Fennica 42(5): 721–733.
Binkley D., Högberg P. (1997). Does atmospheric deposition of nitrogen threaten Swedish forests? Forest Ecology and Management 92: 119–152. http://dx.doi.org/10.1016/S0378-1127(96)03920-5.
Braekke F.H., Finér L. (1991). Fertilization effects on surface peat of pine bogs. Scandinavian Journal of Forest Research 6(1–4): 433–449. http://dx.doi.org/10.1080/02827589109382681.
Cade-Menun B.J., Berch S.M., Preston C.M. (2000). Phosphorus forms and related soil chemistry of Podzolic soils on northern Vancouver Island. I. A comparison of two forest types. Canadian Journal of Forest Research 30: 1714–1725. http://dx.doi.org/10.1139/x00-098.
Chen H.Y.H., Klinka K., Fons J., Krestov P.V. (1998). Characterization of nutrient regimes in some continental subalpine boreal forest soils. Canadian Journal of Soil Science 78(3): 467–475. http://dx.doi.org/10.4141/S98-002.
Clarholm M. (1993). Microbial biomass P, labile P, and acid phosphatase activity in the humus layer of a spruce forest, after repeated additions of fertilizers. Biology and Fertility of Soils 16: 287–292. http://dx.doi.org/10.1007/BF00369306.
Derome J., Kukkola M., Mälkönen E. (1986). Forest liming on mineral soils. Results of Finnish experiments. National Swedish Environmental Protection Board Report 3084. 107 p.
Derome J., Kukkola M., Smolander A., Lehto T. (2000). Liming of forest soils. In: Mälkönen E. (ed.). Forest condition in a changing environment – the Finnish case. Kluwer Academic Publishers. p. 328–337. http://dx.doi.org/10.1007/978-94-015-9373-1_39.
Derome J., Saarsalmi A., Kukkola M. (2009). Effects of nitrogen and sulphur “stress” treatment on soil acidity and growth response of a Scots pine stand. Boreal Environment Research 14(5): 861–874.
Ellenberg H. (1988). Floristic changes due to nitrogen deposition in Central Europe. In: Critical loads for sulphur and nitrogen. Report from a workshop held at Skokloster, Sweden, 19–24 March, 1988. 1988(15): 375–383.
Fransson A.-M., Bergkvist B. (2000). Phosphorus fertilisation causes durable enhancement of phosphorus concentrations in forest soil. Forest Ecology and Management 130(1–3): 69–76. http://dx.doi.org/10.1016/S0378-1127(99)00184-X.
Halonen O., Tulkki H., Derome J. (1983). Nutrient analysis methods. Metsäntutkimuslaitoksen tiedonantoja 121. 28 p.
Hedwall P.-O., Berg J., Nordin A., Bergh J. (2008). Decreased variation of forest understory vegetation is an effect of fertilisation in young stands of Picea abies. Scandinavian Journal of Forest Research 26 (Suppl 11): 46–55. http://dx.doi.org/10.1080/02827581.2011.564397.
Heinonen J. (1994). KPL – a computer programme package for computing stand and single tree characteristics from sample measurements. Finnish Forest Research Institute Research Papers 504. 80 p. [In Finnish with English summary].
Helmisaari H.-S., Hallbäcken L. (1998). Fine-root biomass and necromass in limed and fertilized Norway spruce (Picea abies (L.) Karst.) stands. Forest Ecology and Management 119: 99–110. http://dx.doi.org/10.1016/S0378-1127(98)00514-3.
Högberg P., Fan H., Quist M., Binkley D., Tamm C.O. (2006). Tree growth and soil acidification in response to 30 years of experimental nitrogen loading on boreal forest. Global Change Biology 12(3): 489–499. http://dx.doi.org/10.1111/j.1365-2486.2006.01102.x.
Ilvesniemi H. (1991). Spatial and temporal variation of soil chemical characteristics in pine sites in southern Finland. Silva Fennica 25(2): 99–108. http://dx.doi.org/10.14214/sf.a15600.
Jacobson S., Nohrstedt H.-Ö. (1993). Effects of repeated nitrogen supply on stem growth and nutrients in needles and soil. SkogForsk, Uppsala. Report 1. 18 p.
Jacobson S., Pettersson F. (2010). An assessment of different fertilization regimes in three boreal coniferous stands. Silva Fennica 44(5): 815–827.
Jalkanen R.(1990). Nitrogen fertilization as a cause of dieback of Scots pine at Paltamo, northern Finland. Aquilo Ser. Botanica 29: 25–31.
Jalkanen R., Aalto T. (1993). The effect of nitrogen fertilization on damage to and growth of Scots pine on a mineral soil site in Sodankylä, northern Finland. In: Jalkanen R., Aalto T., Lahti, M-L. (eds.). Forest pathological research in northern forests with a special reference to abiotic stress factors. Extended SNS meeting in forest pathology in Lapland, Finland, 3–7 August, 1992. Metsäntutkimuslaitoksen tiedonantoja 451: 61–76.
Järvinen O., Vänni T. (1990). Bulk deposition chemistry 1971–1988. In: Kauppi P., Anttila P., Kenttämies K. (eds.). Acidification in Finland. Springer Verlag. p. 151–161. http://dx.doi.org/10.1007/978-3-642-75450-0_8.
Johannisson C., Myrold D.D., Högberg P. (1999). Retention of nitrogen by a nitrogen-loaded Scots pine forest. Soil Science Society of America Journal 63: 383–389. http://dx.doi.org/10.2136/sssaj1999.03615995006300020017x.
Kaunisto S., Paavilainen E. (1988). Nutrient stores in old drainage areas and growth of stands. Communicationes Instituti Forestalis Fenniae 145. 9 p.
Kilian W. (1981). Erfahrungen und Probleme bei der Anwendung der Bodenuntersuchungen zur Standortsbeurteilung. Mitteilungen der Forstlichen Bundes-Versuchsanstalt Wien 140: 67–75.
Kukkola M., Nöjd P. (2000). Kangasmetsien lannoitusten tuottama kasvunlisäys Suomessa 1950–1998. [Increase in tree growth in years 1950–1998 in Finland on upland soils due to fertilization]. Metsätieteen aikakauskirja 2000(4): 603–612. [In Finnish].
Kukkola M., Saramäki J. (1983). Growth response in repeatedly fertilized pine and spruce stands on mineral soils. Communicationes Instituti Forestalis Fenniae 114. 55 p.
Lipas E. (1988). Typpilannoituksen ajankohta kangasmetsissä. Timing of nitrogen fertilization on mineral soils. Folia Forestalia 709. 22 p. [In Finnish with English summary].
Laasasenaho J. (1982). Taper curve and volume functions for pine, spruce and birch. Communicationes Instituti Forestalis Fenniae 108. 74 p.
Lockman R.B., Molloy M.G. (1984). Seasonal variations in soil test results. Communications in Soil Science and Plant Analysis 15(7): 741–757. http://dx.doi.org/10.1080/00103628409367514.
Lundell Y. (1987). Nutrient variation in forest soil samples due to time of sampling and method of storage. Plant and Soil 98(3): 363–375. http://dx.doi.org/10.1007/BF02378358.
Mäkipää R. (1994). Effects of nitrogen fertilization on the humus layer and ground vegetation under closed canopy in boreal coniferous stands. Silva Fennica 28(2): 81–94. http://dx.doi.org/10.14214/sf.a9164.
Mäkipää R. (1995). Effect of nitrogen input on carbon accumulation of boreal forest soils and ground vegetation. Forest Ecology and Management 79(3): 217–226. http://dx.doi.org/10.1016/0378-1127(95)03601-6.
Mälkönen E. (1990). Estimation of nitrogen saturation on the basis of long-term fertilization experiments. Plant and Soil 128: 75–82. http://dx.doi.org/10.1007/BF00009398.
Mälkönen E., Kellomäki S., Holm J. (1980). Typpi-, fosfori- ja kalilannoituksen vaikutus kuusikon pintakasvillisuuteen. Effect of nitrogen, phophorus and potassium fertilization on ground vegetation in Norway spruce stands. Communicationes Instituti Forestalis Fenniae 98(3). 35 p. [In Finnish with English summary].
Mälkönen E., Derome J., Kukkola M. (1990). Effects of nitrogen inputs on forest ecosystems. Estimation based on long-term fertilization experiments. In: Kauppi P., Anttila P., Kenttämies K. (eds.). Acidification in Finland. Springer-Verlag, Berlin–Heidelberg. p. 325–349. http://dx.doi.org/10.1007/978-3-642-75450-0_17.
Matzner E., Grosholz C. (1997). Beziehung zwischen NO3-Austrägen, C/N-Verhältnissen der Auflage und N-Einträgen in Fichtenwald (Picea abies Karst.). Forstwissenschaftliches Centralblatt 116: 39–44. http://dx.doi.org/10.1007/BF02766880.
Moilanen M. (2005). Suometsien lannoitus. In: Ahti E., Kaunisto S., Moilanen M., Murtovaara I. (eds.). Suosta metsäksi. Suometsien ekologisesti ja taloudellisesti kestävä käyttö. Tutkimus-ohjelman loppuraportti. [From peatland to forest. Ecologically and economically sustainable use of peatland forests. Final report of the research project]. Metsäntutkimuslaitos, Vantaa. Metsäntutkimuslaitoksen tiedonantoja 947: 134–166. [In Finnish].
Möller G. (1983). Variation of boron concentration in pine needles from tree growing on mineral soil in Sweden and response to nitrogen fertilization. Communicationes Instituti Forestalis Fenniae 116: 111–115.
Nilsen P. (2001). Fertilization experiments on forest mineral soils: a review of the Norwegian results. Scandinavian Journal of Forest Research 16(6): 541–554. http://dx.doi.org/10.1080/02827580152699376.
Nilssen P., Abrahamsen G. (2003). Scots pine and Norway spruce stands responses to annual N, P and Mg fertilization. Forest Ecology and Management 174: 221–232. http://dx.doi.org/10.1016/S0378-1127(02)00024-5.
Nohrstedt H.-Ö. (1992). Soil chemistry in a Pinus sylvestris stand after repeated treatment with two types of ammoniun nitrogen fertilizer. Scandinavian Journal of Forest Research 7: 457–462. http://dx.doi.org/10.1080/02827589209382738.
Nohrstedt H.-Ö. (2001). Response of coniferous forest ecosystems on mineral soils to nutrient additions: a review of Swedish experiences. Scandinavian Journal of Forest Research 16(6): 555–573. http://dx.doi.org/10.1080/02827580152699385.
Nohrstedt H.-Ö., Arnebrand K., Bååth E., Söderström B. (1989). Changes in carbon content, respiration rate, ATP content, and microbial biomass in nitrogen-fertilized pine forest soil in Sweden. Canadian Journal of Forest Research 19: 323–328. http://dx.doi.org/10.1139/x89-048.
Nömmik H., Larsson K. (1989). Assessment of fertilizer nitrogen accumulation in Pinus sylvestris trees and retention in soil by 15N recovery technique. Scandinavian Journal of Forest Research 4: 427–442. http://dx.doi.org/10.1080/02827588909382579.
Nömmik H., Möller G. (1981). Nitrogen recovery in soil and needle biomass after fertilization of a Scots pine stand, and growth responses obtained. Studia Forestalia Suecica 159. 37 p.
Olsson P., Linder S., Giesler R., Högberg P. (2005). Fertilization of boreal forest reduces both autotrophic and heterotrophic soil respiration. Global Change Biology 11(10): 1745–1753. http://dx.doi.org/10.1111/j.1365-2486.2005.001033.x.
Preston C.M., Mead D.J. (1994). Growth response and recovery of 15N-fertilizer one and eight growing seasons after application to lodgepole pine in British Columbia. Forest Ecology and Management 65(2–3): 219–229. http://dx.doi.org/10.1016/0378-1127(94)90172-4.
Ring E., Jacobson S., Högbom L. (2011). Long-term effects of nitrogen fertilization on soil chemistry in three Scots pine stands in Sweden. Canadian Journal of Forest Research 41(2): 279–288. http://dx.doi.org/10.1139/X10-208.
Ring E., Jacobson S., Nohrstedt H.-Ö. (2006). Soil-solution chemistry in a coniferous stand after adding wood ash and nitrogen. Canadian Journal of Forest Research 36(1): 153–163. http://dx.doi.org/10.1139/x05-242.
Roberts B.A., Deering K.W., Titus B.D. (1998). Effects of intensive harvesting on forest floor properties in Betula papyrifera stands in Newfoundland. Journal of Vegetation Science 9(4): 521–528. http://dx.doi.org/10.2307/3237267.
Saarsalmi A., Levula T. (2007). Wood ash application and liming: effects on soil chemical properties and growth of Scots pine transplants. Baltic Forestry 13(2): 149–157.
Saarsalmi A., Mälkönen E. (2001). Forest fertilization research in Finland: a literature review. Scandinavian Journal of Forest Research 16(6): 514–535. http://dx.doi.org/10.1080/02827580152699358.
Saarsalmi A., Tamminen P. (2005). Boron, phosphorus and nitrogen fertilization in Norway spruce stands suffering from growth disturbances. Silva Fennica 39(3): 351–364.
Saarsalmi A., Tamminen P., Kukkola M., Levula T. (2011). Effects of liming on chemical properties of soil, needle nutrients and growth of Scots pine transplants. Forest Ecology and Management 262: 278–285. http://dx.doi.org/10.1016/j.foreco.2011.03.033.
Sikström U., Albrektsson A., Näsholm T., Bergh J. (2001). Effekter på skogsproduktion av markförsurningen och motåtgärder. [Effects of soil acidification and countermeasures on forest production]. Skogstyrelsen, Rapport 11F/2001. 44 p.
Smolander A., Kurka A., Kitunen V., Mälkönen E. (1994). Microbial biomass C and N, and respiratory activity in soil of repeatedly limed and N- and P-fertilized Norway spruce stands. Soil Biology & Biochemistry 26: 957–962. http://dx.doi.org/10.1016/0038-0717(94)90109-0.
Smolander A., Kitunen V., Priha O., Mälkönen E. (1995). Nitrogen transformations in limed and nitrogen fertilized soil in Norway spruce stands. Plant and Soil 172(1): 107–115. http://dx.doi.org/10.1007/BF00020864.
Smolander A., Kukkola M., Helmisaari H.-S., Mäkipää R., Mälkönen E. (2000). Functioning of forest ecosystems under nitrogen loading. In: Mälkönen E. (ed.). Forest condition in a changing environment – the Finnish case. Kluwer Academic Publishers. p. 229–247. http://dx.doi.org/10.1007/978-94-015-9373-1_27.
Söderström B., Bååth E., Lundgren B. (1983). Decrease in soil microbial activity and biomasses owing to nitrogen amendments. Canadian Journal of Microbiology 29(11): 1500–1506. http://dx.doi.org/10.1139/m83-231.
Strengbom J., Nordin A. (2008). Commercial forest fertilization causes long-term residual effects in ground vegetation of boreal forests. Forest Ecology and Management 256: 2175–2181. http://dx.doi.org/10.1016/j.foreco.2008.08.009.
Tamm C.O. (1991). Nitrogen in terrestial ecosystems. Questions of productivity, vegetational changes, and ecosystem stability. Ecological Studies 81. Springer, Berlin. 115 p.
Tamm C.O., Aronsson A., Popovic B., Flower-Ellis J. (1999). Optimum nutrition and nitrogen saturation in Scots pine stands. Studia Forestalia Suecica. Series Optimum nutrition and nitrogen saturation in Scots pine stands 206. Swedish University of Agricultural Sciences, Uppsala. 126 p.
Tamminen P. (1991). Kangasmaan ravinnetunnusten ilmaiseminen ja viljavuuden alueellinen vaihtelu. Expression of soil nutrient status and regional variation in soil fertility of forested sites in southern Finland. Folia Forestalia 777. 40 p. [In Finnish with English summary].
Tamminen P. (1993). Pituusboniteetin ennustaminen kasvupaikan ominaisuuksien avulla Etelä-Suomen kangasmetsissä. Estimation of site index for Scots pine and Norway spruce stands in South Finland using site properties. Folia Forestalia 819. 26 p. [In Finnish with English summary].
Tamminen P., Derome J. (2005). Temporal trends in chemical parameters of upland forest soils in southern Finland. Silva Fennica 39(3): 313–330.
Tietema A., Boxman A.W., Bredemeier M., Emmett B.A., Moldan F., Gundersen P., Schleppig P., Wright R.F. (1998). Nitrogen saturation experiments (NITREX) in coniferous forest ecosystems in Europe: a summary of results. Environmental Pollution 102(S1): 433–437. http://dx.doi.org/10.1016/S0269-7491(98)80065-1.
Urvas L., Erviö R. (1974). Metsätyypin määräytyminen maalajin ja maaperän kemiallisten ominaisuuksien perusteella. Influence of the soil type and the chemical properties of soil on the determining of the forest type. Journal of the Scientific Agricultural Society of Finland 46: 307–319.
Viro P. (1951). Nutrient status and fertility of forest soil. I. Pine stands. Communicationes Instituti Forestalis Fenniae 39(4). 54 p.
Viro P. (1952). Kivisyyden määrittämisestä. On the determination of stoniness. Communicationes Instituti Forestalis Fenniae 40(3). 23 p. [In Finnish with English summary].
Viro P. (1967). Forest manuring on mineral soils. Meddelelser fra Det norske skogforsøksvesen 85: 113–136.
Viro P. (1972). Die Walddüngung auf Finnischen Mineralböden. Folia Forestalia 138. 19 p. [In German].
Weetman G.F., Prescott C.E., Kohlberger F.L., Fournier R.M. (1997). Ten-year growth response of coastal Douglas-fir on Vancouver Island to N and S fertilization in an optimum nutrition trial. Canadian Journal of Forest Research 27: 1478–1482. http://dx.doi.org/10.1139/x97-105.
Yan E.-R., Hu Y.-L., Salifu F., Tan X., Chen Z.C., Chang S.X. (2012). Effectiveness of soil N availability indices in predicting site productivity in the oil sands region of Alberta. Plant and Soil 359(1–2): 215–231. http://dx.doi.org/10.1007/s11104-012-1202-y.
Total of 76 references
