Juha Heiskanen  ,
Ville Hallikainen,
Jori Uusitalo,
Hannu Ilvesniemi
,
Ville Hallikainen,
Jori Uusitalo,
Hannu Ilvesniemi
Co-variation relations of physical soil properties and site characteristics of Finnish upland forests
Heiskanen J., Hallikainen V., Uusitalo J., Ilvesniemi H. (2018). Co-variation relations of physical soil properties and site characteristics of Finnish upland forests. Silva Fennica vol. 52 no. 3 article id 9948. https://doi.org/10.14214/sf.9948
Highlights
- Atmospheric temperature sum is related to site index H100 as a covariate
- Soil pH and water retention at field capacity (FC) are also closely related to H100
- Fine fraction is related to water retention at FC, soil layer and site type
- Fine fraction co-varies also with temperature sum, H100 and slope.
Abstract
Physical soil properties have a marked influence on the quality of forest sites and on the preconditions for forest growth and management. In this study, water retention characteristics (WRC) and related physical soil properties in addition to vegetation coverage and tree stand data were studied at upland forest sites in Finland. Fixed and mixed models between soil and site characteristics were formed to estimate physical and hydrologic soil characteristics and the site quality with indirect co-varying variables. In the present data, the site quality index (H100) shows a high coefficient of determination in respect to the temperature sum. It is also related to soil fine fraction content, topsoil pH and water retention at field capacity. The thickness of the humus layer is predictable from the pH and cover of xeric and mesic plant species. The soil fine fraction content (clay + silt) is closely related to water retention at field capacity, the soil layer and site type, and without WRC to the temperature sum and site index and type, as well as the slope angle. The soil bulk density is related to organic matter, depth (layer) or alternatively to organic matter, slope and field estimated textural class (fine, medium, coarse). Water retention characteristics were found to be best determinable by the fine fraction content, depth and bulk density. Water content and air-filled porosity at field capacity are closely related to the fine fraction. This study provides novel models for further investigations that aim at improved prediction models for forest growth, hydrology and trafficability.
Keywords
site quality;
vegetation;
bulk density;
trafficability;
particle size;
humus layer;
water retention
-
Heiskanen,
Natural Resources Institute Finland (Luke), Soil ecosystems, Neulaniementie 5, FI-70100 Kuopio, Finland
E-mail
juha.heiskanen@luke.fi
- Hallikainen, Natural Resources Institute Finland (Luke), Applied statistical methods, Eteläranta 55, FI-96300 Rovaniemi, Finland E-mail ville.hallikainen@luke.fi
- Uusitalo, Natural Resources Institute Finland (Luke), Forest technology and logistics, Korkeakoulunkatu 7, FI-33720 Tampere, Finland E-mail jori.uusitalo@luke.fi
- Ilvesniemi, Natural Resources Institute Finland (Luke), Biorefinery and bioproducts, Tietotie 2, FI-02150 Espoo, Finland E-mail hannu.ilvesniemi@luke.fi
Received 11 January 2018 Accepted 27 June 2018 Published 29 June 2018
Views 159275
Available at https://doi.org/10.14214/sf.9948 | Download PDF

Supplementary Files
1 Introduction
Accurate spatial information on the quality (productivity) and properties of forest sites is essential for forestry management. Site quality indicating the growth potential of the forest soil is expressed in Finland typically using forest site types based on vegetation (Cajander 1949) and the site index (H100) based on the dominant height of the trees with largest diameter at 1.3 m (DBH) at the projected age of 100 years (Gustavsen 1980; Vuokila and Väliaho 1980). Forest stands and the ground vegetation tend to form according to the climatic and edaphic conditions (Cajander 1949; Childs and Flint 1990; Sims et al. 1996; Wang and Klinka 1996; Salemaa et al. 2008). Thus, the nutritional, thermal and hydrological regimes of the soil markedly affect the site quality. The hydrological conditions of a site depend not only on the physical properties of the soil, but also on the topographical location and the ambient weather conditions (Childs and Flint 1990; Nyberg 1996; Mäkitalo 2009; Campbell et al. 2013).
High-resolution data on weather conditions (precipitation, temperature, evapotranspiration) are of major importance in estimating the annual growth changes in forests (Mäkinen et al. 2002; Henttonen et al. 2014). In the Nordic countries, the temperature and precipitation regimes are predicted to change in the future due to the climate change whereupon the soil water content during the growth and dormant seasons, as well as the amount and timing of snow cover, soil frost and the soil bearing capacity may alter markedly. This means the preconditions for forest growth and forest management operations will undergo changes as well. Recent studies have indicated that, in addition to high-resolution weather data, accurate soil hydrological information are also needed to describe site quality and forest growth prerequisites more accurately (Henttonen et al. 2014; Peltoniemi et al. 2015).
The hydrological soil properties and conditions affect the terrain trafficability, which is one of the key requirements for the use of machinery in forest harvesting, silvicultural operations, soil preparation and planting for reforestation (Uusitalo et al. 2015, 2018; Niemi et al. 2017). Knowledge of the soil strength and bearing capacity is required, e.g., for wood procurement planning and for the prevention of subsequent soil damage (Niemi et al. 2017). The soil strength and bearing capacity is commonly determined as the penetration resistance, which depends mainly on the soil bulk density, in addition to the clay and water content (Ayers and Perumpral 1982; Vaz et al. 2011; Pirnazaro et al. 2012; Uusitalo et al. 2015, 2018). Thus, physical and hydrological soil data are needed also for accurate determination of terrain trafficability.
In Finland, forest soil types and mean particle size classes are assessed by visual and tactile evaluation in the Finnish National Forest Inventory (NFI), which is based on a sampling method carried out on field sample plots (Tomppo et al. 2011). The soil type is classified in the following categories: organic soil, bedrock, stony soil (or boulder field), glacial till, and sorted soil. For glacial till and sorted soil, three main categories are determined according to the median particle size (Mälkönen 2003). In fine-grained soils, the median grain size is smaller than 0.06 mm, reflecting a high silt and clay content. Medium-grained soils are sandy (0.06–2 mm), and the median particle size of coarse-gravelly soils is 2–20 mm.
The proportion of forest land on mineral soils is estimated to be 72% in southern Finland and 81% in northern Finland (Tomppo et al. 2011). The most common mineral forest soil in Finland is a glacial till with a medium texture, which cover 63% and 75% of the forest land area on mineral soils in southern and northern Finland, respectively. Sorted soil (such as alluvial or aeolian soils with narrow particle size distribution) is the next most common mineral soil class covering 23% of the area of mineral soil forests in southern Finland and 17% in northern Finland. The most frequent soil types (according to World reference base soil classification system, WRB) are Podzols (50%), Histosols (25%), Arenosols (11%) and Leptosols (9%) (Tamminen and Tomppo 2008). Finer-textured soils, Cambisols (1.9%), Gleysols (1.4%) and Regosols (1.2%), have only a small proportion.
Despite the fact that the Finnish NFI covers all the forest area of Finland, it does not contain information of many edaphic determinants, which are important for tree growth and practical forestry management and are difficult to detect indirectly without laboratory analyses, such as soil physical and chemical or climatic and topographic attributes. For example, no measurements of soil water content or water retention characteristics are made in the NFI. Thus, there is a lack of feasible information on the relations between soil and site properties for forestry management, such as silviculture, trafficability and forest growth estimation.
The aim of this study is firstly to examine the co-variation relations of physical soil and site characteristics. Secondly, these characteristics are examined if they can provide novel relevant information and input parameters from indirect explanatory variables for operational and ecological modelling and practice in forestry management in Finland. The focus was therefore to determine predictive models of co-variation relations rather than to discuss in detail the causalities and ecological meanings of all factors involved. Thus, a chosen available set of soil water retention characteristics, related physical soil properties and site characteristics for upland forest sites were studied on a subset of permanent sample plots of the 8th Finnish National Forest Inventory (NFI). Transfer functions (fixed and mixed models) between the soil and site characteristics were formed to achieve relevant models from indirect explanatory variables. These functions and models can be applied on all sites measured in NFI and on other data containing the required information. Possibilities using our models as improved prediction tools of the changes in forest growth, hydrological and trafficability conditions are discussed.
2 Materials and methods
2.1 Field data collection
Under the EU BioSoil project, upland forest soils in Finland were inventoried in the 2006–2007 period (Tamminen and Ilvesniemi 2013). The plots measured in the BioSoil project were a subset of the permanent plots of the 8th NFI (done in 1985–86) sites. The sampling network was relatively dense in southern Finland (16 km × 16 km), but was sparser in Lapland (24 km × 32 km). In the BioSoil project, 636 plots (each 400 m2 in area) of the total of about 3000 NFI plots were measured, and over 6000 plots in all in Europe.
The rod penetration method (Viro 1952) was applied to estimate the volumetric percentage of stones in the upper 30 cm of the soil in the study plots. The particle size was sampled from two soil layers (10–20 cm and 20–40 cm) for each sample plot. Besides the BioSoil data, a set of undisturbed mineral soil samples have been previously collected for determining the water retention characteristics and related physical soil properties. On a representative subset of plots with low to moderate stoniness, cylindrical soil cores (d = 58, h = 60 mm) were taken from the depths of 0–6 cm and 30–35 cm (sampling depths differ from the NFI soil sample depths; partly due to the physical dimensions of the sampling cores). Altogether 82 plots with complete soil and vegetation data were available for the study (Fig. 1; Supplementary file S1).
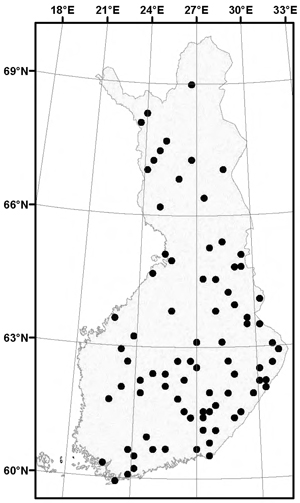
Fig. 1. Locations of the study plots with all available measured data (n = 82; map projection: Gauss_Kruger; Finland_Zone_3, central meridian: 27.0).
Dominant heights (m) for forest stands were estimated at the age of 100 years (i.e. H100), which represents the site quality and fertility (Gustavsen 1980; Vuokila and Väliaho 1980). The stand age and height of the 100 largest trees at breast height per ha were determined regardless of the tree species and then estimated for the age of 100 year using equations for height development of the dominant trees. The site type was determined separately using the site-type classification (Cajander 1949; Miina et al. 2009) including herb-rich forests (Oxalis-Maianthemum and Oxalis-Myrtillus type), mesic heath forests (Myrtillus type), sub-xeric heath forests (Vaccinium type), xeric heath forests (Calluna type) and barren heath forests (Cladina type) (Table 1). The coverage of each plant species was determined for each sample plot.
| Table 1. Descriptive statistics of the main used variables. Soil characteristics are averaged (mean of soil layers). | |||||
| Variable | Min | Max | Mean | Median | Standard deviation |
| Altitude (m a.s.l.) | 10 | 290 | 134.63 | 120 | 67.24 |
| Average temperature sum (d.d., at 2 m, threshold 5 oC) | 807 | 1746 | 1383.91 | 1425.5 | 235.91 |
| Slope (degree) | 0 | 26 | 4.89 | 4 | 5.67 |
| Thickness of humus layer (cm) | 0.35 | 10.4 | 4.5 | 4.2 | 2.22 |
| Proportion of clay (<0.002 mm, %) | 0.4 | 31.78 | 3.21 | 2.3 | 4.41 |
| Proportion of silt (0.002–0.063 mm, %) | 2.5 | 74.6 | 29.53 | 28.82 | 16.41 |
| Proportion of sand (0.063–2 mm, %) | 7.47 | 97.17 | 67.26 | 69.08 | 19.18 |
| Proportion of gravel (>2 mm, %) | 0.04 | 32.34 | 8.52 | 7.04 | 6.72 |
| Fine fraction (<0.063 mm, %) | 2.90 | 92.57 | 32.74 | 30.98 | 19.18 |
| Bulk density (g cm–3) | 0.97 | 1.77 | 1.32 | 1.32 | 0.15 |
| Organic matter (%) | 0.42 | 10.85 | 2.67 | 2.37 | 1.89 |
| Topsoil pH (0–6 cm)* | 3.60 | 5.30 | 4.12 | 4.00 | 0.31 |
| Total porosity (=WC0, vol.%) | 32.85 | 64.00 | 49.8 | 49.7 | 5.6 |
| Water retention at –1 kPa (WC1, vol.%) | 8.09 | 51.20 | 36.78 | 38.47 | 7.43 |
| WR at –10 kPa (WC10, vol.%) | 3.93 | 40.80 | 22.12 | 22.46 | 9.67 |
| WR at –100 kPa (WC100, vol.%) | 0.67 | 33.28 | 13.18 | 12.71 | 7.02 |
| WR at –1500 kPa (WC1500, vol.%) | 0.55 | 16.06 | 6.67 | 6.40 | 4.13 |
| Air-filled porosity at –1 kPa (AFP1, vol.%) | 1.68 | 35.81 | 13.26 | 12.76 | 6.2 |
| Air-filled porosity at –10 kPa (AFP10, vol.%) | 2.57 | 40.93 | 27.86 | 29.29 | 9.27 |
| Age of forest stand (years) | 0 | 248 | 73.16 | 72.00 | 47.19 |
| Height of dominant trees at age of 100 years (H100) | 8.68 | 38.08 | 22.17 | 23.16 | 6.42 |
| Basal area of tree trunks (m2) | 0 | 33.37 | 17.93 | 19.20 | 9.33 |
| Volume of growing stock (m3 ha–1) | 0 | 366.35 | 148.83 | 142.34 | 98.39 |
| Proportion of Scots pine (%) | 0 | 100 | 52.87 | 55.02 | 41.27 |
| Proportion of Norway spruce (%) | 0 | 99.84 | 30.37 | 8.43 | 36.37 |
| Proportion of deciduous trees (%) | 0 | 100 | 14.58 | 3.47 | 25.3 |
| Canopy cover of trees (%) | 0 | 96 | 47.74 | 50 | 24.04 |
| Canopy cover of bushes (%) | 0 | 88 | 8.48 | 3 | 15.99 |
| Cover of seedlings or saplings (%) | 0 | 13.78 | 1.27 | 0.33 | 2.28 |
| Cover of scrubs indicating sub-xeric sites (%)1 | 0 | 71.25 | 11.50 | 7.25 | 13.23 |
| Cover of bottom layer vegetation indicating xeric sites (%)2 | 0 | 42.95 | 5.85 | 1.30 | 9.95 |
| Cover of mosses and scrubs indicating mesic sites (%)3 | 0 | 70.75 | 18.99 | 11.05 | 19.76 |
| Cover of vascular species indicating herb rich sites (%)4 | 0 | 87.12 | 9.50 | 5.00 | 15.09 |
| Cover of hay species (%) | 0 | 52.3 | 5.62 | 1.26 | 10.25 |
| Cover of grass species (%) | 0 | 68.21 | 6.56 | 0.97 | 12.99 |
| Cover of mosses (%) | 0.22 | 154.25 | 59.26 | 63.81 | 34.22 |
| Cover of lichens (%) | 0 | 51.62 | 3.32 | 0.02 | 8.38 |
| Cover of Sphagnum species (%) | 0 | 49.37 | 2.11 | 0 | 6.99 |
| Cover of Salix species (%) | 0 | 1 | 0.03 | 0 | 0.14 |
| Cover of Rhododendron tomentosum (%) | 0 | 2 | 0.09 | 0 | 0.35 |
| Cover of Polytrichum commune (%) | 0 | 16.5 | 1.16 | 0 | 3.31 |
| * pH values are calculated from H+ concentrations. Site types (n): herb-rich (19), mesic (30), sub-xeric (27), xeric and barren heath forests (6). Field estimated soil particle size (n): Fine <0.06 mm (18), Medium 0.06–0.6 mm (56), Coarse >0.6 mm (8). Soil layers (n for water retention): 0–6 cm (82), 30–36 cm (82). Vegetation groups indicating site quality, formed by Item Cluster Analysis (Revelle 2017): 1 sub-xeric scrubs: Vaccinium vitis-idaea L., Vaccinium uliginosum L., Empetrum nigrum L., Calluna vulgaris (L.) Hull; 2 xeric lichens: Cladina sp., Dicranum fuscescens Sm.; 3 mesic mosses and scrubs: Dicranum majus Sm., Hylocomium splendens (Hedw.) Schimp., Vaccinium myrtillus L.; 4 herb-rich vascular plants: Rubus saxatilis L., Pteridium aquilinum C.N. Page & R.R. Mill, Oxalis acetocella L., Maianthemum bifolium (L.) F. W. Schmidt, nutrient-demanding bushes. | |||||
At each plot, the terrain topography was defined as a slope, hilltop, flat or depression. The mean topsoil particle size class (fine-, medium- or coarse-grained) was assessed in the field by a visual and tactile evaluation. The precise GPS co-ordinate point of each sample plot was determined to also enable the characterization of the location of the site within the larger hydrological continuum.
2.2 Laboratory analyses
The particle size was analysed in soil layers (10–20 and 20–40 cm) using the laser-diffraction method and for 60 samples from the layer at a depth of 10–20 cm (containing also the samples with the highest clay contents) using the sedimentation method (Table 1). The sedimentation method was applied after organic matter had been removed from the samples using H2O2 (Elonen 1971). The values from the laser-diffraction method were calibrated with unpublished test data to the average level of the sedimentation method using 259 soil samples analysed using both methods.
The approximate organic soil matter content was determined based on loss on ignition at 550 oC for two hours (=100% minus percentage ash content). The soil pH in water (1:5) was estimated by a regression equation based on 33 soil samples [pH(CaCl2) (in the range 2.9–5.8): pH(H2O) = 0.723 + 0.972 × pH(CaCl2)].
The volumetric water-retention characteristics of undisturbed soil samples were measured by means of a pressure plate apparatus (Soilmoisture Equipment Corp., Santa Barbara, CA, USA) at decreasing matric potentials (i.e. under desorption) (Klute 1986; Heiskanen and Mäkitalo 2002). Soil-filled metal cylinders (d = 58, h = 60 mm) were first saturated overnight, then allowed to drain freely (to –0.3 kPa matric potential) and then exposed to successive matric potentials down to –1500 kPa. The bulk density was determined as the ratio of the dry mass (dried at 105 °C) to volume at –0.3 kPa. The particle density (Dp) was estimated using an average density of 2.65 g cm–3 applied to mineral and 1.5 g cm–3 to organic components (Heiskanen 1992). The total porosity (TP) was estimated to be (Dp–Db) Dp–1, where Db is the bulk density. The air-filled porosity (AFP) was estimated as TP–WC, where WC refers to the volumetric water content. The water content at field capacity was estimated as the water retention at a matric potential of –10 kPa (Al Majou et al. 2008).
2.3 Statistical analysis and models
We modelled the soil properties using linear mixed effects models and a linear model without a random factor. Sample plots were considered as a random variable in the mixed effects models. The number of sample plots (level j in the models) was 82 all over the country (Fig. 1). The number of observations between the models varied a little in the two hierarchy levels due to some missing observations in the data. Soil properties measured from two layers, near the soil surface (0–6 cm) and from the depth of 30–36 cm (level i in the models) were considered to be the correlated observations within the sample plots. The explanatory variables represented both levels in the mixed effects models. Log- and square-root transformations were tested in the response variables (yij, yj) to normalize the residuals. A square-root transformation was selected for all of the models where the transformation was needed to achieve adequate residuals. The mixed effects models can be written as:

where:
β0 = the fixed intercept
![]() = fixed coefficients that have been measured in sample plot (j) and at soil layer level (i)
= fixed coefficients that have been measured in sample plot (j) and at soil layer level (i)
![]() = fixed variables that have been measured in sample plot (j) and at soil layer level (i)
= fixed variables that have been measured in sample plot (j) and at soil layer level (i)
μ0j = random sample plot effect (random intercept)
εij= error variance
k1 = the number of fixed variables representing the soil layer effects
k2 = the number of fixed variables representing the sample plot effect.
The coefficients of determination (R2) for the mixed effects models were computed using the R software package piecewiseSEM (Nakagawa and Schielzeth 2013; Lefcheck 2015). The mixed models were constructed using lme4 (Bates et al. 2015) R packages. Because of the large number of achieved models, we present only the effects of the model predictors in the effect plots of the most relevant variables.
The model for the thickness of the humus layer was a general linear model without the random sample plot effect, because the response variables were only measured at the independent sample plot level. The soil characteristics of the soil layers were averaged for use as the explanatory variables in the models. Alternatively, the soil properties were tested in the models separately, but the averaging produced almost similar results. The general formula for the linear model could be written as:
![]()
where:
β0 = the intercept
βj = the coefficients of the model, measured at the sample plot level (j)
xj = variables of the model, measured at the sample plot level (j)
εj = error variance.
There were about 300 plant species, cover percentage of which had been measured on the sample plots. The species were considered as potential explanatory variables for the soil properties, not in a causal sense, but merely as indicators of the soil properties. However, testing the effect of each species would have been too laborious a task. Thus, we used two approaches to study the effects of the species. First, groups of closely related species were formed using Item Cluster Analysis (ICA), which is an advanced alternative e.g. to principal component or factor analysis (Revelle 2017). However, the groups had to be ecologically relevant. Sum variables (the cover of the species) were formed based on the ICA. A Spearman’s rank order correlation matrix of the species with a cover of at least 0.5% was used as an input to the ICA (the threshold of 0.5 was used because the correlation matrixes could not be computed for all the measured species). The predictions for the explanatory variables in the models, based on the fixed effects were computed and plotted using the R software package effects (Fox 2003).
The second approach was to analyse which single species were strongly related to the gradients of the soil properties to select these species for the explanatory variables for the models. A Constrained Correspondence Analysis (CCA) with gradient vectors combined with a CCA-plot was used in this approach. The R software package, vegan (Oksanen et al. 2017), was used in the CCA analysis. The species that were selected based on the CCA (situated near the ends of the gradient vectors) were tested in two ways: based on their cover and based on their existence (whether they exist or not in the sample plot). Low frequencies and low cover with the relatively small number of sample plots may have affected non-significant effects of these variables. The defined vegetation groups are described in Table 1.
3 Results
In the present data covering whole Finland, the atmospheric temperature sum has the strongest correlation with the site index H100. The H100 index is also closely related to soil attributes and is positively related to the topsoil pH and soil water retention at field capacity (WC10) (Table 2). Almost equally good coefficients of determination can also be achieved with the fine fraction content and site type as explanatory variables (Tables 2, 3). The tree species composition showed no significant effect on H100. The coverage of plant species (Table 1) had significance in models only as vegetation groups which indicate site quality (see below).
| Table 2. Summary statistics for the selected major response variables with the three most significant (Anova F-test) explanatory variables. Site type and soil layer are categorical variables. | ||||||
| Fixed models: | ||||||
| Variable | Multiple R2 | Adjusted R2 | Residual SE | Explainer1 | Explainer2 | Explainer3 |
| H100 (model a) | 0.829 | 0.813 | 2.75 | Site type | Temperature sum | Fine fraction |
| H100 (model b) | 0.718 | 0.702 | 3.50 | Temperature sum | pH (0–6cm) | WC10 |
| (H-layer)0.5 | 0.498 | 0.479 | 0.39 | pH (0–6cm) | Xeric species* | Mesic species* |
| (Fines)0.5 (model a)** | 0.482 | 0.424 | 1.21 | Site type | Temperature sum | Slope |
| Mixed models: | ||||||
| Variable | Conditional R2 | Marginal R2 | Residual SD | Explainer1 | Explainer2 | Explainer3 |
| (Fines)0.5 (model b) | 0.834 | 0.624 | 0.732 | WC10 | Soil layer | Site type |
| Db (model a) | 0.717 | 0.450 | 0.085 | Org. | Soil layer | Soil layer:Org. |
| Db (model b) | 0.665 | 0.473 | 0.094 | (Org.)0.5 | Slope | Soil texture class |
| TP (=WC0) | 0.694 | 0.403 | 3.26 | Soil layer | Org. | Slope |
| WC1 | 0.597 | 0.477 | 4.49 | Total porosity | Fine fraction | Slope |
| WC10 | 0.806 | 0.655 | 4.21 | Fine fraction | Db | Slope |
| (WC100)0.5 | 0.796 | 0.478 | 0.46 | Fine fraction | Soil layer | Org. |
| (WC1500)0.5 | 0.597 | 0.319 | 0.61 | Db | Herb-rich species* | - |
| (AFP1)0.5 | 0.688 | 0.537 | 0.54 | Soil layer:Db | Soil layer | Soil texture class:Db |
| AFP10 | 0.853 | 0.651 | 3.55 | Fine fraction | Db | Soil layer:Db |
| Db = bulk density, Org. = organic matter (%), Fines = soil fine fraction, * the cover percentages of plant species indicating site quality (see Table 1), ** the fine fraction as a mean of layers. | ||||||
| Table 3. Estimate statistics of fixed effects models for the H100 site index, thickness of humus layer (cm) and soil fine fraction content (%) (without hydraulic explanatory variables). Estimates for categorical variables refer to the zero reference level (i.e. site types vs. reference category of herb-rich site type). | |||||||
| Variable | Effect | Estimate | SE | t-value | Pr(>|t|) | ||
| H100 | Intercept | 0.848 | 3.190 | 0.266 | 0.791 | ||
| Mesic site type | –5.960 | 1.128 | –5.282 | <0.001 | |||
| Sub-xeric site type | –4.409 | 1.279 | –3.447 | 0.001 | |||
| Xeric site type | –6.962 | 2.073 | –3.358 | 0.001 | |||
| Temperature sum | 0.017 | 0.002 | 9.786 | <0.001 | |||
| Fine fraction | 0.071 | 0.026 | 2.738 | 0.008 | |||
| Residual SE | 2.751 | Multiple R2 | 0.829 | ||||
| Df | 52 | Adj. R2 | 0.813 | ||||
| (H-layer)0.5 | Intercept | 6.455 | 0.657 | 9.826 | <0.001 | ||
| Xeric species* | –0.0193 | 0.00461 | –4.189 | <0.001 | |||
| Mesic species* | 0.00685 | 0.00251 | 2.728 | 0.00787 | |||
| pH (0–6 cm depth) | –1.0727 | 0.154 | –6.952 | <0.001 | |||
| Residual SE | 0.394 | Multiple R2 | 0.498 | ||||
| Df | 78 | Adj. R2 | 0.479 | ||||
| (Fine fraction)0.5 | Intercept | 8.628 | 1.191 | 7.245 | <0.001 | ||
| Mesic site type | –1.106 | 0.514 | –2.153 | 0.036 | |||
| Sub-xeric site type | –1.626 | 0.525 | –3.095 | 0.003 | |||
| Xeric site type | –3.203 | 0.840 | –3.036 | <0.001 | |||
| Temperature sum | –0.0075 | 0.0009 | –3.036 | 0.004 | |||
| Slope | 0.0617 | 0.0299 | 2.065 | 0.044 | |||
| H100 | 0.0676 | 0.0340 | 1.985 | 0.052 | |||
| Residual SE | 1.205 | Multiple R2 | 0.482 | ||||
| Df | 53 | Adj. R2 | 0.424 | ||||
| * Cover percentages of plant species indicating site quality (see Table 1). | |||||||
The thickness of the humus layer decreases with increasing topsoil pH (Fig. 2). It is well predicted from the pH and cover of xeric and mesic plant species (Tables 2, 3). The fine fraction content (clay + silt) of the soil decreases with temperature sum and site type quality (Fig. 3) and is also closely related to water retention at field capacity (WC10), as well as the soil layer (Tables 2, 4). Without water retention characteristics, it is related to the temperature sum, site index and type as well as the slope angle (Tables 2, 3; Fig. 3). The soil bulk density is negatively related to organic matter and slope angle (Fig. 4; Table 3). Alternatively the bulk density relates to organic matter, the slope and field estimated soil textural class (fine, medium or coarse) (Table 2).
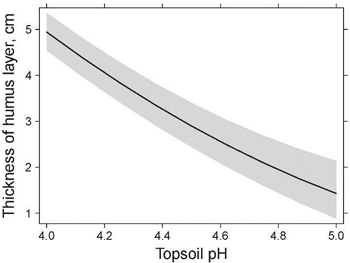
Fig. 2. Predicted relation of the thickness of the humus layer to topsoil pH (0–6 cm) (see the fixed model in Table 3). The shaded area denotes a 95% confidence interval.
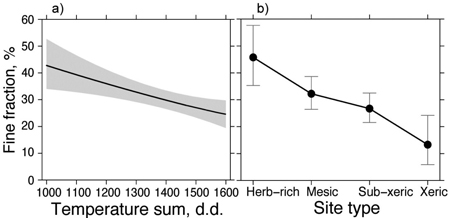
Fig. 3. Predicted relations of the soil’s fine fraction content to the temperature sum and site type (see the fixed model in Table 3). The shaded area and vertical bars denote a 95% confidence interval.
| Table 4. Estimate statistics of mixed effects models for the soil’s fine fraction content and bulk density as well as for water retention (WC10) and air-filled porosity (AFP10) at –10 kPa matric potential (SE for fixed and SD for random effects). Estimates for categorical variables refer to the zero reference level (i.e. site types vs. reference category of herb-rich site type and deeper soil layer vs. upper layer and field estimated soil particle size vs. reference category of fine sites). | ||||||
| Variable | Effect | Estimate | SE/SD | t-value | Pr(>|t|) | |
| (Fine fraction)0.5 | Intercept | 2.138 | 0.713 | 2.999 | 0.004 | |
| Mesic site type | –0.890 | 0.330 | –2.697 | 0.009 | ||
| Sub-xeric site type | –1.063 | 0.346 | –3.074 | 0.003 | ||
| Xeric site type | –1.675 | 0.538 | –3.112 | 0.003 | ||
| WC10 | 0.170 | 0.026 | 6.480 | <0.001 | ||
| Layer 30–36 cm | 1.748 | 0.607 | 2.878 | 0.006 | ||
| WC10: Layer 30–36 cm | –0.061 | 0.026 | –2–354 | 0.022 | ||
| Plot (random) | 0.826 | n = 81 | ||||
| Residual (random) | 0.712 | n = 103 | ||||
| Marginal R2 | 0.624 | |||||
| Conditional R2 | 0.834 | |||||
| Db | Intercept | 1.369 | 0.027 | 49.945 | <0.001 | |
| Layer 30–36 cm | 0.160 | 0.031 | 5.107 | <0.001 | ||
| Slope angle | –0.00899 | 0.002 | –3.897 | <0.001 | ||
| Org. matter | –0.0135 | 0.007 | –1.948 | 0.054 | ||
| Layer 30–36 cm: Org. | –0.0468 | 0.012 | –4.024 | <0.001 | ||
| Plot (random) | 0.083 | n = 81 | ||||
| Residual (random) | 0.085 | n = 105 | ||||
| Marginal R2 | 0.450 | |||||
| Conditional R2 | 0.717 | |||||
| WC10 | Intercept | 35.644 | 6.667 | 5.346 | <0.001 | |
| Layer 30–36 cm | –4.595 | 1.760 | –2.610 | 0.011 | ||
| Db | –16.253 | 4.819 | –3.373 | 0.001 | ||
| Fine fraction | 0.355 | 0.031 | 11.292 | <0.001 | ||
| Slope angle | –0.335 | 0.121 | –2.776 | 0.007 | ||
| Org. matter | –0.214 | 0.338 | –0.631 | 0.530 | ||
| Layer 30–36 cm: Org. | 1.432 | 0.613 | 2.333 | 0.022 | ||
| Plot (random) | 3.721 | n = 81 | ||||
| Residual (random) | 4.210 | n = 103 | ||||
| Marginal R2 | 0.655 | |||||
| Conditional R2 | 0.806 | |||||
| AFP10 | Intercept | 74.955 | 8.655 | 8.660 | <0.001 | |
| Layer 30–36 cm | –23.310 | 8.429 | –2.766 | 0.010 | ||
| Medium-coarse sites | 2.911 | 1.830 | 1.591 | 0.116 | ||
| Coarse sites | 5.598 | 2.735 | 2.047 | 0.044 | ||
| Db | –32.403 | 6.258 | –5.178 | <0.001 | ||
| Fine fraction | –0.261 | 0.041 | –6.337 | <0.001 | ||
| Slope angle | 0.285 | 0.121 | 2.368 | 0.020 | ||
| Layer 30–36 cm: Bulk density | 19.422 | 6.389 | 3.040 | 0.005 | ||
| Plot (random) | 4.160 | n = 78 | ||||
| Residual (random) | 3.548 | n = 98 | ||||
| Marginal R2 | 0.651 | |||||
| Conditional R2 | 0.853 | |||||
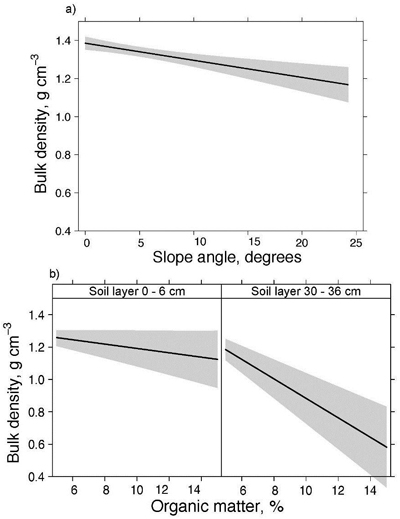
Fig. 4. Predicted relations of the soil bulk density to the terrain slope angle and soil organic matter by soil layer (see the mixed effects model in Table 3). The shaded area denotes a 95% confidence interval.
The water retention characteristics are determinable by the fine fraction content, the soil depth (layer) and the bulk density (for details see Tables 2, 4). The water content (WC10) and air-filled porosity (APF10) at field capacity are especially closely related to the fine fraction content (Fig. 5).
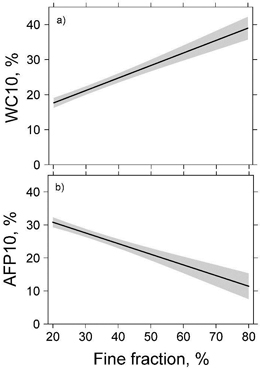
Fig. 5. Predicted relation of the water content (WC10) and air-filled porosity (AFP10) at –10 kPa matric potential to the soil’s fine fraction content (clay + silt) (see the mixed models in Table 4). The shaded area denotes a 95% confidence interval.
4 Discussion
In the present data, the forest site index (H100) was found to be most closely related to the atmospheric temperature sum, which suggests the effects of latitude and altitude on temperature and preconditions for growth. The topsoil pH and soil water retention at field capacity (WC10) were significant predictive soil attributes for the H100 index; the effects of which presumably vary along the transect from south to north due to climate (temperature, precipitation, transpiration). The soil productivity is affected by the nutritional, thermal and hydrological regimes of the site and varies from fertile to poor sites and from south to north in Finland (Cajander 1949; Tamminen 1993; Mäkinen et al. 2002; Henttonen et al. 2014). There is a dominant relationship between understorey vegetation and the site type and productivity in the boreal forest ecosystem (Cajander 1949). The forest site productivity has previously been found to vary according to site type, stoniness, elevation, topographic position, slope, pH, humus layer thickness, mineral soil thickness and soil texture class (Hägglund and Lundmark 1977; Childs and Flint 1990; Tamminen 1993; Seynave et al. 2005; Socha 2008; Sharma et al. 2012; Laamrani et al. 2014).
In this study, the thickness of the humus layer was found to be closely related to the topsoil pH and cover of xeric and mesic plant species. The thickness of the humus layer typically varies between 1–15 cm in Finland (Tamminen 1993, 2000; Westman 1990). The thickness of the humus layer and the age of the tree stand reduce the pH in the humus layer while the soil’s fine fraction content and the dominance of deciduous tree species increase it. In the mineral soil layers, the soil pH is higher on average on stoneless, fine-grained sites with a thin humus layer and no Norway spruce (Tamminen 2000). Organic matter accumulation usually results in a reduction in soil pH, which is caused by partial microbial degradation and production of organic acids (Skyllberg 1990; Westman 1990; Ilvesniemi 1991; Tamminen 2000; Abakumov et al. 2012).
In general, humus-layer development is influenced by the vegetation type, forest-management practice, climate (temperature), geological substrate, soil faunal and microbial activity, and the stage of forest succession. Spatial variability of the humus layer thickness can have important impacts on soil water dynamics, nutrient storage and availability, as well as plant growth (Hokkanen et al. 1995; Ponge et al. 2002; Bens et al. 2006; Laamrani et al. 2014). The structure and thickness of the humus layer can also affect the trafficability of the site (Haarlaa 1973; Wästerlund 1989).
In the present site data, the soil’s fine fraction content (clay + silt) was found to be closely related to water retention at field capacity (WC10), soil layer and site type, and without water retention characteristics, it was found to be related to the temperature sum, site index and type as well as slope angle. Water retention characteristics are determinable by the soil’s fine fraction content, soil depth (layer) and bulk density. The water retention (WC10) and air-filled porosity (APF10) at field capacity are especially closely related to the soil’s fine fraction. The soil’s bulk density was found to be related to organic matter, soil depth (layer) or alternatively to organic matter, slope, and the field estimated soil textural class (fine, medium, coarse).
The hydrological regime of a site depends not only on the physical properties of the soil, but also on the topographical location and the ambient weather conditions (Childs and Flint 1990; Nyberg 1996; Heiskanen and Mäkitalo 2000). In a study in northern Finland, for example, the soil’s fine fraction content was found to be dependent on the topographical position (18% on summits, 61% on toe-slopes) (Mäkitalo 2009). Forest site types and the dominance of tree species can differ markedly in the soil texture, hydrological regime and soil water retention characteristics of the site (Sepponen et al. 1979; Heiskanen 1988; Heiskanen and Mäkitalo 2002).
The soil’s bulk density is correlated to the organic matter content and particle size (Westman 1990; Tamminen 1993; Tamminen and Starr 1994). In Finland, the soil bulk density rapidly increases with depth at the surface but remains uniform at depths over 20 cm (Tamminen and Starr 1994). The soil’s organic matter content decreases the bulk density significantly. The fine fraction (<0.06 mm) content tends weakly to decrease the bulk density and the gravel (2–20 mm) content to increase it.
On average, the soil water retention characteristics (WRC) are mainly dependent on the soil particle size, bulk density and organic matter content (Gupta and Larson 1979; Heiskanen 1988; Childs and Flint 1990; Heiskanen and Mäkitalo 2002; Mecke et al. 2002; Wall and Heiskanen 2003; Jauhiainen 2004; Heiskanen et al. 2016). As in this study, water retention especially near field capacity has also previously been found to correlate well with the fine fraction content in forest soils (Heiskanen 1988; Sepponen et al. 1979; Hewelke et al. 2015). If the soil’s fine fraction content is too high this may result in excessive soil water and poor soil aeration (AFP10 below 10%) (Sepponen et al. 1979; Heiskanen and Mäkitalo 2002; Wall and Heiskanen 2003; Mäkitalo 2009; cf. Fig. 5).
The mean actual soil water content (SWC) is about the same as the water retention at field capacity or at –10 kPa matric potential (i.e. WCfc ≈ WC10) (Heiskanen 1988; Al Majou et al. 2008). The actual SWC is similarly dependent on the soil properties as the WRC but is also dependent on the depth of the ground water as well as transient water storage changes in the weather (precipitation/transpiration) (Heiskanen and Mäkitalo 2002; Mäkitalo 2009; Henttonen et al. 2014). The SWC can also be related to topographic slope data (TWI, topographic wetness index) or the distance to ground water (DTW, depth-to-water index, m) (Mäkitalo 2009; Campbell et al. 2013; Niemi et al. 2017). In northern Finland, with an increasing TWI, the soil’s fine fraction content, organic matter content and WC10 increases, while the AFP10 decreases significantly (Mäkitalo 2009).
Soil type, along with traffic intensity, affects significantly the soil bearing capacity and rut formation in logging operations (Ayers and Perumpal 1982; Vaz et al. 2011; Mohtashami et al. 2017; Uusitalo et al. 2018). The soil bearing capacity (expressed as penetration resistance, PR) is mainly dependent on the soil bulk density, clay content and SWC. In fully saturated silty and clayey soils, the PR in the uppermost 15 cm can be as low as 600–800 kPa, whereas in dry soils the PR varies between 1500–2500 kPa (Uusitalo et al. 2018). The PR of the humus soil is typically as low as 500–600 kPa, which indicates that the whole humus layer is compressed or moved aside forming deep ruts under heavy logging operations. Campbell et al. (2013) have shown in Canada that an explanatory model for the PR (cone index) using elevation, slope and distance to ground water level (DTW index) (R2 = 0.50) can be improved by including the field-measured SWC to the model (R2 = 0.66). DTW alone may not predict rut formation in forest logging (Mohtashami et al. 2017).
5 Conclusions
The present data and models for the site index, water retention characteristics and related physical soil properties form a novel basis and input parameters for further investigations, which aim to more accurately predict the relevant soil properties for practical forestry management using topographical and forest inventory data. The soil bearing capacity is related to the soil penetration resistance, which is commonly determined by the soil bulk density, clay and soil water contents. Thus, the estimated soil bulk density, soil water content at field capacity (WC10) and fine fraction content of this study can, for example, be used as explanatory soil data in a geographic information system for estimating the average soil bearing capacity locally and extensively for the Finnish forest upland sites. However, the present data cannot fully reveal the effects of physical soil properties on the site characteristics, hydrological regime or trafficability at all locations because of its relatively limited sample and incomplete cover of the forest land area. For example, western and southern Finnish coastal areas, where forest soils contain more silt and clay, are scarcely represented. Therefore, further verification studies are needed in the next phase with more comprehensive data sampling together with more detailed location-based data analyses. This would achieve a location-based data analysis resulting in high-resolution data which would contribute to achieving more accurate prediction models for forest growth, hydrology and trafficability in various sites.
Acknowledgements
This work was facilitated by the research project “Metsäoperaatioiden tehostaminen ja laadun parantaminen olosuhdetiedon hyödyntämisen avulla (MEOLO)” [Enhancing efficiency and quality of forest operations by benefitting information related to working conditions] which is part of the research program “Metsätieto ja sähköiset palvelut” funded by the Finnish Ministry of Agriculture and Forestry.
References
Abakumov E., Cajthaml T., Brus J., Frouz J. (2012). Humus accumulation, humification, and humic acid composition in soils of two post-mining chronosequences after coal mining. Journal of Soils and Sediments 13(3): 491–500. https://doi.org/10.1007/s11368-012-0579-9.
Al Majou H., Bruand A., Duval O. (2008). The use of in situ volumetric water content at field capacity to improve prediction of soil water retention properties. Canadian Journal of Soil Science 88(4): 533–541. https://doi.org/10.4141/CJSS07065.
Ayers P.D., Perumpal J.V. (1982). Moisture and density effect on cone index. Transactions of the ASAE 25(5): 1169–1172. https://doi.org/10.13031/2013.33691.
Bates D., Maechler M., Bolker B., Walker S. (2015). Fitting linear mixed-effects models using lme4. Journal of Statistical Software 67(1): 1–48. https://doi.org/10.18637/jss.v067.i01.
Bens O., Buczko U., Sieber S., Hüttl R.F. (2006). Spatial variability of O layer thickness and humus forms under differentpine beech–forest transformation stages in NE Germany. Journal of Soil Science and Plant Nutrition 169(1): 5–15. https://doi.org/10.1002/jpln.200521734.
Cajander A.K. (1949). Forest types and their significance. Acta Forestalia Fennica 56. 71 p. https://doi.org/10.14214/aff.7396.
Campbell D.M.H., White B., Arp P.A. (2013). Modeling and mapping soil resistance to penetration and rutting using LiDAR-derived digital elevation data. Journal of Soil and Water Conservation 68(6): 460–473. https://doi.org/10.2489/jswc.68.6.460.
Childs S.W., Flint A.L. (1990). Physical properties of forest soils containing rock fragments. In: Gessel S.P., Lacate D.S., Weetman G.F., Powers R.F. (eds.). Sustained productivity of forest soils. Proceedings of the 7th North American Forest Soils Conference. University of British Columbia, Faculty of Forestry Publication, Vancouver B.C. p. 95–121.
Elonen P. (1971). Particle-size analysis. Acta Agraria Fennica 122. 122 p.
Fox J. (2003). Effect displays in R for generalised linear models. Journal of Statistical Software 8(15): 1–27. https://doi.org/10.18637/jss.v008.i15.
Gupta S., Larson W. (1979). Estimating soil water retention characteristics from particle size distribution, organic matter percent, and bulk density. Water Resources Research 15(6): 1633–1635. https://doi.org/10.1029/WR015i006p01633.
Gustavsen H.-G. (1980). Talousmetsien kasvupaikkaluokittelu valtapituuden avulla. [Site index curves for conifer stands in Finland]. Folia Forestalia 454. 31 p. [In Finnish with English summary]. http://urn.fi/URN:ISBN:951-40-0479-5.
Haarlaa R. (1973). The effect of terrain on the output in forest transportation of timber. Acta Forestalia Fennia 128. 43 p. https://doi.org/10.14214/aff.7562.
Hägglund B., Lundmark J.E. (1977). Site estimation by means of site properties Scots pine and Norway spruce in Sweden. Studia Forestalia Suecica 138. 38 p.
Heiskanen J. (1988). Metsämaan vedenpidätyskyvystä ja sen suhteista eräisiin kasvupaikasta mitattuihin tunnuksiin. [Water retention capacity of forest soil and its relation to some site characteristics]. Licentiate Thesis. University of Helsinki, Department of Silviculture, Helsinki. https://doi.org/10.13140/RG.2.2.11963.21283. [In Finnish].
Heiskanen J. (1992). Comparison of three methods for determining the particle density of soil with liquid pycnometers. Communications in Soil Science and Plant Analysis 23(7–8): 841–846. https://doi.org/10.1080/00103629209368633.
Heiskanen J., Mäkitalo K. (2002). Soil water-retention characteristics of Scots pine and Norway spruce forest sites in Finnish Lapland. Forest Ecology and Management 162(2–3): 137–152. https://doi.org/10.1016/S0378-1127(01)00503-5.
Heiskanen J., Saksa T., Hyvönen J. (2016). Effects of mounding and soil clay content on postplanting success of Norway spruce. Forest Ecology and Management 378: 206–213. https://doi.org/10.1016/j.foreco.2016.07.044.
Henttonen H.M., Mäkinen H., Heiskanen J., Peltoniemi M., Laurén A., Hordo M. (2014). Response of radial increment variation of Scots pine to temperature, precipitation and soil water content along a latitudinal gradient across Finland and Estonia. Agricultural and Forest Meteorology 198–199: 294–308. https://doi.org/10.1016/j.agrformet.2014.09.004.
Hewelke P., Gnatowski T., Hewelke E., Żakowicz S., Tyszka J. (2015). Analysis of water retention capacity for select forest soils in Poland. Polish Journal of Environmental Studies 24(3): 1013–1019. https://doi.org/10.15244/pjoes/23259.
Hokkanen T.J., Järvinen E., Kuuluvainen T. (1995). Properties of top soil and the relationship between soil and trees in a boreal Scots pine stand. Silva Fennica 29(3): 189–203. https://doi.org/10.14214/sf.a9207.
Ilvesniemi H. (1991). Spatial and temporal variation of soil chemical characteristics in pine sites in southern Finland. Silva Fennica 25(2): 99–108. https://doi.org/10.14214/sf.a15600.
Jauhiainen M. (2004). Relationships of particle size distribution curve, soil water retention curve and unsaturated hydraulic conductivity and their implications on water balance of forested and agricultural hillslopes. Helsinki University of Technology, Water Resources Publications, TKK-VTR-12, Espoo. 165 p. http://urn.fi/urn:nbn:fi:tkk-003835.
Laamrani L., Valeria O., Bergeron Y., Fenton N., Cheng L.Z., Anyomi K. (2014). Effects of topography and thickness of organic layer on productivity of black spruce boreal forests of the Canadian Clay Belt region. Forest Ecology and Management 330: 144–157. https://doi.org/10.1016/j.foreco.2014.07.013.
Lefcheck J.S. (2015). piecewiseSEM: piecewise structural equation modeling in R for ecology, evolution, and systematics. Methods in Ecology and Evolution 7(5): 573–579. https://doi.org/10.1111/2041-210X.12512.
Klute A. (ed.) (1986). Methods of soil analysis. Part 1. Physical and mineralogical methods. 2nd ed. American Society of Agronomy – Soil Science Society of America. Agronomy 9. Madison, Wisconsin. 1188 p.
Mäkinen H., Nöjd P., Kahleb H.-P., Neumann U., Tveite B., Mielinäkinen K., Röhle H., Spiecker H. (2002). Radial growth variation of Norway spruce (Picea abies (L.) Karst.) across latitudinal and altitudinal gradients in central and northern Europe. Forest Ecology and Management 171(3): 243–259. https://doi.org/10.1016/S0378-1127(01)00786-1.
Mäkitalo K. (2009). Soil hydrological properties and conditions, site preparation, and the long-term performance of planted Scots pine (Pinus sylvestris L.) on upland forest sites in Finnish Lapland. Dissertationes Forestales 80. 71 p. https://doi.org/10.14214/df.80.
Mälkönen E. (ed.) (2003). Metsämaa ja sen hoito. [Forest soil and its management]. Mesäntutkimuslaitos ja Metsälehti Kustannus. Karisto, Hämeenlinna. 220 p. [In Finnish].
Mecke M., Westman C.J., Ilvesniemi H. (2002). Water retention capacity in coarse podzol profiles predicted from measured soil properties. Soil Science Society of America Journal 66(1): 1–11. https://doi.org/10.2136/sssaj2002.1000.
Miina J., Hotanen J-P., Salo K. (2009). Modelling the abundance and temporal variation in the production of bilberry (Vaccinium myrtillus L.) in Finnish mineral soil forests. Silva Fennica 43(4): 577–593. https://doi.org/10.14214/sf.181.
Mohtashami S., Eliasson L., Jansson G., Sonesson J. (2017). Influence of soil type, cartographic depth-to-water, road reinforcement and traffic intensity on rut formation in logging operations: a survey study in Sweden. Silva Fennica 51(5) article 2018. https://doi.org/10.14214/sf.2018.
Nakagawa S., Schielzeth H. (2013). A general and simple method for obtaining R2 from generalized linear mixed effects models. Methods in Ecology and Evolution 4(2): 133–142. https://doi.org/10.1111/j.2041-210x.2012.00261.x.
Niemi M.T., Vastaranta M., Vauhkonen J., Melkas T., Holopainen M. (2017). Airborne LiDAR-derived elevation data in terrain trafficability mapping. Scandinavian Journal of Forest Research 32(8): 762–773. https://doi.org/10.1080/02827581.2017.1296181.
Nyberg L. (1996). Spatial variability of soil water content in the covered catchment at Gårdsjön, Sweden. Hydrological Processes 10(1): 89–103. https://doi.org/10.1002/(SICI)1099-1085(199601)10:1%3C89::AID-HYP303%3E3.0.CO;2-W.
Oksanen J., Blanchet F.G., Friendly M., Kindt R., Legendre P., McGlinn D., Minchin P.R., O’Hara R.B., Simpson,G.L., Solymos P., Stevens M.H.H., Szoecs E., Wagner H. (2017). vegan: Community Ecology Package. R package version 2.4-3. https://CRAN project.org/package=vegan.
Peltoniemi M., Pulkkinen M., Aurela M., Pumpanen J., Kolari P., Mäkelä A. (2015). A semi-empirical model of boreal-forest gross primary production, evapotranspiration, and soil water – calibration and sensitivity analysis. Boreal Environment Research 20: 151–171.
Pirnazarov A., Wijekoon M., Sellgren U., Löfgren B., Andersson K. (2012). Modeling of the bearing capacity of Nordic forest soil. In: Proceedings of the 12th European Regional Conference of the International Society for Terrain-Vehicle Systems – September 24–27.2012, Pretoria, South Africa. 11 p.
Ponge J.-F., Chevalier R., Loussot P. (2002). Humus index: an integrated tool for the assessment of forest floor and topsoil properties. Soil Science Society of America Journal 66(6): 1996–2001. https://doi.org/10.2136/sssaj2002.1996.
Revelle W. (2017). psych: procedures for personality and psychological research. Northwestern University, Evanston, Illinois, USA. https://cran.r-project.org/package=psych.
Salemaa M., Derome J., Nöjd P. (2008). Response of boreal forest vegetation to the fertility status of the organic layer along a climatic gradient. Boreal Environment Research 13: 48–66.
Seynave I., Gégout J.C., Hervé J.-C., Dhôte J.-F., Drapier J., Bruno E., Dumé G. (2005). Picea abies site index prediction by environmental factors and understorey vegetation: a two-scale approach based on survey databases. Canadian Journal of Forest Research 35(7): 1669–1678. https://doi.org/10.1139/x05-088.
Sepponen P., Lähde E., Roiko-Jokela P. (1979). Metsäkasvillisuuden ja maan fysikaalisten ominaisuuksien välisestä suhteesta Lapissa. [On the relationship of the forest vegetation and the soil physical properties in Finnish Lapland]. Folia Forestalia 402. 31 p. [In Finnish with English summary]. http://urn.fi/URN:ISBN:951-40-0406-X.
Sharma R.P., Brunner A., Eid T. (2012). Site index prediction from site and climate variables for Norway spruce and Scots pine in Norway. Scandinavian Journal of Forest Research 27(7): 619–636. https://doi.org/10.1080/02827581.2012.685749.
Sims R., Baldwin K., Kershaw M., Wang Y. (1996). Tree species relation to soil moisture regime in northwestern Ontario, Canada. Environmental Monitoring and Assessment 39(1–3): 471–484. https://doi.org/10.1007/BF00396162.
Skyllberg U. (1990). Correlation between pH and depth in the mor layer of a Picea abies (L.) Karst. stand on till soils in northern Sweden. Scandinavian Journal of Forest Research 5(1–4): 141–153. https://doi.org/10.1080/02827589009382601.
Socha J. (2008). Effect of topography and geology on the site index of Picea abies in the West Carpathian, Poland. Scandinavian Journal of Forest Research 23(3): 203–213. https://doi.org/10.1080/02827580802037901.
Tamminen P. (1993). Pituusboniteetin ennustaminen kasvupaikan ominaisuuksien avulla Etelä-Suomen kangasmetsissä. [Estimation of site index for Scots pine and Norway spruce stands in South Finland using site properties]. Folia Forestalia 819. 26 p. [In Finnish with English summary]. http://urn.fi/URN:ISBN:951-40-1337-9.
Tamminen P. (2000). Soil factors. In: Mälkönen E. (ed.). Forest condition in a changing environment. The Finnish case. Springer, Dordrecht. p. 72–86. https://doi.org/10.1007/978-94-015-9373-1_8.
Tamminen P., Ilvesniemi H. (2013). Extensive forest soil monitoring. In: Merilä P., Jortikka S. (eds.). Forest condition monitoring in Finland – national report. The Finnish Forest Research Institute. http://urn.fi/URN:NBN:fi:metla-201305087584.
Tamminen P., Starr M. (1994). Bulk density of forested mineral soils. Silva Fennica 28(1): 53–60. https://doi.org/10.14214/sf.a9162.
Tamminen P., Tomppo E. (2008). Finnish forest soils. Working Papers of the Finnish Forest Research Institute 100. 21 p. http://urn.fi/URN:ISBN:978-951-40-2139-8.
Tomppo E., Heikkinen J., Henttonen H.M., Ihalainen A., Katila M., Mäkelä H., Tuomainen T., Vainikainen N. (2011). Designing and conducting a forest inventory – case: 9th National Forest Inventory of Finland. Springer series in Managing Forest Ecosystems 22. 272 p. https://doi.org/10.1007/978-94-007-1652-0.
Uusitalo J., Salomäki M., Ala-Ilomäki J. (2015). Variation of the factors affecting soil bearing capacity of ditched pine bogs in Southern Finland. Scandinavian Journal of Forest Research 30(5): 429–439. https://doi.org/10.1080/02827581.2015.1012110.
Uusitalo J., Ala-Ilomäki J., Lindeman H., Toivio J., Siren M. (2018). Modeling soil moisture – soil strength relationship of fine-grained upland forest soils in Finland. Manuscript (17 p. with 6 tables and 9 figures). Submitted to Soil & Tillage Research.
Vuokila Y., Väliaho H. (1980). Viljeltyjen havumetsiköiden kasvatus mallit. [Growth and yield models for conifer cultures in Finland]. Metsäntutkimuslaitoksen julkaisuja 99.2. 271 p. [In Finnish with English summary]. http://urn.fi/URN:NBN:fi-metla-201207171129.
Wall A., Heiskanen J. (2003). Water-retention characteristics and related physical properties of soil on afforested agricultural land in Finland. Forest Ecology and Management 186(1–3): 21–32. https://doi.org/10.1016/S0378-1127(03)00239-1.
Wang G., Klinka K. (1996). Classification of moisture and aeration regimes in sub-boreal forest soils. Environmental Monitoring and Assessment 39 (1–3): 451–469. https://doi.org/10.1007/BF00396161.
Wästerlund I. (1989). Strength components in the forest floor restricting maximum tolerable machine forces. Journal of Terramechanics 26(2): 177–182. https://doi.org/10.1016/0022-4898(89)90005-0.
Westman C.J. (1990). Metsämaan fysikaaliset ja fysikaalis-kemialliset ominaisuudet CT-OMaT kasvupaikkasarjassa. [Soil physical and physico-chemical properties of Finnish upland forest sites]. Silva Fennica 24(1): 141–158. [In Finnish with English summary]. https://doi.org/10.14214/sf.a15568.
Viro P. (1952). Kivisyyden määrittämisestä. [On the determination of stoniness]. Metsäntutkimuslaitoksen julkaisuja 40.3. 23 p. [In Finnish with English Summary]. http://urn.fi/URN:NBN:fi-metla-201207171072.
Total of 61 references.
