Lars Sprengel  ,
Heinrich Spiecker,
Shuirong Wu
,
Heinrich Spiecker,
Shuirong Wu
Two subject specific modelling approaches to construct base-age invariant polymorphic site index curves with varying asymptotes
Sprengel L., Spiecker H., Wu S. (2022). Two subject specific modelling approaches to construct base-age invariant polymorphic site index curves with varying asymptotes. Silva Fennica vol. 56 no. 1 article id 10544. https://doi.org/10.14214/sf.10544
Highlights
- Base-age invariant families of height growth curves with polymorphism and varying asymptotes are presented for the seven economically most important tree species in Zhongtiaoshan forest region, China
- The nonlinear fixed-effects approach outperforms the nonlinear mixed-effects approach according to the AIC, but according to RMSE and bias these results are not fully supported.
Abstract
For constructing growth and yield models the concept of site index as measure of productivity is crucial. Here, we use nonlinear mixed-effects models (NLME) with random individual effects and nonlinear models with dummy variables as fixed individual effects (NLFE) to fit mechanistic growth functions to stem analysis data of the economically most important tree species in Zhongtiaoshan forest region, China. The Richards and Lundqvist function are formulated into five dynamic equations (R1, R2, L1, L2 and L3) applying the generalized algebraic difference approach (GADA), which inherit polymorphism, varying asymptotes and base-age invariance. According to Akaike information criterion the R1 model as NLFE fits height growth data of Pinus tabuliformis Carrière, Pinus armandii Franch., Quercus liaotungensis Koidz., Quercus aliena Blume and Betula platyphylla Sukaczev best, while for Quercus variabilis Blume R2 as NLFE fits height growth data best. For Larix principis-rupprechtii Mayr L1 as NLME has been selected as best model, as R1 and R2 both as NLFE and NLME are not extrapolating the comparably short length of height growth data well enough. However, according to the root mean square error and bias differences between model fits of both the selected equation and the chosen model fitting approach are not so clear. Presented families of height growth curves serve as planning tools to identify site index and therefore assess productivity of forest stands in the studied region. A direct comparison of the productivity of forest stands of the same tree species is possible due to base-age invariance of the selected models.
Keywords
generalized algebraic difference approach;
stem analysis;
dummy variable approach;
gnls;
nonlinear mixed-effects models;
nlme;
Zhongtiaoshan forest region
-
Sprengel,
Chair of Forest Growth and Dendroecology, Albert-Ludwigs-University Freiburg, Tennenbacher Str. 4, 79106 Freiburg, Germany
 https://orcid.org/0000-0002-6332-7911
E-mail
lars.sprengel@iww.uni-freiburg.de
https://orcid.org/0000-0002-6332-7911
E-mail
lars.sprengel@iww.uni-freiburg.de
- Spiecker, Chair of Forest Growth and Dendroecology, Albert-Ludwigs-University Freiburg, Tennenbacher Str. 4, 79106 Freiburg, Germany E-mail instww@uni-freiburg.de
- Wu, Research Institute of Forest Policy and Information, Chinese Academy of Forestry, No. 1 Dongxiaofu, Haidian District, Beijing 100091, China E-mail shuirongwu@126.com
Received 15 March 2021 Accepted 5 January 2022 Published 21 January 2022
Views 80244
Available at https://doi.org/10.14214/sf.10544 | Download PDF

1 Introduction
Forest management planning in China at national level follows ambitious aims including the objective to improve forest quality, increase forest growing stock from 95 m3 ha–1 in 2018 to 121 m3 ha–1 in 2050 and average annual volume growth from 4.7 m3 ha–1 in 2018 to 5.2 m3 ha–1 in 2050 (State Forestry Administration 2018). The potential volume growth of a site, the site productivity, generally is expressed by site index and is based on tree height growth. Information about site productivity serves various purposes. It is an important component for quantifying the role of forests as carbon sinks, which should be increased in China (Ministry of Ecology and Environment of the People’s Republic of China 2019). Moreover, the rising demand for timber driven by population growth and economic development has to be met. However, currently forest quality, stocking levels and growth rates of plantation forests are still at a low level in China (Liu and Yin 2012; Hou et al. 2019). To fulfill the desired objectives, appropriate tools for forest management as well as forest management planning are required, including recently updated inventory data, site mapping and suitable growth and yield models. However, for many forests these tools are yet not all available in China. In particular, growth and yield models have been studied since the 1980s exploring whole-stand growth models, size-class models and single tree-level models, covering several species such as Populus tomentosa Carrière, Larix kaempferi (Lamb.) Carrière, Cunninghamia lanceolata (Lamb.) Hook., Larix gmelinii (Rupr.) Kuzen., Platycladus orientalis (L.) Franco, Pinus taiwanensis Hayata, Robinia pseudoacacia L. and Populus tomentosa Carrière (Zuyuan and Xinyou 1989; Changxiong 1995; Shouzheng and Xifei 2012; Wei-Wei and Feng-Ri 2008; Hua et al. 2020). Still, for most of the dominant species and major forest regions the growth and yield models are not available. Very often the average volume growth rate in percent is applied to estimate forest growing stock in practice, which is not precise enough for forest management planning. Therefore, this paper develops height growth models, which indicate site productivity, an important tool for sustainable forest management.
Whole-stand growth models can be used in single species, even-aged stands, where they depend on a measure of productivity (Weiskittel 2011). Such single species, even-aged stands are common in large parts of China, accounting for 58% of the forest area (National Forestry and Grassland Administration 2019). To construct growth and yield models the concept of site index as a measure of productivity is crucial. Site index is typically expressed as dominant height at a certain reference age that is almost unaffected by stand density (Carmean 1972) and thinning from below (van Laar and Akça 2007) and is correlated with volume production (Eichhorn 1904; Burkhart and Tomé 2012).
To model height growth of forest stands as well as of individual trees many different growth equations are known (for a list of examples compare Zeide (1993), Burkhart and Tomé (2012) and Kindermann (2016)). These functions in general describe the increase of size per unit of time and should fulfill certain criteria, such as resulting in height of 0 m at a specific beginning, maximizing against an asymptote and showing an inflection point (Burkhart and Tomé 2012). The criteria result from two opposing forces: the positive growth component associated with biotic potential and photosynthetic activity, and the restraining component from internal and external factors, such as aging and competition (Zeide 1993). The criteria are especially fulfilled if mechanistic nonlinear growth functions are used (Vanclay 1994).
For site index modelling, typically families of site index curves are produced. These curves can either be anamorphic, meaning that curves are proportional to each other, or polymorphic, when no proportional relationship between the curves is present. Polymorphic families of curves can also differ by having a common asymptote or not and by being disjoint, where curves do not cross each other, or being non-disjoint, where at least some curves cross each other (Clutter et al. 1983). Bailey and Clutter (1974) introduced the concept of base-age invariance where height equals site index when age equals base age for any given base age. If polymorphic families of curves are base-age invariant they also are disjoint.
To fit families of site index curves to height growth data of dominant trees several approaches have been developed: the guide curve method, the difference equation method, the parameter prediction method (Clutter et al. 1983) and the mixed model approach (Lappi and Bailey 1988). The guide curve method fits a population average curve and produces families of curves thereof by varying either the asymptotic parameter for anamorphic families of curves or a shape parameter for disjoint polymorphic families of curves with a common asymptote. The difference equation method and similar to that the algebraic difference approach (ADA) assigns one site or subject specific parameter while leaving the other parameters as common, thus leading to anamorphic families of curves or disjoint polymorphic families of curves with a common asymptote (Bailey and Clutter 1974). The generalized algebraic difference approach (GADA) extends the ADA by formulating two or more parameters as a function of a latent variable, thus leading to disjoint polymorphic families of curves with variable asymptotes if one of the varying parameters is the asymptote (Cieszewski and Bailey 2000). The parameter prediction method assigns site index values to single-tree-functions and relates the parameters of the fitted functions to site index through regression producing disjoint polymorphic families of curves. The mixed model approach from Lappi and Bailey (1988) is extending the one-parameter approaches to a two-parameter approach as formulated by Wang et al. (2008). In this approach, two or more subject specific parameters are treated as random effects and the remaining parameters as global fixed effects, leading to non-disjoint polymorphic families of curves with variable asymptotes if one random parameter is the asymptote. Essentially, the two subject specific parameters in the GADA are constrained by formulating them as functions of a latent variable while for the mixed model approach these parameters are not constrained. In statistical literature regarding nonlinear models, the ADA and GADA, as applications in forest growth and yield modeling, are cases of reparameterization of a response function (Mehtätalo and Lappi 2020). While linear transformations of predictors are not affecting the fitted model, nonlinear transformations affect the properties of the parameter estimates in terms of bias and variance (Fox and Weisberg 2018).
To estimate GADA model parameters, four different methods are commonly used: the dummy variable approach, the iterative nested approach, the forward difference approach and the nonlinear mixed-effects model approach (Weiskittel 2011).
The objective of this study is to compare different mechanistic growth functions to best describe height growth and to develop new site index models for the 7 economically most important native tree species in Zhongtiaoshan forest region of Shanxi province, China. Out of the described curve-fitting approaches, the GADA inherits the following desired properties, as site index modeling is the purpose: polymorphism and concurrently variable asymptotes, base-age invariance and thus being disjoint. It has been used in multiple, recent publications to model tree height (Diéguez-Aranda et al. 2006; Weiskittel et al. 2009; Seki and Sakici 2017; Özçelik et al. 2019; Socha et al. 2020; Koirala et al. 2021; Socha et al. 2021). The applied modelling approaches to construct families of height growth curves using the GADA are the non-linear mixed effects approach and the dummy variable approach. The analyzed tree species are Pinus tabuliformis Carrière, Pinus armandii Franch., Larix principis-rupprechtii Mayr, Quercus liaotungensis Koidz., Quercus variabilis Blume, Quercus aliena Blume and Betula platyphylla Sukaczev. Such growth functions for these tree species do not yet exist for the area of interest.
2 Material and methods
2.1 Research area
The research area is located in Zhongtiaoshan forest region of Shanxi Province in Northeast China and is already described by Sprengel et al. (2020) (Fig. 1). The coordinates for the northernmost tree are 36°09´N, 112°03´E, for the southernmost tree 35°03´N, 111°34´E, for the easternmost tree 35°29´N, 112°32´E and for the westernmost tree 35°05´N, 111°24´E. The area is dominated by temperate coniferous forests, which consist mainly of the tree species P. tabuliformis.
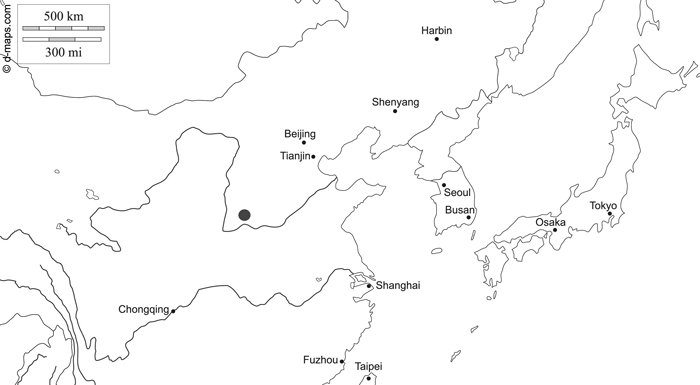
Fig. 1. Map of northern China indicating the research area of Zhongtiaoshan forest region with a grey large dot (d-maps 2020, modified). East Asia free map, free blank map, free outline map, free base map hydrography, states, main cities, names. Gap https://d-maps.com/carte.php?num_car=28780&lang=en. Accessed 19 January 2021.
The climate can be classified as temperate climate, influenced by the East Asian Summer Monsoon (EASM) with distinct hot and semi-humid summers, and cold and dry winters (Li et al. 2013). Annual precipitation ranges from 331 mm to 885 mm, mean annual air temperature is 11.5 °C and mean monthly air temperatures are ranging from –4.8 °C in January to 24.4 °C in July (aggregated climate data from Qinshui meteorological station (35°42´N, 112°12´E, 887 m a.s.l.), Yangcheng meteorological station (35°29´N, 112°24´E, 661 m a.s.l.), Gaoping meteorological station (35°46´N, 112°57´E, 837 m a.s.l.), and Lingchuan meteorological station (35°47´N, 113°16´E, 1313 m a.s.l.)).
Scientific names of tree species are given according to the Tropicos data base (Missouri Botanical Garden 2021).
2.2 Data
Trees chosen for stem analysis were taken exclusively from the predominant and dominant canopy layer (Kraft 1884), as these trees represent the top height of the forest stand that is least influenced by thinnings from below (van Laar and Akça 2007), which is a typical forest management practice in the stands of Zhongtiaoshan forest region. Additionally, sample trees were selected from pure stands and were not affected by gaps, skid trails, forest roads, and admixed tree species. Furthermore, selected sample trees had healthy and evenly shaped crowns and no visible injuries, damages, or infections (see Table 1 for additional information). Moreover, selected forest stands were as old as possible to maximize the observation range of tree age (Sprengel et al. 2020). To ensure that sample trees had maintained their predominant or dominant social class throughout their life, tree-rings at the base of the stem were examined for sequences of narrow tree-rings, which would have indicated suppression of the sample tree, leading to disqualification of such tree. Based on the aforementioned criteria, trees were selected subjectively.
| Table 1. Tree species-specific information of sample trees of the investigated tree species Pinus tabuliformis, Pinus armandii, Larix principis-rupprechtii, Quercus liaotungensis, Quercus variabilis, Quercus aliena and Betula platyphylla | ||||||
| tree species | sample trees (n) | elevation (m a.s.l.) | tree age (y) | tree height (m) | ||
| mean | sd | mean | sd | |||
| P. tabuliformis | 27 | 1187–1677 | 69 | 17 | 14.55 | 2.40 |
| P. armandii | 27 | 1338–1897 | 57 | 12 | 14.68 | 2.47 |
| L. principis-rupprechtii | 27 | 1191–1916 | 34 | 7 | 16.86 | 2.62 |
| Q. liaotungensis | 27 | 1283–1956 | 57 | 30 | 15.88 | 1.84 |
| Q. variabilis | 26 | 750–1223 | 60 | 14 | 18.20 | 3.41 |
| Q. aliena | 27 | 932–1350 | 79 | 16 | 17.45 | 1.76 |
| B. platyphylla | 27 | 1519–1927 | 38 | 18 | 16.18 | 1.68 |
To cover the full range of potential height growth patterns for each tree species, selected forest stands were classified into the relative site productivity classes low, medium and high. From each relative site productivity class 9 trees per tree species were selected. For Q. variabilis, one tree had to be removed from the sample during the process of data collection as this tree was growing as coppice shoot.
For each forest stand one sample tree was measured, as sizes of forest stands varied considerably. This allowed, however, only one level of nesting for the individual tree in the later step of model fitting, which is equivalent to the level of nesting for the forest stand. A separate level of nesting for the forest stand to create a hierarchical model could not be formulated with the sampled data, implying that the tree effect and the stand effect could not be disentangled.
Stem discs were collected from the sample trees at following pre-defined heights:
- Coniferous tree species at 0.3 m, 1.3 m, 3 m, 5 m and every next 3 m
- Broadleaved tree species at 0.3 m, 1.3 m, 3 m, 4 m, 5 m, 7.5 m and every next 1.25 m
Sampling took place during the growing season of the year 2018.
Tree-rings for stem analysis were counted and measured using the software WinDENDROTM (Regent Instruments Canada Inc. 2012), where images of stem discs were digitally measured after obtaining high-resolution scans using a flatbed scanner (Guay et al. 1992). The dating quality of the tree rings was checked by master chronologies. The number of counted tree rings per stem disc indicated the cambial age at the corresponding tree height. To estimate unknown heights of annual shoots we applied the method of Carmean (1972) in the formulation of Dyer and Bailey (1987). To estimate hidden tips in the first bolt we used the modification of Fabbio et al. (1994) and for hidden tips in the last bolt the modification of Newberry (1991) as described in Lappi (2006) (Fig. 2).
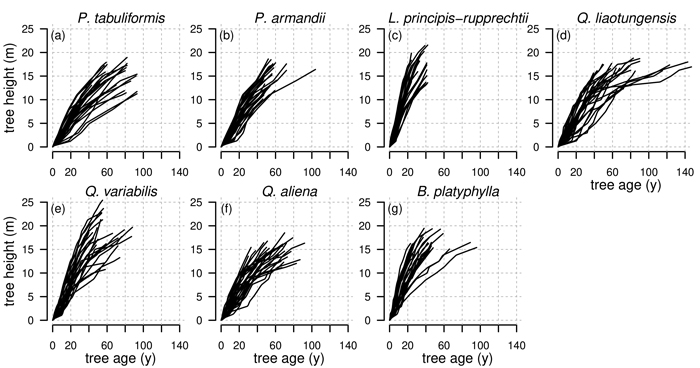
Fig. 2. Observed tree heights for all investigated tree species Pinus tabuliformis, Pinus armandii, Larix principis-rupprechtii, Quercus liaotungensis, Quercus variabilis, Quercus aliena and Betula platyphylla from stem analysis. Height of annual shoots are estimated based on the method from Carmean (1972).
2.3 Growth functions
Two mechanistic nonlinear base functions were selected for model formulation and are presented in Table 2: the three-parameter Lundqvist function (Lundqvist 1958) and the three-parameter Richards function (Richards 1959). As sample size per tree species is relatively low, we decided to fit growth functions with a maximum of three global parameters to avoid over-parametrization.
| Table 2. Model formulations of the two base functions and the five resulting dynamic equations used to fit tree species specific families of height growth curves. | ||||
| base function | site parameters | solution for X with initial values (y0, t0) | dynamic equation | ID |
| | L1 | |||
| L2 | ||||
| | L3 | |||
| R1 | ||||
| R2 | ||||
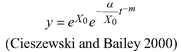
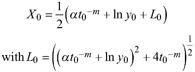
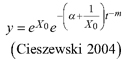
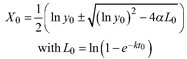
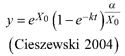
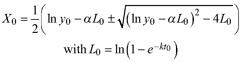
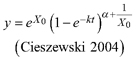
Based on the GADA (Cieszewski and Bailey 2000), out of the three base functions five polymorphic base-age invariant difference equations with varying asymptotes are derived by reparameterization (Table 2). For the GADA the parameter of the asymptote (A) and one parameter for the shape of the curve (k, m) need to vary based on the site-specific growth intensity factor X, where X is a theoretical, unobservable and latent variable. The base equation is then solved for X and this solution replaces all Xs with the initial conditions y0 and t0, leading to the general form of the dynamic equations:
![]()
where y is the dominant height at age t and y0 is the dominant height at base age t0. The derived dynamic equations show polymorphism, variable asymptotes and base-age invariance. For the dynamic equations L1, R1 and R2 the roots in the solution for X were expected to be more likely real and positive (Table 2).
2.4 Modelling
All statistical methods and data analysis were computed in the R programming environment using the Graphical User Interface R Studio (R Core Team 2020; RStudio Team 2019).
Tree height of the different tree species was modelled in two different approaches using nonlinear mixed-effects models (NLME) with random individual effects and nonlinear models with dummy variables as fixed individual effects (NLFE).
2.4.1 Nonlinear mixed-effects model approach
For the NLME approach we formulated the models with X, α, k and m being introduced as global fixed parameter vector β and with random effect bi associated with tree i as random component to X, leading to Xi being defined as β1 + bi (Cieszewski 2003). The general model using the definition from Lindstrom and Bates (1990) is then formulated as
![]()
where yij is the jth value of variable tree height of tree i at predictor variable age tij, f is a nonlinear function of one formulation from the dynamic equations in Table 2 of the predictor vector and the parameter vector Φi, and εij is the normally distributed residual error term with σ2I as the variance-covariance matrix. For the parameter vector
![]()
where β is the vector of global fixed parameters, bi is the vector of individual random effects parameters associated with tree i, Ai and Bi are design matrices of size r × p and r × q for both fixed and random effects, respectively, and σ2D is the random effects variance-covariance matrix.
The NLMEs were calculated for each tree species separately using the nlme function of the package nlme (Pinheiro et al. 2020). To account for within-group correlation due to repeated height measurements of tree i as well as unbalanced data, we defined an autocorrelation structure of order 1 with continuous time covariate using the corCAR1 function in the package nlme (Pinheiro and Bates 2000).
2.4.2 Nonlinear fixed-effects model approach with dummy variables
For the NLFE approach the models are formulated with X, α, k and m as global fixed parameter vector β and with Ii as dummy variables representing the difference from X of the ith tree, thus Xi is defined as β1 + Ii. The dummy model is formulated as:
![]()
where yij is the jth value of variable tree height of tree i at predictor variable age tij, f is a nonlinear function of one formulation from the dynamic equations in Table 2 of the predictor vector and the parameter vector Φi, and εij is the normally distributed residual error term with σ2I as the variance-covariance matrix. For the parameter vector:
![]()
where β is the vector of common parameters, A is the design matrix of size r × p for the common fixed effects and Ii is the vector of individual dummy variables associated with tree i.
Also, the NLFEs were calculated for each tree species separately using the gnls function of the package nlme, as in this function the errors are allowed to be correlated (Pinheiro et al. 2020). The same autocorrelation structure as for the NLME was defined.
2.4.3 Model evaluation
To compare and evaluate model estimates statistical criteria were examined. The statistics used were Akaike information criterion (AIC) (Akaike 1973), the root mean square error (RMSE) and the bias (ē).
![]()


where ll is the log-likelihood of the fitted model, p is the number of fitted parameters, n is the number of observed data points, yi is the observed tree height and ŷi is the predicted tree height including the predictions of the random effects.
Of the best models graphical analysis of the residuals as well as of the fitted curves were carried out as curve profiles could differ substantially even with fairly similar statistics and residuals (Huang et al. 2003).
3 Results
According to the AIC of all models for both approaches and for each tree species, R1 as NLFE outcompetes the other models for all investigated tree species but Q. variabilis, where R2 as NLFE performs better. The second-best model fit according to the AIC by tree species is provided by R2 as NLFE for most of the investigated tree species; only for P. armandii R1 as NLME and for Q. variabilis R1 as NLFE are the second-best fitting models according to the AIC (Table 3).
| Table 3. Akaike information criterion (AIC), root mean square error (RMSE) and bias (ē) for all fitted height growth models based on the five dynamic equations and fitted with both approaches the nonlinear mixed-effects model approach (NLME) and the nonlinear model approach with dummy variables (NLFE) to all investigated tree species Pinus tabuliformis, Pinus armandii, Larix principis-rupprechtii, Quercus liaotungensis, Quercus variabilis, Quercus aliena and Betula platyphylla | ||||||||||
| tree species | approach | model | AIC | RMSE | ē | approach | model | AIC | RMSE | ē |
| P. tabuliformis | NLME | L1 | –4596.3 | 34.63 | 28.79 | NLFE | L1 | –4465.8 | 34.61 | 28.7 |
| L2 | –4541 | 34.59 | 28.75 | L2 | –4446.7 | 34.6 | 28.68 | |||
| L3 | –4337.3 | 34.4 | 28.63 | L3 | –4305.2 | 34.39 | 28.55 | |||
| R1 | –4650.7 | 34.5 | 28.63 | R1 | –4716 | 34.48 | 28.56 | |||
| R2 | –4574.5 | 34.44 | 28.58 | R2 | –4657.8 | 34.46 | 28.53 | |||
| P. armandii | NLME | L1 | –2744.4 | 26.12 | 21.68 | NLFE | L1 | –2636.1 | 26.19 | 21.69 |
| L2 | –2703.5 | 26.11 | 21.67 | L2 | –2610.7 | 26.16 | 21.65 | |||
| L3 | –2583.1 | 26.05 | 21.64 | L3 | –2525 | 26.07 | 21.58 | |||
| R1 | –2794.8 | 25.96 | 21.49 | R1 | –2818.2 | 25.99 | 21.44 | |||
| R2 | –2739.2 | 25.94 | 21.48 | R2 | –2774 | 25.97 | 21.42 | |||
| L. principis-ruprpechtii | NLME | L1 | –380.1 | 10.68 | 8.65 | NLFE | L1 | –332.8 | 10.76 | 8.67 |
| L2 | –378.9 | 10.67 | 8.64 | L2 | –333.4 | 10.78 | 8.68 | |||
| L3 | –350.1 | 10.58 | 8.58 | L3 | –324.3 | 10.67 | 8.61 | |||
| R1 | –408.1 | 10.45 | 8.37 | R1 | –475.7 | 10.5 | 8.38 | |||
| R2 | –402.9 | 10.44 | 8.36 | R2 | –437.2 | 10.47 | 8.3 | |||
| Q. liaotungensis | NLME | L1 | –2104.9 | 43.17 | 33.75 | NLFE | L1 | –2111.3 | 43.27 | 33.68 |
| L2 | –2110.8 | 43.18 | 33.73 | L2 | –2118.6 | 43.29 | 33.68 | |||
| L3 | –2116.8 | 43.09 | 33.63 | L3 | –2169.9 | 43.28 | 33.64 | |||
| R1 | –2210 | 42.82 | 33.41 | R1 | –2232.1 | 42.68 | 33.21 | |||
| R2 | –2200.2 | 42.86 | 33.41 | R2 | –2224.9 | 42.8 | 33.28 | |||
| Q. variabilis | NLME | L1 | –1322.1 | 26.21 | 21.5 | NLFE | L1 | –1336.5 | 26.32 | 21.56 |
| L2 | –1340.8 | 26.2 | 21.46 | L2 | –1352.2 | 26.34 | 21.54 | |||
| L3 | –1345.6 | 26.1 | 21.35 | L3 | –1370.9 | 26.24 | 21.41 | |||
| R1 | –1415 | 25.91 | 21.17 | R1 | –1492.5 | 25.94 | 21.12 | |||
| R2 | –1439.4 | 25.91 | 21.14 | R2 | –1514 | 25.99 | 21.12 | |||
| Q. aliena | NLME | L1 | –2469.6 | 30.49 | 25.3 | NLFE | L1 | –2536.3 | 30.46 | 25.2 |
| L2 | –2464.5 | 30.48 | 25.29 | L2 | –2536.2 | 30.48 | 25.2 | |||
| L3 | –2417.8 | 30.37 | 25.19 | L3 | –2501.7 | 30.38 | 25.13 | |||
| R1 | –2555.2 | 30.28 | 25.09 | R1 | –2656.4 | 30.22 | 24.97 | |||
| R2 | –2538 | 30.27 | 25.08 | R2 | –2639.7 | 30.27 | 25 | |||
| B. platyphylla | NLME | L1 | –207.1 | 22.66 | 16.54 | NLFE | L1 | –238.3 | 22.77 | 16.56 |
| L2 | –187.6 | 22.64 | 16.51 | L2 | –231.7 | 22.78 | 16.55 | |||
| L3 | –118.3 | 22.49 | 16.35 | L3 | –188.6 | 22.64 | 16.38 | |||
| R1 | –224.6 | 22.53 | 16.34 | R1 | –286.4 | 22.68 | 16.4 | |||
| R2 | –199.4 | 22.51 | 16.3 | R2 | –271.2 | 22.72 | 16.39 | |||
The RMSE and ē are not clearly showing overall better fitting models and the differences between the models for each tree species are in general small. Also, the better fitting models according to RMSE and ē are not consistently in line with the AIC; only for Q. liaotungensis and Q. aliena all three fit statistics indicate the same best fitting model being R1 as NLFE. For Q. variabilis ē is showing the same best fit as the AIC, being R2 as NLFE (Fig. 3). For P. tabuliformis, P. armandii and B. platyphylla we defined the best fitting model as the one with the lowest AIC, which in all three cases is R1 as NLFE (Table 3).
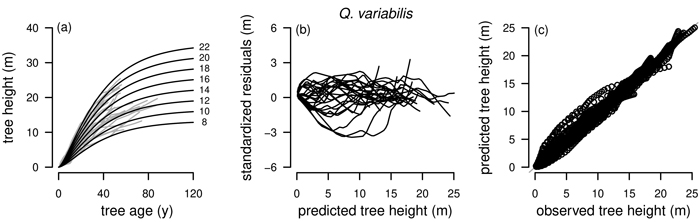
Fig. 3. Plots of the fitted nonlinear model with dummy variables (NLFE) R2 to height growth data from Quercus variabilis. a): family of polymorphic height growth curves with varying asymptotes; numbers after each height growth curve indicate corresponding modelled tree height at base age 40, grey lines in the background indicate observed tree height values. b): residual plots of standardized residuals vs. predicted tree heights. c): predicted tree heights vs. observed tree heights.
Graphical inspections of fitted curve profiles, residual plots and predicted vs. observed values were carried out for all fitted models. For P. tabuliformis, P. armandii, Q. liaotungensis, Q. aliena and B. platyphylla graphical analyzes were satisfactory for the best model R1 as NLFE according to the statistical criteria with random patterns of residuals around zero and no obvious trends. For simplification, for these tree species only the plots for R1 as NLFE are shown (Fig. 4).
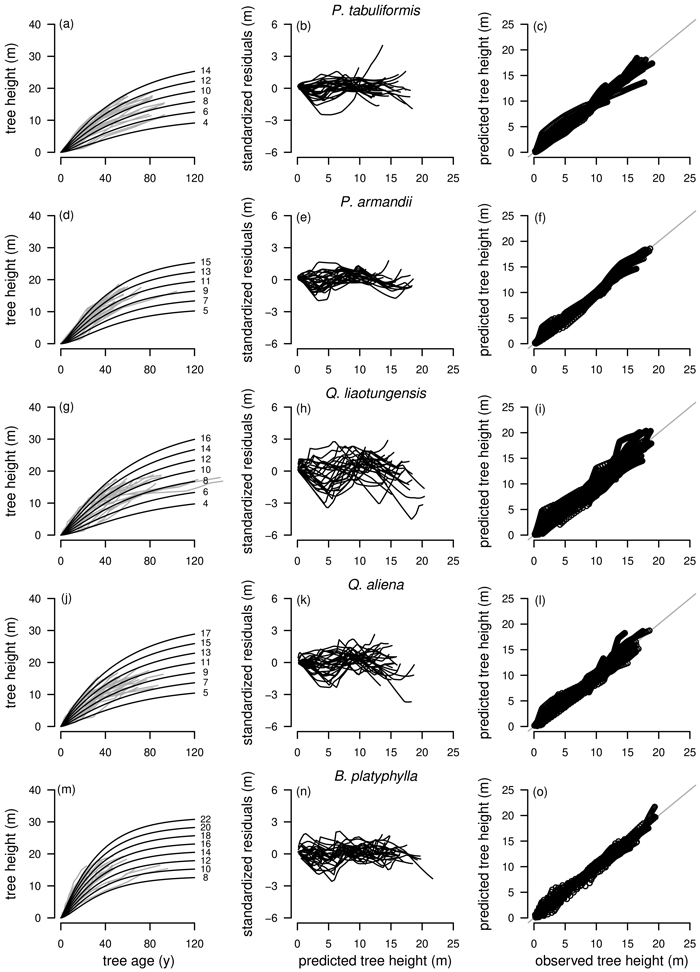
Fig. 4. Tree species Pinus tabuliformis, Pinus armandii, Quercus liaotungensis, Quercus aliena and Betula platyphylla are organized in rows, plot types of the fitted nonlinear models with dummy variables (NLFE) R1 to height growth data are organized in columns. First column: families of polymorphic height growth curves with varying asymptotes; numbers after each height growth curve indicate corresponding modelled tree height at base age 40, grey lines in the background indicate observed tree height values. Second column: residual plots of standardized residuals vs. predicted tree heights. Third column: predicted tree heights vs. observed tree heights.
Model selection for L. principis-rupprechtii is particularly difficult as the curve profiles of the best fitting model R1 as NLFE according to the AIC were not satisfactory as no height growth was present after an age of about 60 years. This was also the case for the three subsequent models according to the AIC, R2 as NLFE and R1 and R2 as NLME. Only L1 as NLME with the fifth lowest AIC was adequate, as L. principis-rupprechtii is growing rapidly and can reach heights between 35 m and 40 m (Yao et al. 2013). For L. principis-rupprechtii the curve profile and the residual plots for R1 and R2 as NLFE, R1 and R2 as NLME and L1 as NLME are presented (Fig. 5).
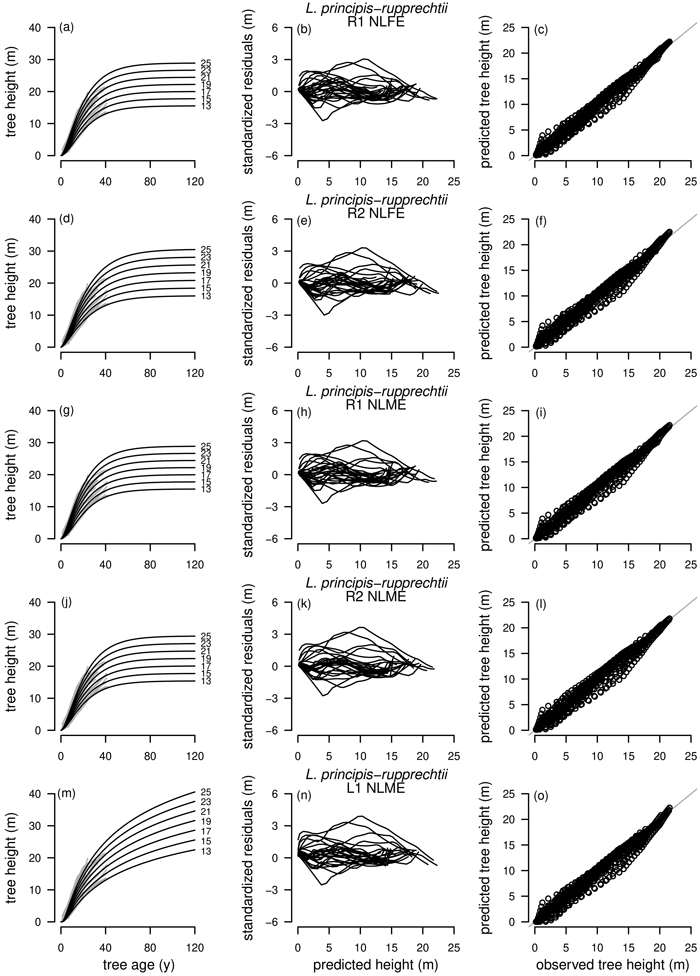
Fig. 5. Plot types of the fitted nonlinear models with dummy variables (NLFE) and nonlinear mixed-effects models (NLME) using the dynamic equations R1, R2 and L1 to height growth data of Larix principis-rupprechtii are organized in columns. First column: families of polymorphic height growth curves with varying asymptotes; numbers after each height growth curve indicate corresponding modelled tree height at base age 40, grey lines in the background indicate observed tree height values. Second column: residual plots of standardized residuals vs. predicted tree heights. Third column: predicted tree heights vs. observed tree heights.
The parameter estimates and test statistics of the selected models are presented in Table 4. All estimated parameters were highly significant with p < 0.0001.
| Table 4. Estimated parameter values for the best fitting height growth model of each investigated tree species Pinus tabuliformis, Pinus armandii, Larix principis-rupprechtii, Quercus liaotungensis, Quercus variabilis, Quercus aliena and Betula platyphylla with standard errors, t-statistics and p-values. | ||||||
| tree species | model | parameter | estimate | standard error | t-value | p-value |
| P. tabuliformis | R1 NLFE | X | 2.6284 | 0.055 | 47.74 | <0.0001 |
| k | 0.0175 | 0.0007 | 26.48 | <0.0001 | ||
| α | 3.5901 | 0.0334 | 107.38 | <0.0001 | ||
| P. armandii | R1 NLFE | X | 2.8004 | 0.0566 | 49.43 | <0.0001 |
| k | 0.0249 | 0.0011 | 23.19 | <0.0001 | ||
| α | 4.2164 | 0.061 | 69.1 | <0.0001 | ||
| L. principis-rupprechtii | L1 NLME | X | 4.1185 | 0.0835 | 49.34 | <0.0001 |
| α | 32.7942 | 0.5528 | 59.33 | <0.0001 | ||
| m | 0.5198 | 0.0212 | 24.52 | <0.0001 | ||
| Q. liaotungensis | R1 NLFE | X | 3.1125 | 0.0713 | 43.65 | <0.0001 |
| k | 0.0167 | 0.0011 | 15.02 | <0.0001 | ||
| α | 3.872 | 0.0675 | 57.33 | <0.0001 | ||
| Q. variabilis | R2 NLFE | X | 3.0037 | 0.0676 | 44.4 | <0.0001 |
| k | 0.0318 | 0.0014 | 23.17 | <0.0001 | ||
| α | 1.1591 | 0.0335 | 34.61 | <0.0001 | ||
| Q. aliena | R1 NLFE | X | 2.9198 | 0.0647 | 45.14 | <0.0001 |
| k | 0.0182 | 0.0011 | 16.68 | <0.0001 | ||
| α | 3.419 | 0.0459 | 74.54 | <0.0001 | ||
| B. platyphylla | R1 NLFE | X | 2.6749 | 0.1198 | 22.32 | <0.0001 |
| k | 0.0326 | 0.0023 | 13.88 | <0.0001 | ||
| α | 3.9128 | 0.0843 | 46.42 | <0.0001 | ||
For all fitted models the introduction of the autocorrelation structure of order 1 with continuous time covariate increased the model fit by clearly lowering the AIC, the RMSE and ē.
4 Discussion
In this study, we used nonlinear mixed-effects models (NLME) with random individual effects and nonlinear models with dummy variables as fixed individual effects (NLFE) to describe height growth of the 7 economically most important tree species in Zhongtiaoshan forest region of southern Shanxi province by fitting five dynamic equations derived from two sigmoidal base equations utilizing the generalized algebraic difference approach (GADA) (Cieszewski and Bailey 2000) (Table 2). The best fitted models are the R1 as NLFE for P. tabuliformis, P. armandii, Q. liaotungensis, Q. aliena and B. platyphylla, the R2 as NLFE for Q. variabilis – both derived from the Richards base equation (Richards 1959) – and the L1 as NLME for L. principis-rupprechtii derived from the Lundqvist base equation (Lundqvist 1958). The desired criteria of growth functions (height of 0 m at specific beginning, maximization against an asymptote and presence of an inflection point) are met with the families of site index curves all showing polymorphism and varying asymptotes. They also inherit further desired properties, such as base-age invariance, to provide consistent predictions (Clutter et al. 1983).
The sampling design with one sample tree per forest stand limits the model formulation to one level of nesting for the individual tree. With a single level of nesting the actual hierarchical structure of the tree level being nested in the stand level could not be represented. Thus, the variability in the model could not be divided to the within- and between-stand variability. Nothdurft et al. (2006) presents such a nonlinear hierarchical mixed model with tree and plot levels. To obtain the needed data structure, inside forest stands multiple trees need to be sampled to receive information about the within-stand variability.
The best approach to estimate GADA model parameters is still debated in the literature. Cieszewski and Strub (2018) found that the NLFE approach was superior compared to the NLME approach in terms of base-age invariance and path invariance and in terms of fit statistics. The last finding is also in line with our results according to the AIC. The same results are supported by Weiskittel et al. (2009) Nigh (2015) and Socha et al. (2021). However, even though differences according to the AIC are large, they are small according to the RMSE and ē, as no correction for the number of model parameters is made for the last two fit statistics (Eqs. 7,8). Wang et al. (2008) conclude that based on the RMSE the NLME approximates the NLFE well in its ability of describing the fit data. They also mention that one would favor the NLFE approach over the NLME approach, as site-specific effects may not follow a specific distribution.
Values for fit statistics as used in the present study need to be treated with caution when it comes to comparisons between the two model fitting methods NLME and NLFE. Nevertheless, in many studies comparing NLME and NLFE methods, decision for the best height growth models are made solely on fit statistics like ll, AIC, the finite-sample corrected version of the AIC, mean absolute error (MSE), RMSE, residual standard error, coefficient of determination (R2) and adjusted R2 ![]() (Weiskittel et al. 2009; Wang et al. 2008; Socha et al. 2021; Nigh 2015). Mehtätalo and Lappi (2020) mention that R2 and
(Weiskittel et al. 2009; Wang et al. 2008; Socha et al. 2021; Nigh 2015). Mehtätalo and Lappi (2020) mention that R2 and ![]() can be misleading for several reasons and that the MSE, consequently also the RMSE, is lower in NLMEs than in NLFEs. Furthermore, NLMEs lead to conditional bias of random effects, which increases with decreasing sample size, whereas NLFEs are conditionally unbiased. The decision, weather the tree effect should be random or fixed, should ideally be made prior to model fitting based on the objective, if only the sampled trees are of interest or if the sampled trees can be regarded as a sample from a larger population. If the latter is the case, then NLMEs utilize the mean and variability of the group effects in the population and predictions for new groups can be made, which is not possible if NLFEs are used (Mehtätalo and Lappi 2020). Thus, NLMEs are more generalizable and more broadly applicable than NLFEs.
can be misleading for several reasons and that the MSE, consequently also the RMSE, is lower in NLMEs than in NLFEs. Furthermore, NLMEs lead to conditional bias of random effects, which increases with decreasing sample size, whereas NLFEs are conditionally unbiased. The decision, weather the tree effect should be random or fixed, should ideally be made prior to model fitting based on the objective, if only the sampled trees are of interest or if the sampled trees can be regarded as a sample from a larger population. If the latter is the case, then NLMEs utilize the mean and variability of the group effects in the population and predictions for new groups can be made, which is not possible if NLFEs are used (Mehtätalo and Lappi 2020). Thus, NLMEs are more generalizable and more broadly applicable than NLFEs.
The base age t0 of 40 years was chosen to be relatively low. The often used base age for site productivity assessment is at 100 years, but is ranging from 15 to 100 years, usually depending on the average rotation length of forest stands (Weiskittel 2011). Most of the trees in Zhongtiaoshan forest region are rather young and rotation lengths varies between tree species. Also, the lengths of observations – especially for L. principis-rupprechtii – is in some cases relatively short, which is the reason why we selected a consistent base age of 40 years for all tree species.
Overall, GADA functions based on the Richards base equation performed better than GADA functions based on the Lundqvist base equation. The Richards equation is known for its flexibility (Richards 1959; Zeide 1993) but is outperformed by the Lundqvist equation for extrapolation of L. principis-rupprechtii in our study (Fig. 5). For R1 and R2 of both modelling approaches NLME and NLFE (Figs. 5a,d,g,j), height growth curves are levelling off as soon as no height/age data is present anymore, while the L1 as NLME is following the vigorous growth dynamics of L. principis-rupprechtii (Fig. 5m). This could indicate that the models R1 and R2 are in general suitable to model height growth of different tree species if height/age data is present for a long observation period due to the flexible character of the function, while for shorter observation periods and especially for extrapolation the L1 model is appropriate. However, additional research addressing this particular question is needed to prove this hypothesis.
In a follow-up research the presented height growth models need to be tested with independent data in order to investigate their external validity. In theory, different approaches exist for cross-validation, but these approaches always have the shortcoming of reducing the data set from which the model is built and may not provide additional information (Kozak and Kozak 2003). We therefore decided to use the full set of available data for modelling and to rely on information criteria such as AIC, RMSE and ē.
5 Conclusion
The presented families of height growth curves serve as a planning tool to identify site index and therefore assess site productivity for predicting stand volume growth in the region. A direct comparison of the productivity of forest stands of the same tree species is possible, even when stands are of different age, as their height can be predicted to identical age due to base-age invariance.
Declaration of openness of research materials, data, and code
The dataset and parts of the custom R-code for data analysis are available upon reasonable request by contacting the corresponding author. No other research material was used. The study and an analysis plan are not preregistered.
Authors’ contributions
All authors contributed to the study conception and design and performed the field work tasks. Lars Sprengel supervised and carried out the data acquisition with support from Heinrich Spiecker. Lars Sprengel analyzed the data. All authors interpreted the results. The first draft of the manuscript was written by Lars Sprengel and all authors commented and critically revised on previous versions of the manuscript. All authors read and approved the final manuscript and take full responsibility on its contents.
Acknowledgements
All climate data was provided by the Chinese Academy of Forestry in Beijing. The stem discs were collected, processed and scanned in collaboration with the staff from Zhongtiaoshan Forest Bureau and the Chinese Academy of Forestry, with special thanks to Mr. Yingjian Wu, Mr. Xinjian Zhang, Mr. Fujun Duan, Mr. Linlong Wang and Dr. Chao Zhang. Additionally, the comments and suggestions of two reviewers helped to improve the quality of this manuscript.
Funding
This research was funded by the German Federal Ministry of Education and Research (BMBF) within the project Lin4Future, grant number 01LZ1701A, and the German Federal Ministry of Food and Agriculture (BMEL) within the project Chinawald, grant number 28I-010-01, and supported by the special fund for basic scientific research of central level public welfare scientific research institutes (CAFYBB2020MC002), National Natural Science Foundation of China (31270681). The article processing charge was funded by the Baden-Wuerttemberg Ministry of Science, Research and Art and the University of Freiburg in the funding program Open Access Publishing. The funders had no role in the design of the study; in the collection, analyses, or interpretation of data; in the writing of the manuscript, or in the decision to publish the results.
References
Akaike H (1973) Information theory and an extension of maximum likelihood principle. In: Parzan E, Tanabe K, Kitagawa G (eds) Selected papers of Hirotugu Akaike. New York. Springer, pp 199–213. https://doi.org/10.1007/978-1-4612-1694-0_15.
Bailey RL, Clutter JL (1974) Base-age invariant polymorphic site curves. For Sci 20: 155–159.
Burkhart HE, Tomé M (2012) Modeling forest trees and stands. Springer, Dordrecht. https://doi.org/10.1007/978-90-481-3170-9.
Carmean WH (1972) Site index curves for upland oaks in the Central States. For Sci 18: 109–120.
Changxiong C (1995) Growth and yield model for Chinese fir in northern Fujian province. [in Chinese]. J Fujian Forest Coll 3: 223–225.
Cieszewski CJ (2003) Developing a well-behaved dynamic site equation using a modified Hossfeld IV function Y3 = (axm)/(c + xm–1), a simplified mixed-model and scant subalpine fir data. For Sci 49: 539–554.
Cieszewski CJ (2004) GADA derivation of dynamic site equations with polymorphism and variable asymptotes from Richards, Weibull, and other exponential functions. University of Georgia PMRC-TR 5: 2004.
Cieszewski CJ, Bailey RL (2000) Generalized algebraic difference approach: theory based derivation of dynamic site equations with polymorphism and variable asymptotes. For Sci 46: 116–126.
Cieszewski CJ, Strub M (2018) Comparing properties of self-referencing models based on nonlinear-fixed-effects versus nonlinear-mixed-effects modeling approaches. MCFNS 10: 46.
Clutter JL, Fortson JC, Pienaar LV, Brister GH, Bailey RL (1983) Timber management. A quantitative approach. Wiley. New York, Chichester.
Diéguez-Aranda U, Grandas-Arias JA, Álvarez-González JG, Gadow K (2006) Site quality curves for birch stands in north-western Spain. Silva Fenn 40: 631–644. https://doi.org/10.14214/sf.319.
Dyer ME, Bailey RL (1987) A test of six methods for estimating true heights from stem analysis data. For Sci 33: 3–13.
Eichhorn F (1904) Beziehungen zwischen Bestandshöhe und Bestandsmasse. [Relationship between stand height and stand mass]. Allg Forst- Jagdztg 80: 45–49.
Fabbio G, Frattegiani M, Manetti MC (1994) Height estimation in stem analysis using second differences. For Sci 40: 329–340.
Fox J, Weisberg S (2018) Nonlinear regression, nonlinear least squares, and nonlinear mixed models in R. An appendix to an R companium to applied regression. https://socialsciences.mcmaster.ca/jfox/Books/Companion/appendices/Appendix-Nonlinear-Regression.pdf. Accessed 14.12.2021.
Guay R, Gagnon R, Morin H (1992) A new automatic and interactive tree ring measurement system based on a line scan camera. For Chron 68: 138–141. https://doi.org/10.5558/tfc68138-1.
Hou J, Yin R, Wu W (2019) Intensifying forest management in China: what does it mean, why, and how? For Policy Econ 98: 82–89. https://doi.org/10.1016/j.forpol.2017.10.014.
Hua W, Ye H, Rau J-Y, Qiu T (2020) Dynamic prediction of uneven-aged natural forest for yield of Pinus taiwanensis using joint modelling. Environ Monit Assess 192, article id 239. https://doi.org/10.1007/s10661-020-8204-7.
Huang S, Yang Y, Wang Y (2003) A critical look at procedures for validating growth and yield models. In: Amaro A, Reed D, Soares P (eds) Modelling forest systems. CABI Publishing. Wallingford. https://doi.org/10.1079/9780851996936.0271.
Kindermann GE (2016) Evaluation of growth functions for tree height modelling. Austrian J For Sci 133: 353–376.
Koirala A, Montes CR, Bullock BP (2021) Modeling dominant height using stand and water balance variables for loblolly pine in the Western Gulf, US. For Ecol Manag 479: article id 118610. https://doi.org/10.1016/j.foreco.2020.118610.
Kozak A, Kozak R (2003) Does cross validation provide additional information in the evaluation of regression models? Can J For Res 33: 976–987. https://doi.org/10.1139/x03-022.
Kraft G (1884) Beiträge zur Lehre von den Durchforstungen, Schlagstellungen und Lichtungshieben. [Contributions to the theory of thinning, cutting and release felling]. Klindworth, Hannover.
Lappi J (2006) Smooth height/age curves from stem analysis with linear programming. Silva Fenn 40: 291–301. https://doi.org/10.14214/sf.344.
Lappi J, Bailey RL (1988) A height prediction model with random stand and tree parameters: an alternative to traditional site index methods. For Sci 34: 907–927.
Li Q, Liu Y, Song H, Cai Q, Yang Y (2013) Long-term variation of temperature over North China and its links with large-scale atmospheric circulation. Quart Int 283: 11–20. https://doi.org/10.1016/j.quaint.2012.03.017.
Lindstrom MJ, Bates DM (1990) Nonlinear mixed effects models for repeated measures data. Biometrics 46: 673–687. https://doi.org/10.2307/2532087.
Liu P, Yin R (2012) Sequestering carbon in China’s forest ecosystems: potential and challenges. Forests 3: 417–430. https://doi.org/10.3390/f3020417.
Lundqvist B (1958) Om höjdutvecklingen i kulturbestånd av tall och gran i Norrland. [Height development in cultures of Norway spruce and Scots pine in northem Sweden]. Stat Skogsforskinst Meddel 47: 64.
Mehtätalo L, Lappi J (2020) Biometry for forestry and environmental data with examples in R. Chapman & Hall/CRC. Boca Raton. https://doi.org/10.1201/9780429173462.
Ministry of Ecology and Environment of the People‘s Republic of China (2019) China‘s policy and actions for addressing climate change (2019). https://english.mee.gov.cn/Resources/Reports/reports/201912/P020191204495763994956.pdf. Accessed 19 August 2021.
Missouri Botanical Garden (2021) Tropicos. http://www.tropicos.org. Accessed 5 March 2021.
National Forestry and Grassland Administration (2019) China forest resources report 2014–2018. [in Chinese]. China Forestry Publishing House, Beijing.
Newberry JD (1991) A note on Carmean’s estimate of height from stem analysis data. For Sci 37: 368–369.
Nigh G (2015) Engelmann spruce site index models: a comparison of model functions and parameterizations. PloS one 10, article id e0124079. https://doi.org/10.1371/journal.pone.0124079.
Nothdurft A, Kublin E, Lappi J (2006) A non-linear hierarchical mixed model to describe tree height growth. Eur J Forest Res 125: 281–289. https://doi.org/10.1007/s10342-006-0118-6.
Özçelik R, Cao QV, Gómez-García E, Crecente-Campo F, Eler Ü (2019) Modeling dominant height growth of cedar (Cedrus libani A. Rich) stands in Turkey. For Sci 65: 725–733. https://doi.org/10.1093/forsci/fxz038.
Pinheiro JC, Bates DM (2000) Mixed effects models in S and S-PLUS. Springer, New York. https://doi.org/10.1007/978-1-4419-0318-1.
Pinheiro JC, Bates DM, DebRoy S, Sarkar D, R Core Team (2020) nlme: linear and nonlinear mixed effects models. R Package Version 3.1-151.
R Core Team (2020) R: a language and environment for statistical computing. Vienna.
Regent Instruments Canada Inc. (2012) WinDENDRO manual. Québec.
Richards FJ (1959) A flexible growth function for empirical use. J Exp Bot 10: 290–301. https://doi.org/10.1093/jxb/10.2.290.
RStudio Team (2019) RStudio: integrated development environment for R. Boston.
Seki M, Sakici OE (2017) Dominant height growth and dynamic site index models for Crimean pine in the Kastamonu–Taşköprü region of Turkey. Can J For Res 47: 1441–1449. https://doi.org/10.1139/cjfr-2017-0131.
Shouzheng T, Xifei L (2012) Precision analysis on growth rates estimated by integrated whole stand growth and yield model. [in Chinese]. Lin Ye Ke Xue Yan Jiu 8: 471–476.
Socha J, Tymińska-Czabańska L, Grabska E, Orzeł S (2020) Site index models for main forest-forming tree species in Poland. Forests 11, article id 301. https://doi.org/10.3390/f11030301.
Socha J, Tymińska-Czabańska L, Bronisz K, Zięba S, Hawryło P (2021) Regional height growth models for Scots pine in Poland. Scientific reports 11, article id 10330. https://doi.org/10.1038/s41598-021-89826-9.
Sprengel L, Cheng Z, Hipler S-M, Wu S, Spiecker H (2020) Mean annual wood density variations of Larix gmelinii (Rupr.), Quercus mongolica Fisch. ex Ledeb., and Pinus tabulaeformis Carr. at two different stem heights. Forests 11, article id 394. https://doi.org/10.3390/f11040394.
State Forestry Administration (2018) National Forest Management Plan 2016–2050. [in Chinese]. China Forestry Publishing House, Beijing.
van Laar A, Akça A (2007) Forest mensuration. Springer, Dordrecht. https://doi.org/10.1007/978-1-4020-5991-9.
Vanclay JK (1994) Modelling forest growth and yield. Applications to mixed tropical forests. CAB International, Wallingford.
Wang M, Borders BE, Zhao D (2008) An empirical comparison of two subject-specific approaches to dominant heights modeling: the dummy variable method and the mixed model method. For Ecol Manag 255: 2659–2669. https://doi.org/10.1016/j.foreco.2008.01.030.
Wei-Wei JX-J, Feng-Ri LI (2008) Whole stand growth model for natural Dahurian larch forests based on BP ANN. [in Chinese]. Bull Bot Res 28: 370–374.
Weiskittel AR (2011) Forest growth and yield modeling. Wiley-Blackwell, Chichester. https://doi.org/10.1002/9781119998518.
Weiskittel AR, Hann DW, Hibbs DE, Lam TY, Bluhm AA (2009) Modeling top height growth of red alder plantations. For Ecol Manag 258: 323–331. https://doi.org/10.1016/j.foreco.2009.04.029.
Yao YT, Zhang JZ, Hu JF (2013) Larix Principis-Rupprechtii. Agricultural Science and Technology Press of China, Beijing, China.
Zeide B (1993) Analysis of growth equations. For Sci 39: 594–616. https://doi.org/10.1093/forestscience/39.3.594.
Zuyuan H, Xinyou D (1989) Growth and yield models for Chinese white poplar. [in Chinese]. Sci Silva Sin 26: 120–126.
Total of 58 references.
Send to email
