Ferréol Berendt  ,
Felix Wolfgramm,
Tobias Cremer
,
Felix Wolfgramm,
Tobias Cremer
Reliability of photo-optical measurements of log stack gross volume
Berendt F., Wolfgramm F., Cremer T. (2021). Reliability of photo-optical measurements of log stack gross volume. Silva Fennica vol. 55 no. 3 article id 10555. https://doi.org/10.14214/sf.10555
Highlights
- Gross volume estimations of larger log stacks showed a smaller deviation compared to those of piles with smaller volumes
- Log stack quality affects estimation accuracy
- The deviations between the manual section-wise estimations were of similar amplitude as those for the photo-optical estimations.
Abstract
In terms of assessing economic impact, one of the most important elements in the wood supply chain is the measurement of round wood. Besides the one-by-one measurement of logs, logs are often measured when stacked at the forest road. The gross stacked volume includes the volume of the wood, bark and airspace and is widely used for industrial wood assortments. The increasing international attention given to photo-optical measurement systems for portable devices is due to their simplicity of use and efficiency. The aim of this study was to compare the gross volumes of hardwood log stacks measured using one widespread photo-optical app with two manual section-wise volume estimations of log stacks based on the German framework agreement for timber trade (RVR). The manual volume estimations were done starting from the left (RVRleft) and right (RVRright) sides of the log stacks. The results showed an average deviation of the photo-optical gross volume estimation in comparison to the manual estimation of –2.09% (RVRleft) and –3.66% (RVRright) while the deviation between RVRleft and RVRright was +2.54%. However, the log stack gross volume had a highly significant effect on the deviation and better accuracy with smaller deviation were reached for larger log stacks. Moreover, results indicated that the gross volume estimations of higher quality log stacks were closer for the three analyzed methods compared to estimations of poor-quality log stacks.
Keywords
photogrammetry;
timber trade;
logistic;
volume estimation;
wood pile
-
Berendt,
Department of Forest Utilization and Timber Markets, Eberswalde University for Sustainable Development, 16225 Eberswalde, Germany
 https://orcid.org/0000-0002-6285-7590
E-mail
ferreol.berendt@hnee.de
https://orcid.org/0000-0002-6285-7590
E-mail
ferreol.berendt@hnee.de
- Wolfgramm, Landesforst MV Anstalt des öffentlichen Rechts, Forstamt Billenhagen, 18182 Blankenhagen, Germany E-mail felixwolfgramm@yahoo.de
- Cremer, Department of Forest Utilization and Timber Markets, Eberswalde University for Sustainable Development, 16225 Eberswalde, Germany E-mail tobias.cremer@hnee.de
Received 19 April 2021 Accepted 7 June 2021 Published 10 June 2021
Views 41042
Available at https://doi.org/10.14214/sf.10555 | Download PDF

1 Introduction
The accurate measurement of harvested wood is, in an economic sense, one of the most important tasks in the wood supply chain. For sales purposes and for the calculation of bills in Germany, the measurement systems must be calibratable according to the national metrology institute of Germany (PTB, Physikalisch-Technische Bundesanstalt) as a means of ensuring the reproducibility and repeatability of measurement results. Timber measurement systems currently used for sales purposes according to legal requirements are i) the manual method, ii) opto-electronic systems and iii) the photo-optical method (Hohmann et al. 2017). The one-by-one measurement of logs is the most accurate technique (Knyaz and Maksimov 2014) and is widely used at the infeed of sawmills through opto-electronic measurement devices. Nevertheless, in some cases, the electronic measurement of individuals logs is not feasible due to various reasons such as quality of the wood, absence of technical facilities, time constraints or when costly measurements are not justified (Smith 1979; Knyaz and Maksimov 2014; Pásztory et al. 2019). Alternatively, the wood can be measured as stacked wood. However, a “major drawback to the use of the stacked-wood measure is that it includes the volume of wood, bark, air space, and foreign matter which vary in their proportions” (Smith 1979). That is probably why only two photo-optical measurement systems (sScale™, Dralle A/S and LogStackPro, HD Silva, both Denmark) are currently calibrated and thereby fulfil the legal requirements to be used for official billing purposes in Germany. Still, other photo-optical measurement systems, which are mostly smartphone based, have gained increasing attention throughout Europe and within international markets in recent years. Moreover, in the course of the fast digitalization process in forestry, several photo-optical systems to facilitate estimation of log stack volumes are currently available on international markets (Herbon 2015; Boberg and Lilja 2016; Opferkuch et al. 2017). Even though these are not eligible to be used for billing purposes, photo-optical measurement systems are used by many forest companies to determine log stack volumes because of their simplicity and efficiency. The results of the estimations are used by the forest companies as control measurements for documentation purposes but also for comparability reasons. Compared to manual measurement methods, which is time consuming and dependent on individual performance, photo-optical measurement systems are faster, uncomplicated and allow a comprehensive documentation of the measurement (Jodłowski et al. 2016; Pásztory et al. 2019).
Initial research shows satisfying results regarding the accuracy of photo-optical estimations, with better results for sawlog stacks than for pulpwood log stacks (Jodłowski et al. 2016; Cremer and Blasko 2017). This research was mainly related to softwood, and detailed analysis on the accuracy of these volume estimations when used to measure hardwood log stacks is not yet available. However, given that the share of hardwoods has increased in Germany over recent years and will increase even further in coming years to improve resistance and resilience of forests to climate change (Berendt et al. 2017), having data on the accuracy of hardwood log stacks volume estimations is of great relevance. Moreover, from our expertise and experiences, we observed differences in timber quality for industrial or energetic assortments when looking at hardwoods in comparison to coniferous tree species: as such assortments are often taken from the trees’ top parts or crowns of the trees, the proportion of e.g. crooked timber is much higher when looking at hardwoods. Crook, taper and ovality of logs affects the packaging quality of log stacks and, thus, leads to considerably more interstices in the log stack and a more heterogeneous log stack height. These factors can in turn lead to varying log stack gross volumes even though the solid wood volume of the piles may be the same (Heinzmann and Barbu 2017).
Therefore, the aim of this study was to analyze the accuracies of log stacks gross volume estimations by photo-optical and manual section-wise methods for hardwoods. The traditional manual log stack measurement that has been used to date as well as a widespread app for smartphones were tested regarding their accuracy of gross volume estimations. Moreover, factors that potentially influence the accuracy of the photo-optical measurements and therewith the deviation from the traditional manual log stack measurement were evaluated. The analyzed factors were weather or light conditions; tree species composition; log stack size; and the quality of the analyzed log stack (i.e., quality of the piling itself). Consequently, it could be expected that the volume deviations between measurement methods would increase with (i) decreasing log stack quality, (ii) decreasing log stack gross volume, and (iii) poorer light conditions.
2 Material and methods
2.1 Log stacks
In total, 109 log stacks were analyzed, representing approximately 5540 m3. All volumes were estimated as gross stacked cubic meter (m3) volume, which contains wood, bark and airspace, with timber of similar length piled parallel to each other (Ministry of Natural resources and Forestry 2017). The log stacks were all located in Schleswig-Holstein, in North Germany, and were measured between October 2019 and April 2020. The log stacks all comprised industrial wood assortments of broadleaved tree species, mainly European beech (Fagus sylvatica L.) and European ash (Fraxinus excelsior L.) or a mix of hardwoods with European beech and/or European ash. The other log stacks comprised maples (Acer pseudoplatanus L.) and/or oaks (Quercus robur L. and Quercus petraea (Matt.) Liebl.) and/or alders (Alnus glutinosa (L.) Gaertn.). The log stacks were categorized into i) beech (n = 34), ii) ash (n = 33), iii) mix of beech and ash (n = 15) and iv) other (n = 27), according to their tree species composition. Moreover, the log stacks were grouped into eight log stack size classes dependent on their stacked cubic meter gross volume estimated with the manual measurement (RVRleft). The size classes were: 0to 10 m3, >10 to 20 m3, >20 to 40 m3, >40 to 60 m3, >60 to 80 m3, >80 to 100 m3, >100 to 150 m3 and >150 m3.
Within the German framework agreement for timber trade (Rahmenvereinbarung für den Rohholzhandel in Deutschland (RVR)), requirements regarding how logs should be stacked to reach accurate results are defined: 1) log stacks should be piled as densely as possible, with evened ends, 2) no entry of branches and logging wastes or of extraneous matters (e.g. snow, ice), 3) a homogeneous log stack height, 4) free access to the front and back of the log stack, 5) only one timber length and a minimum log stack gross volume of 20 m3 (DFWR and DHWR 2020). Moreover, the log stack should be located next to a forest road and logs should be placed underneath the log stack as a stack base. Comparable requirements are set up for photo-optical measurement. However, a few of the log stacks did not fulfill these requirements: some were smaller than 20 m3, some were not piled on logs but rather directly on the forest ground and some were higher than the given range for an optimal utilization of the app. Still, as the goal of the research was to cover the whole range of piles that can be found in practice, these log stacks were also included in the analysis. Prior to the measurement of each log stack, the weather and light conditions were characterized as follows: sunny, rainy, cloudy, or twilight. Additionally, the quality of log stacks was categorized into four classes: best, good, medium or poor. Best quality log stacks referred to log stacks where all requirements were fulfilled. Log stacks of good quality had no logs underneath the log stack, medium quality log stacks had a deficiency in one of the other requirements and poor-quality log stacks had more than one deficiency. Looking at the quality of the log stacks, only two log stacks were found to be of best quality, while most of the log stacks (47.7%) were found to be of medium quality. According to Fig. 1, a trend of better log stack quality for large log stacks was observed, whereas log stacks of smaller dimensions (up to approximately 60 m3) were mostly of lower quality.
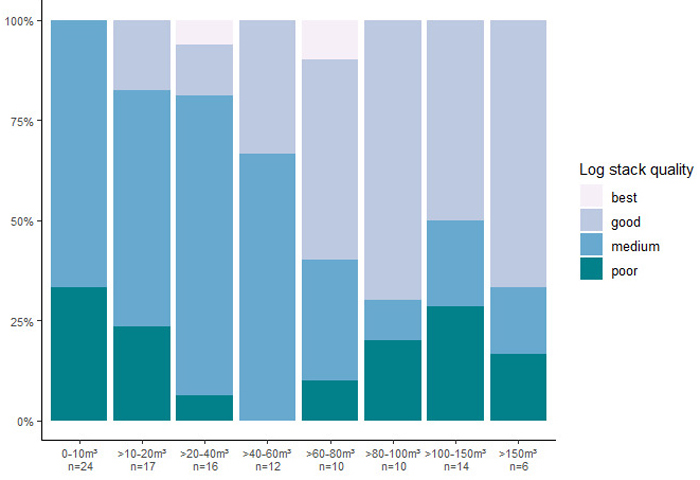
Fig. 1. Categorization of the analyzed hardwood log stacks into best, good, medium and poor quality for different log stack gross volume size classes.
2.2 Estimation of stacked cubic meter volume
All measurements were done by the same person to avoid discrepancies between different users and no reduction or conversion factors that could potentially distort the results were applied.
2.2.1 Manual measurements
The manual measurement procedure to estimate the stacked gross volume is described in the RVR. The log stack depth (T) is defined as the timber assortments length. The front side of the log stack is divided into equal-length sections (LS) that are dependent on the total log stack length (Table 1). All equal-length sections form the ‘stack part A’ with length LA, whereas the partial end section of the log stack with generally shorter length (LB) is called ‘stack part B’ (Fig. 2). In the middle of each equal-length section (LS/2), the respective height on both sides of the log stack is measured, accurate to a centimeter and using a calibrated measuring rod; the same is done for ‘stack part B’ at LB/2. With LA, T and the mean of all measured heights of stack part A (ØHA), the stacked gross volume in cubic meter of stack part A is calculated. The same is done with stack part B. Finally, the total gross volume of the log stack is calculated as the sum of volume from stack parts A and B:
![]()
| Table 1. Section length (LS) depending on log stack length (LAB) for section-wise log stack gross volume estimation, adapted from (DFWR and DHWR 2020). | |
| Log stack length (LAB) | Section length (LS) |
| 0–10 m | 1 m |
| >10–20 m | 2 m |
| >20–40 m | 4 m |
| >40–60 m | 6 m |
| >60–80 m | 7 m |
| >80–100 m | 8 m |
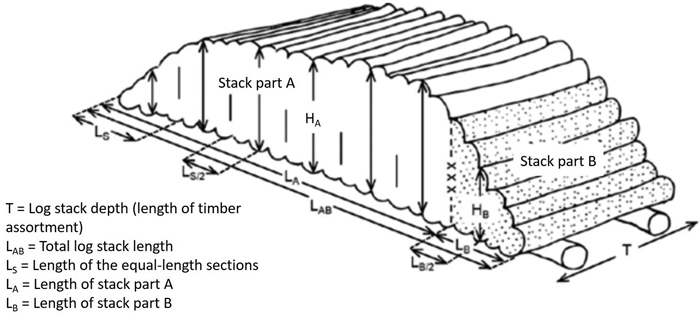
Fig. 2. Required measurement parameters and measurement locations for calculating stacked timber in cubic meter according to the German framework agreement for timber trade, adapted from (DFWR and DHWR 2020).
The measurements and the related calculations were undertaken twice using the methodology for manual log stack measurement described in the RVR: once starting from the left side of the log stack (RVRleft) and once starting from the right side (RVRright).
2.2.2 Photo-optical measurement system
To estimate the log stack gross volume photo-optically, the widespread app iFOVEA (App) was used. The versions 1.20.8 as well as 2.0.0 were used (an automatic update occurred in the course of the measurements). Using the app, photos of the front of the log stacks are taken and are stitched into one photo. The photos were taken at approximately 2 to 4 m distance from the log stack, as optimal results are achieved when the log stack takes up approximately 85% of the photo’s height. The photos were taken according to the instructions: camera parallel to the woodpile, constant distance to the log stack, photo overlap of at least 60%. A more detailed description of the functioning of the app and the related photo-optical measurements can be found in the user manuals on the webpage of the company (SDP Digitale Produkte GmbH 2020). To derive the log stack’s gross volume, the contour of the front was defined automatically: However, post-processing was always necessary and the contour was edited manually right after the image capturing (Fig. 3). On this basis, the front’s gross-area of log stack was calculated. In connection with the depth (timber assortment length), the gross volume of the log stack is calculated automatically. As a spatial reference for the app, the length of log stack must be measured manually and accurate to the centimeter with a measurement tape.
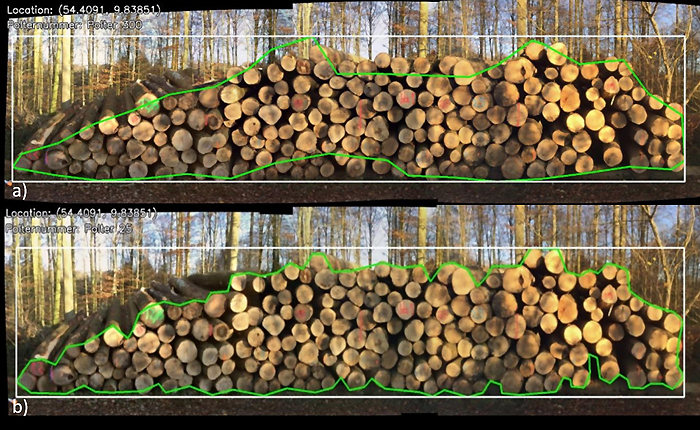
Fig. 3. Contour of the log stack as a) automatically defined by the app and b) with manual post-processing after image capturing with a photo-optical measurement application in order to determine log stack volume.
2.3 Data analysis
The deviation in percent from single measurement to the mean was used to describe and visualize the differences between the volume estimations. The deviation was defined as the percentage of the difference between two log stack gross volume estimations. Moreover, the measurement methods were compared through a one-way ANOVA to determine whether the means of the three analyzed log stack gross volume estimations differ from each other. For all statistical analysis the significance level was defined with 5%. Thus, a p-value < 0.05 provided a statistically significant result in the ANOVA. A p-value < 0.01 was considered as highly significant.
The effect of the observed independent variables ‘stack length’, ‘stack quality’, ‘weather and light’ as well as ‘tree species’ were analyzed with ANOVA method. The amplitude of the deviation between two measurement methods was used as the response variable. Thus, the three response variables were the absolute values of the deviations between (i) RVRleft and RVRright (‘RVRleft vs. RVRright’), (ii) RVRleft and App (‘RVRleft vs. App’), and (iii) RVRright and App (‘RVRright vs. App’).
3 Results
The mean length of the analyzed log stacks was 9.43 ± 6.05 m with a minimum and maximum of 2.42 and 33.70 m, respectively. The gross volume of the analyzed log stacks using RVRleft estimation was from 2.77 m3 to 394.95 m3 with a mean of 56.54 ± 62.20 m3. The one-way ANOVA showed that the means of the volume obtained by RVRleft, RVRright and App did not differ significantly (p = 0.98). When grouped into log stack size classes, differences in the volume estimation means seem to exist for specific log stack gross volume size classes but without any observable trend, as shown in the boxplots of Fig. 4.
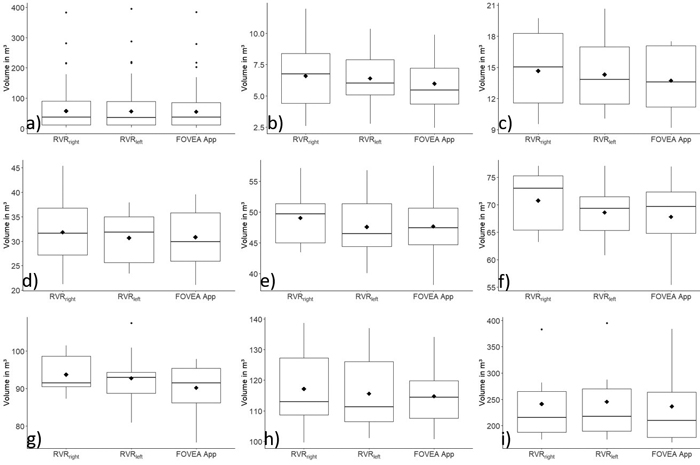
Fig. 4. Boxplots showing the mean (diamond) and median (continuous horizontal line) of the log stack gross volume (in m3) using RVRright, RVRleft and App for a) all log stacks (n = 109), b) 0–10 m3 (n = 24), c) >10–20 m3 (n = 17), d) >20–40 m3 (n = 16), e) >40–60 m3 (n = 12), f) >60–80 m3 (n = 10), g) >80–100 m3 (n = 10), h) >100–150 m3 (n = 14) and i) >150 m3 (n = 6). View larger in new window/tab.
When comparing the different gross volume estimation methodologies, the highest mean deviation of –5.21% was observed between RVRright and App for the log stack size class 10 to 20 m3 (Table 2). This means that the volume estimated by the app was 5.21% smaller than the volume estimated by RVRright. However, the range of deviation between the different volume estimations within log stack volume categories is much higher: in the smallest log stack size group (0 to 10 m3), the range of deviation was from –43.74 to 91.2% (Fig. 5).
| Table 2. Mean deviation between the different log stack gross volume estimations. | |||
| Mean deviation (±SD) between/ Gross volume of log stack | RVRleft and RVRright in % | RVRleft and App in % | RVRright and App in % |
| 0–10 m3 (n = 24) | 3.24 ± 30.21 | –4.89 ± 21.05 | –4.92 ± 17.43 |
| >10–20 m3 (n = 17) | 2.69 ± 11.90 | –3.16 ± 11.44 | –5.21 ± 10.55 |
| >20–40 m3 (n = 16) | 3.39 ± 8.52 | 0.30 ± 7.74 | –2.76 ± 6.47 |
| >40–60 m3 (n = 12) | 3.54 ± 8.77 | 0.53 ± 9.05 | –2.78 ± 6.06 |
| >60–80 m3 (n = 10) | 3.40 ± 7.70 | –1.26 ± 5.97 | –4.00 ± 9.11 |
| >80–100 m3 (n = 10) | 1.28 ± 5.25 | –2.58 ± 6.16 | –3.70 ± 6.12 |
| >100–150 m3 (n = 14) | 1.29 ± 3.11 | –0.49 ± 4.85 | –1.70 ± 5.28 |
| >150 m3 (n = 6) | –1.38 ± 2.65 | –3.70 ± 2.99 | –2.33 ± 2.75 |
| All log stacks (n = 109) | 2.54 ± 15.61 | –2.09 ± 12.00 | –3.66 ± 10.30 |
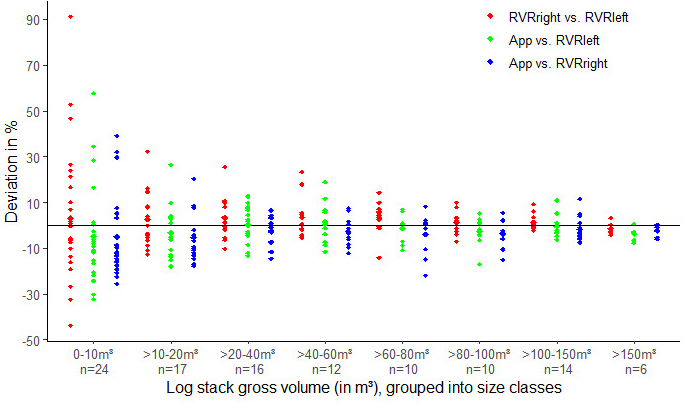
Fig. 5. Deviation (in %) of log stack gross volume estimations for different log stack size classes. In red, the deviation between RVRright and RVRleft; in green, between App and RVRleft; and in blue, between App and RVRright.
Looking at the independent variables that affected the deviation amplitude between the different gross volume estimations, only the log stack length had a highly significant effect on the three response variables. Moreover, the log stack quality influenced ‘RVRleft vs. RVRright’ significantly and ‘RVRright vs. App’ in a highly significant way (Fig. 6). For the response variable ‘RVRleft vs. App’, the p-value of the independent variable ‘stack quality’ was 0.06. While the weather and light conditions did not have any significant effect, the tree species composition of the log stack influenced significantly only the amplitude of the deviations between the estimations of RVRright and App.
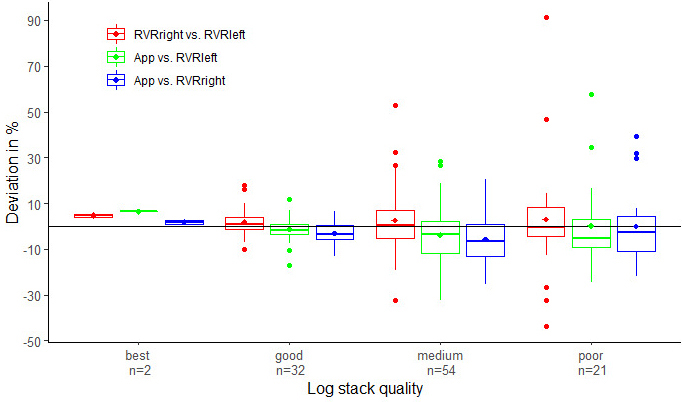
Fig. 6. Boxplot of the deviation of log stack gross volume estimations (in %) for different log stack qualities. In red, the deviation between RVRright and RVRleft; in green, between App and RVRleft; and in blue, between App and RVRright.
4 Discussion and conclusion
Accurate volume estimation of log stacks is of highest importance: when used for billing purposes, the volume should be determined as precisely as possible. Thus, measurement methodologies should provide reproducible results. The analyzed log stacks (n = 109) had a wide range of gross volumes (from 2.77 to 394.95 m3) and different hardwoods were included. For a better visualization of the results, the log stacks were grouped into eight size classes. Unfortunately, the number of analyzed log stacks was not homogeneously distributed over the different size classes. The study was conducted under real-world conditions and, thus, represents the typical distribution of log stack gross volumes of industry wood from broadleaved tree species. The importance of analyzing the performance of log stack volume estimation methods under real-world conditions was also pointed out by Herbon (2015). The forest workers were not informed about the study to ensure that log stack quality reflected a normal state. Overall, it can be said that the analyzed log stacks are representative of conditions in northern Germany. Therefore, the study results are of relevance for the different actors of the wood supply chain when discussing log stack measurement systems and methodologies. Moreover, the measurements were all performed by the same professional forester with several years of experience in log stack volume estimation. Thus, the comparison between the different gross volume estimations for different qualities and size classes is valid as it can be assumed that the measurements were consistent independent of log stack size class. However, the variance of the random effect when different users are measuring the same log stack should be quantified to see the effect of individuals on the log stack volume estimation for the different measurement methods, as shown by a Swedish study for one photo-optical log stack measurement app (Boberg and Lilja 2016). Thus, a study with multiple professionals estimating the log stack volume of the same log stack would be helpful to validate the measurement methods. Further investigations should focus on the estimation of air space in log stacks, as it is common to sell wood as roadside log stacks but the price is calculated on the basis of the solid wood content. Thus, so-called reduction factors or conversion coefficients are used to consider the volume of air space and bark in the log stacks. However, it is assumable that a subjective estimation of reduction factors contains a non-negligible error source. For example, according to the RVR the reduction factor for a 3-m-deep spruce (Picea abies (L.) H. Karst.) log stack should be chosen between 0.94 and 0.92 (DFWR and DHWR 2020). Reduction factors could be determined by photogrammetry through the detection of the butt surface of each individual log (Knyaz and Maksimov 2014; Herbon et al. 2015) or through linear regression models (Acuna and Sosa 2019). However, the accuracy of air space volume estimations by photogrammetry should be assessed in further studies. Moreover, as crookedness and taper have an significant effect on log stack gross volume (Miguel-Díez et al. 2021) reduction factors should be reviewed in relation to log quality.
Overall, when comparing the gross volumes between the different measurements, volumes estimated with App tended to be smaller than volumes estimated with the RVR methodology (both RVRleft and RVRright). One plausible explanation is that more reference points are used in App to define the contour, and thus, the theoretically drawn contour of the log stacks fits the real contour much more accurately. The post-processing of the contour for an accurate volume estimation by the app was done carefully. Conducting the post-processing with lower accuracy or even omitting it would inevitably lead to a loss of precision in the volume. The influence and the effects of fastidious post-processing of log stacks’ contours were not explored within this study. Further research on the topic is needed as we expect a non-negligible influence of post-processing quality on the log stack volume estimation accuracy. Thus, a next study could be a time consumption study between section-wise manual measurement and photo-optical measurement of log stacks, considering also the influence of time spent for post-processing on the accuracy.
The mean deviation between App and the manual estimations was –2.09% and –3.66% for RVRleft and RVRright, respectively (see Table 2). A study from 2017 showed that, when comparing the gross volume between the app and the conventional stacked timber measurement method, the average deviation was around 1.9% for pulpwood log stacks and under 0.9% for sawlog stacks (Cremer and Blasko 2017). Another study, which compared a mobile application that estimates the volume of a log stack, showed that the accuracy of the app at roadside landings was +4.5% compared to a hydrostatic weighting (Kärhä et al. 2019). However, the latter study did not compare the gross volume and therefore included reduction factors, which may act as an additional source of uncertainty. The low mean deviations are also in line with high explanatory rates of 99% and coefficients of determination of 0.99 when looking at the gross volume estimation by photo-optical methods (Boberg and Lilja 2016; Cremer et al. 2021). However, the very promising mean deviations and correlations did not reflect the high range of deviations. Especially when the gross log stacks’ volume was less than 20 m3, the deviations between the different measurement methods were above acceptable limits (Fig. 5). The range of the deviations between the volume estimation methods was smaller when considering larger log stacks with gross volumes over 60 m³, as with increasing log stack volume, the results of the different measurement methods become closer. However, the high number of small-sized log stacks shows the necessity of improving the methodologies to estimate more accurately the volume of hardwood piles as found under real-world conditions. According to the high range of deviation in smaller log stacks, the condition of a minimum log stack size of 20 m3 (DFWR and DHWR 2020) should be followed to ensure correct volumetric measurements for all measurement methods. In this study, the log stack requirements were not fulfilled by all of the analyzed log stacks as, for example, 37.6% of the analyzed log stacks had a gross volume under 20 m3. For smaller log stacks, shorter section length (LS) may help to obtain a more precise volume estimation. Moreover, while analyzing the log stacks, the log stack height seemed to be more heterogeneous in log stacks of lower volumes and an additional consideration could be to include the height of these log stacks for determining the section length. The idea is to increase the number of height measurements to enhance the precision of the volume estimation. However, this would mean an even higher time consumption for the manual measurement for small log stacks of lower quality. This additional time consumption might not be in relation to the benefits that could be obtained from selling the wood.
When comparing the two gross volume estimations according to the RVR (RVRleft and RVRright), the range of the deviations is of similar amplitude to the deviation between RVR and App, with higher deviations for smaller log stacks and lower deviations for more voluminous log stacks. The effect of low-quality log stacks with heterogeneous height combined with few height measurements led to high variance of volumes. A bilateral agreement on the starting side (right or left) of the measurement could help to avoid potential discrepancies between the different actors of the wood supply chain. Furthermore, it could be defined within the RVR in the future. An explanation for why RVRright showed higher gross volumes than RVRleft throughout all volume categories is hard to find. It may be that log stack heights were mostly unbalanced towards one side.
As assumed, the quality of log stacks has an influence on the deviation between different measurement methods. With decreasing log stack quality, an increase in the range of deviations was observed and validated statistically in two out of three response variables. The p-value of the effect of the quality on ‘RVRleft vs. App’ was 0.06 and we assume that the significance level will be reached with a higher sample size, especially with more log stacks of both best and good quality. In their analyses, Cremer and Blasko (2017) found that on pine log stacks the quality did influence the deviations but not significantly. This might be an effect of the more homogeneous qualities in the assortments of coniferous tree species. Within the analyzed log stacks, the tree species composition did not seem to affect the log stack quality, which is one of the explanations for why ‘tree species’ did not influence the deviation significantly. The log stack size, represented with the independent variable “stack length”, had a significant effect, which is probably mainly because (i) smaller log stacks were of lower quality, and (ii) large log stacks had a more homogeneous height over the log stack length.
Based on the results, it can be said that photo-optical measurement can offer a meaningful solution for log stack gross volume estimation. It can be seen as an attractive alternative compared to the manual measurement methodology, especially when marketing large log stacks of good quality. Nevertheless, further research is needed to reach not only high efficiency but also a high precision of photo-optical measurement systems for different wood qualities, log stack sizes and tree species in order to estimate the solid wood content of log stacks with highest accuracy.
Funding
This study was undertaken in the framework of the project “HoBeOpt”, which was financially supported via the Fachagentur Nachwachsende Rohstoffe (FNR), Germany, by the Federal Ministry of Food and Agriculture (BMEL) (Grant number: 22007918).
Author contributions
Conceptualization, F.W. and T.C.; methodology, F.B., T.C. and F.W.; formal analysis, F.B.; data curation, F.W.; writing-original draft preparation, F.B.; writing-review and editing, F.W. and T.C.; project administration, T.C. All authors have read and agreed to the published version of the manuscript.
Conflict of interest
The authors declare that they have no conflict of interest.
Availability of data and material
The datasets analyzed during this study are available from the corresponding author on reasonable request.
Code availability
Not applicable.
References
Acuna M, Sosa A (2019) Automated volumetric measurements of truckloads through multi-view photogrammetry and 3D reconstruction software. Croat J For Eng 40:151–162.
Berendt F, Fortin M, Jaeger D, Schweier J (2017) How climate change will affect forest composition and forest operations in Baden-Württemberg – a GIS-based case study approach. Forests 8, article id 298. https://doi.org/10.3390/f8080298.
Boberg A, Lilja J (2016) Precision vid travmätning av rundvirke med en fotoinventeringsteknik applicerat i smarta telefoner. [Precision of pile-measurement of roundwood with photographic technology applied in smartphones]. Kandidatarbeten i skosvetenskap 9, Swedish University of Agricultural Sciences, Umeå, Sweden.
Cremer T, Blasko L (2017) Analyse der fotooptischen Vermessung von Kiefernstamm- und industrieholz im Vergleich zum Sektionsraumaß. [Analysis of the fotooptical mensuration of pine stem wood and industrial wood in comparison to manual stack mensuration]. Allg Forst- u J-Ztg 188:127–139.
Cremer T, Berendt F, Miguel Diez F de, Wolfgramm F, Blasko L (2021) Accuracy of photo-optical measurement of wood piles. Environ Sci Proc 3, article id 90. https://doi.org/10.3390/IECF2020-08192.
DFWR, DHWR (2020) Rahmenvereinbarung für den Rohholzhandel in Deutschland (RVR). [German framework agreement for timber trade]. 3rd edn. Fachagentur für Nachwachsende Rohstoffe e.V. (FNR), Gülzow-Prüzen, Germany.
Heinzmann B, Barbu M-C (2017) Effect of mid-diameter and log-parameters on the conversion factor of cubic measure to solid measure concerning industrial timber. Pro Ligno 13: 39–44.
Herbon C (2015) Photogrammetric surveying of wood piles on handheld devices. Dissertation, Otto von Guericke Universität Magdeburg, Germany.
Herbon C, Otte B, Tönnies K-D, Stock B (2015) Mobile 3D wood pile surveying. 14th IAPR International Conference on Machine Vision Application, pp 422–425. https://doi.org/10.1109/MVA.2015.7153101.
Hohmann F, Ligocki A, Frerichs L (2017) Comparison of harvesting measuring system to the real trunk volume and their practical applicability for forest industry. Abstract and Proceedings of the 50th FORMEC Symposium, pp 140. https://www.formec.org/images/formec2017/Formec_2017_proceedings_book_web.pdf. Accessed 4 June 2021.
Jodłowski K, Moskalik T, Tomusiak R, Sarzyński W (2016) The use of photo-optical systems for measurement of stacked wood. Proceedings and Abstracts of the 49th FORMEC Symposium, pp 306. https://www.formec.org/images/formec2016/proceedings-formec-poland-2016.pdf. Accessed 6 January 2021.
Kärhä K, Nurmela S, Karvonen H, Kivinen V-P, Melkas T, Nieminen M (2019) Estimating the accuracy and time consumption of a mobile machine vision application in measuring timber stacks. Comput Electron Agric 158: 167–182. https://doi.org/10.1016/j.compag.2019.01.040.
Knyaz VA, Maksimov AA (2014) Photogrammetric technique for timber stack volume contol. Int Arch Photogramm Remote Sens Spatial Inf Sci XL-3: 157–162. https://doi.org/10.5194/isprsarchives-XL-3-157-2014.
Miguel-Díez F de, Tolosana-Esteban E, Purfürst T, Cremer T (2021) Analysis of the influence that parameters crookedness and taper have on stack volume by using a 3D-simulation model of wood stacks. Forests 12, article id 238. https://doi.org/10.3390/f12020238.
Ministry of Natural resources and Forestry (2017) Scaling manual 4th edn., Peterborough, Canada.
Opferkuch M, Attinger M, Jaeger D (2017) Accuracy, efficiency and usability of photo-optical pile measurement systems in the wood supply chain. Abstract and Proceedings of the 50th FORMEC Symposium, pp 212. https://www.formec.org/images/formec2017/Formec_2017_proceedings_book_web.pdf. Accessed 6 January 2021.
Pásztory Z, Heinzmann B, Barbu M-C (2019) Comparison of different stack measuring methods. SJFS 3: 5–13. https://doi.org/10.15372/SJFS20190301.
SDP Digitale Produkte GmbH (2020) iFOVEA Pro. https://fovea.eu/ifovea_pro_woodpile_measurement?language=en. Accessed 27 October 2020.
Smith VG (1979) Estimating the solid-wood content of stacked logs with minimum total cost. Can J For Res 9: 292–294. https://doi.org/10.1139/x79-049.
Total of 19 references.
