Nea Kuusinen  ,
Aarne Hovi,
Miina Rautiainen
,
Aarne Hovi,
Miina Rautiainen
Contribution of woody elements to tree level reflectance in boreal forests
Kuusinen N., Hovi A., Rautiainen M. (2021). Contribution of woody elements to tree level reflectance in boreal forests. Silva Fennica vol. 55 no. 5 article id 10600. https://doi.org/10.14214/sf.10600
Highlights
- Contribution of woody elements to reflectance of boreal tree species was estimated using spectral mixture analysis and airborne hyperspectral data
- Mean woody element contribution varied between 0.14–0.19 (Scots pine), 0.12–0.20 (birches) and 0.09–0.10 (Norway spruce).
Abstract
Spectral mixture analysis was used to estimate the contribution of woody elements to tree level reflectance from airborne hyperspectral data in boreal forest stands in Finland. Knowledge of the contribution of woody elements to tree or forest reflectance is important in the context of lea area index (LAI) estimation and, e.g., in the estimation of defoliation due to insect outbreaks, from remote sensing data. Field measurements from four Scots pine (Pinus sylvestris L.), five Norway spruce (Picea abies (L.) Karst.) and four birch (Betula pendula Roth and Betula pubescens Ehrh.) dominated plots, spectral measurements of needles, leaves, bark, and forest floor, airborne hyperspectral as well as airborne laser scanning data were used together with a physically-based forest reflectance model. We compared the results based on simple linear combinations of measured bark and needle/leaf spectra to those obtained by accounting for multiple scattering of radiation within the canopy using a physically-based forest reflectance model. The contribution of forest floor to reflectance was additionally considered. The resulted mean woody element contribution estimates varied from 0.140 to 0.186 for Scots pine, from 0.116 to 0.196 for birches and from 0.090 to 0.095 for Norway spruce, depending on the model used. The contribution of woody elements to tree reflectance had a weak connection to plot level forest variables.
Keywords
reflectance model;
bark;
hyperspectral;
spectral mixture analysis
-
Kuusinen,
Department of Built Environment, School of Engineering, Aalto University, P.O. Box 14100, FI-00076 Aalto, Finland
E-mail
nea.kuusinen@aalto.fi
- Hovi, Department of Built Environment, School of Engineering, Aalto University, P.O. Box 14100, FI-00076 Aalto, Finland E-mail aarne.hovi@aalto.fi
-
Rautiainen,
Department of Built Environment, School of Engineering, Aalto University, P.O. Box 14100, FI-00076 Aalto, Finland; Department of Electronics and Nanoengineering, School of Electrical Engineering, Aalto University, P.O. Box 15500, FI-00076 Aalto, Finland
 https://orcid.org/0000-0002-6568-3258
E-mail
miina.a.rautiainen@aalto.fi
https://orcid.org/0000-0002-6568-3258
E-mail
miina.a.rautiainen@aalto.fi
Received 22 June 2021 Accepted 27 September 2021 Published 30 September 2021
Views 38329
Available at https://doi.org/10.14214/sf.10600 | Download PDF

Supplementary Files
1 Introduction
In optical remote sensing of forests, the focus is often in retrieving information on properties of certain canopy components and their attributes, such as leaf area index (LAI), stem volume, health of foliage, etc. However, a forest is composed of a mixture of tree leaves or needles, tree stems and branches, forest floor, and some minor tree constituents, such as cones, all of which contribute to the shortwave radiation scattered from a forest towards a remote sensing sensor.
Woody material, as one of the forest components that is seldom of interest by itself, has been observed to have an important influence on the retrieval of canopy attributes, e.g., forest LAI (Myneni et al. 1997) and chlorophyll content (Verrelst et al. 2010) from optical remote sensing data. Malenovský et al. (2008) observed that inclusion of trunks and first order branches (as compared to using foliage only) into a canopy radiative transfer model did not markedly change the reflectance of a Norway spruce canopy. However, including additionally small twigs, nadir reflectance of the sunlit canopy parts decreased from 29–35% to 20–30% in near-infrared and increased from 2% to 3–5% in red wavelengths, which improved the agreement of the simulated reflectance values with those measured by an airborne hyperspectral sensor. Moreover, the woody-to-total area ratio varies between tree species and changes during stand development (Chen 1996; Zhu et al. 2018), and the effects of these changes on forest reflectance have been largely unexplored.
In this case study, we demonstrate a method for estimating the contribution of woody tree elements (stems and branches) to tree level reflectance in airborne hyperspectral data using spectral mixture analysis. We compared the results based on simple linear combinations of measured bark and needle/leaf spectra to those obtained by accounting for multiple scattering of radiation within the canopy using a physically-based forest reflectance model. The contribution of forest floor to reflectance was additionally considered.
2 Material and methods
2.1 Material
Measurements from 13 forest plots (25 × 25 m) located in southern boreal forests of Finland (61°51´N, 24°17´E) were used (Table 1 and Supplementary file S1 Table A1). Four of the plots were dominated by Scots pine (Pinus sylvestris L.), five by Norway spruce (Picea abies (L.) Karst.) and four by birches (Betula pendula Roth and Betula pubescens Ehrh.). All plots had a near-nadir view angle in the airborne hyperspectral data (i.e., the sensor view angle < 10 degrees) and were clearly dominated by one tree species. Location, diameter at breast height (1.3 m) (DBH), species and status (living, dead, damaged etc.) for every tree larger than 8 cm (DBH) were measured. Height was measured from two dominant trees per plot. Twenty-one hemispherical photographs per plot were taken for estimation of gap fraction and effective plant area index (PAIeff) (details described in Suppl. file S1). We denote PAIeff calculated using total gap fraction as ‘PAIeff’ and that calculated using within-crown gap fraction as ‘crown PAIeff’.
| Table 1. Forest variables and the number of pixels per plot used in the analyses. Basal area weighted DBH (DBHB), mean height of dominant trees (H), stem number (N trees), basal area (BA), effective plant area index (PAIeff) and number of pixels of the airborne hyperspectral data used per plot (N pixels). The plots were located within approximately 3 km from each other. | |||||||
| Plot | Species | DBHB, cm | H, m | N trees, ha–1 | BA, m2 ha–1 | PAIeff, m2 m–2 | N pixels |
| Pine 1 | Pinus sylvestris | 20.4 | 18.7 | 688 | 19.9 | 1.68 | 905 |
| Pine 2 | Pinus sylvestris | 16.6 | 16.4 | 1760 | 28.0 | 2.14 | 1137 |
| Pine 3 | Pinus sylvestris | 21.6 | 22.9 | 992 | 33.0 | 2.20 | 1139 |
| Pine 4 | Pinus sylvestris | 30.3 | 25.1 | 272 | 17.6 | 1.30 | 689 |
| Birch 1 | Betula pendula, B. pubescens | 14.0 | 18.6 | 1520 | 19.5 | 2.37 | 916 |
| Birch 2 | Betula pendula, B. pubescens | 20.0 | 23.2 | 416 | 11.5 | 1.48 | 641 |
| Birch 3 | Betula pendula, B. pubescens | 17.4 | 21.3 | 1184 | 22.9 | 2.56 | 1264 |
| Birch 4 | Betula pendula, B. pubescens | 12.0 | 17.2 | 1904 | 16.8 | 2.44 | 759 |
| Spruce 1 | Picea abies | 28.5 | 26.2 | 512 | 29.8 | 2.49 | 879 |
| Spruce 2 | Picea abies | 44.8 | 34.3 | 368 | 46.0 | 3.25 | 744 |
| Spruce 3 | Picea abies | 21.8 | 21.9 | 672 | 22.0 | 2.22 | 636 |
| Spruce 4 | Picea abies | 29.7 | 26.0 | 400 | 22.9 | 2.84 | 688 |
| Spruce 5 | Picea abies | 30.1 | 26.5 | 624 | 38.6 | 3.41 | 874 |
Hyperspectral data were collected in July 2019, using an aircraft mounted CASI-1500 hyperspectral pushbroom sensor (Itres Ltd., Canada) flying at 1 km altitude. The spectral resolution was 15 nm in the spectral range 382–1052 nm, and pixel size on the ground 0.5 m. The data were orthorectified, and radiometrically and atmospherically corrected to result in bottom-of-atmosphere hemispherical-directional reflectance factors. The atmospheric correction included also vicarious calibration using a ground reference target. Airborne laser scanning data were collected simultaneously using a Riegl LMS Q780 sensor.
Measurements of reflectance and transmittance spectra of tree needles and leaves were conducted for samples taken from a total of nine individual trees (three per species) in the study area. Measurements were conducted with an integrating sphere attached to an ASD FieldSpec4 spectrometer (see Suppl. file S1 for details). Leaf and needle albedo spectra were calculated as sums of reflectance and transmittance. Forest floor reflectance spectra were measured with the same spectrometer for each plot, from 15 points along a 11 m transect located in the center of the plot (details described in Forsström et al. 2021). Bark reflectance spectra were measured from stem samples in a laboratory, using a Specim IQ hyperspectral camera (details described in Juola et al. 2020). Mean spectra of samples collected from different heights along the tree stems were used.
Forest inventory measurements as well as spectral measurements of needles, leaves and forest floor were conducted concurrently with the flight campaign in summer 2019.
2.2 Pixel selection
Only pixels in the airborne hyperspectral data belonging to tree crowns selected based on the following criteria were used (see Fig. A1 in Suppl. file S1 for an example). Field inventory data were first used to select only living and undamaged trees of the main tree species of the plot. Pixels closer than four meters to the stem of any other tree species than the plot main species, were excluded. Linear regression models were used to delineate crowns of the selected trees. The crown width models (Table A1 in Suppl. file S1) were based on our earlier, not reported, measurements in the same area. Further, only pixels for which canopy height model (based on laser scanning data) indicated a height of at least 60% of mean height of the dominant trees on a plot, were chosen. Altogether 3270 (pine), 3821 (spruce) and 3580 (birch) pixels were left for analyses.
2.3 Spectral mixture analysis
In spectral mixture analysis (SMA), the pixel spectrum is modeled as a linear combination of the spectra (endmembers) of the ground components present in the pixel (e.g., Shimabukuro and Smith 1991):
![]()
where the reflectance of a pixel in spectral band i (Ri) is estimated as the sum of the N endmembers in band i (rk,i) weighted by their cover fractions (abundances) (fk), ei being the residual variation for ith spectral band. The component abundances fk are usually constrained to be positive and sum to one.
Endmembers used in SMA are usually derived from field or laboratory measurements or “pure pixels” of the images. If interaction of photons between different ground components is accounted for, nonlinear mixture modeling is used; otherwise, the model is referred to as linear mixture model. In the case of structurally complex vegetation canopies, the occurrence of multiple scattering between different components is certain, particularly in the near-infrared region where foliage reflectance and transmittance are high (Borel and Gerstl 1994; Chen and Vierling 2006). In this study, we implemented both approaches: linear mixture modeling in Models 1–2, and nonlinear mixture modeling in Models 3–4 (section 2.4).
2.4 Estimation of woody element contribution
The reasoning for the selection of the used models was the following: 1) In SMA, endmembers must not be correlated (Van der Meer and Jia 2012), which is why the use of more than one green endmembers (e.g., a foliage endmember and forest floor, which is covered by green vegetation in our study sites), is not possible. This means that if forest floor is to be included in a model, it needs to be part of the foliage endmember or extracted from the pixel reflectance before estimation. 2) Multiple scattering between the canopy elements occurs in a forest, and the difference between accounting for multiple scattering within and between foliage and woody tree elements, and simply using their measured spectra as endmembers, needs to be investigated.
Four two-endmember models were constructed: In Model 1, the abundances of the woody and green (foliage) canopy components were estimated using the endmembers ‘bark spectral reflectance’ and ‘needle/leaf spectral albedo’, with Eq. 1. Model 2 was similar to Model 1, except that the (plot-specific) direct forest floor contribution (RFL,i) (reflectance from ground that reaches the sensor through canopy gaps) was first extracted from the pixel reflectance. RFL,i was estimated as rFL,it0at0s, rFL,i being field measured forest floor reflectance in band i, t0a gap fraction in the solar direction and t0s within-crown gap fraction in the sensor direction. The latter two were estimated from hemispherical photographs (Suppl. file S1). Normalized spectra (reflectance at each spectral band divided by the sum of band-specific reflectance values in each spectrum) of airborne hyperspectral data and endmembers were used in Models 1–2. Note that the forest floor contribution in Model 2 was extracted from the pixel reflectance before normalization. Models 1–2 were solved using constrained least squares regression, and resulted in an estimate of the contribution of woody elements to tree level reflectance.
Models 3 and 4 accounted for multiple scattering between the woody and green canopy components:

where fW is the fraction of woody area of the effective plant area in a pixel, rW,i bark reflectance in ith spectral band, 1–fW the fraction of leaves or shoots (for coniferous species) of the effective plant area in a pixel, rS,i leaf or shoot albedo in ith spectral band, pC photon recollision probability (Smolander and Stenberg 2005) at higher than shoot level, and k an unknown scaling factor constituting the effect of reflectance directionality, irradiance of incoming solar radiation at the pixel, and fraction of incoming solar radiation intercepted by the vegetation in the pixel. rS,i for coniferous shoots was estimated as rS,i = (1–pS)rL,i/(1–pSrL,i), where rL,i is needle albedo in ith spectral band and pS is within-shoot photon recollision probability, estimated as pS = 1–4STAR. STAR (shoot silhouette to total needle area ratio) values of 0.147 for pine (Smolander et al. 1994) and 0.161 for spruce (Stenberg et al. 1995) were used. pC was estimated as 1–iD/PAIeff, where iD is diffuse interceptance, estimated from hemispherical photographs. k was moved to the other side of the equation by dividing the bark and needle/leaf spectra by it. Model 3 was estimated using Eq. 2 and Model 4, by first removing the direct forest floor contribution (RFL,i) from pixel reflectance. Models 3 and 4 resulted in estimates of ‘fraction of woody area of the effective plant area’ (but can also be referred to as the contribution of woody elements to tree level reflectance).
Spectral bands were selected for the analyses as suggested by Miao et al. (2006). First, the bands with smallest residuals of the unconstrained least squares regression models were chosen. Next, correlation analyses were performed to select a band combination that had as low correlation between needle/leaf and bark spectra as possible for all species. This resulted in 16 spectral bands in the range 467–681 nm. The correlation between bark and needle/leaf spectra in absolute terms in these spectral bands was 0.29 for pine, 0.11 for birch and 0.11 for spruce.
3 Results
Depending on the model that was used, average woody element contribution varied between 0.140–0.186 (pine), 0.116–0.196 (birch) and 0.090–0.095 (spruce) (Fig. 1). Models accounting for multiple scattering within and between the canopy components (3 and 4) produced somewhat lower woody element contribution estimates than the simple models (1 and 2). Extraction of the direct forest floor contribution slightly decreased woody element contribution estimates.
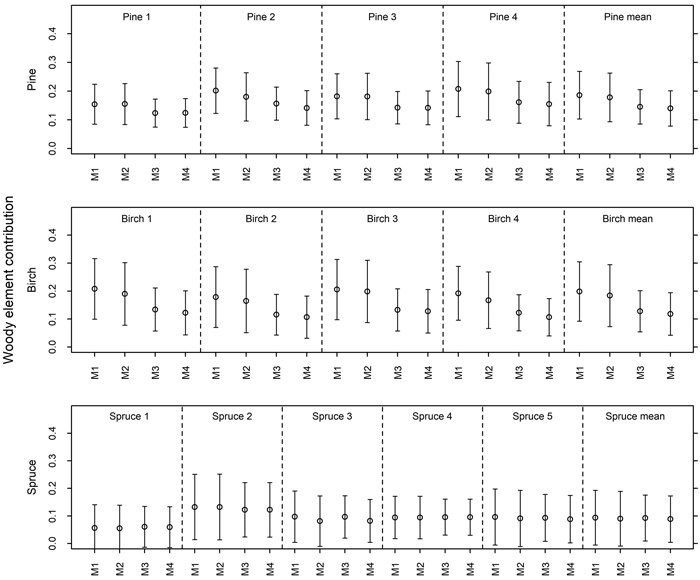
Fig. 1. Contribution of woody elements to tree level reflectance based on four different models (M1 = Model 1, M2 = Model 2, M3 = Model 3, M4 = Model 4). Models 1–2 were estimated using Eq. 1 and Models 3–4 using Eq. 2. In Models 2 and 4, direct forest floor contribution was extracted from pixel reflectance before fitting the model. View larger in new window/tab.
Only weakly increasing trends were seen for woody element contribution with increasing effective plant area per vertical crown projection area (crown PAIeff) and tree height (Model 4) (Fig. 2).
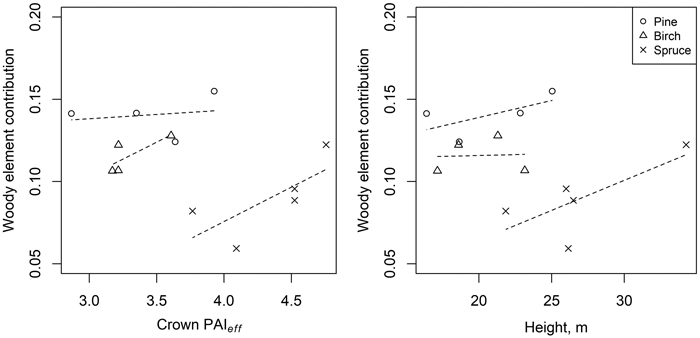
Fig. 2. Relationships between woody element contribution and effective plant area per vertical crown projection area (crown PAIeff) (left) and tree height (right), based on Model 4 (woody element contribution estimated using Eq. 2, with direct forest floor contribution first extracted from pixel reflectance).
4 Discussion
The estimates of the contribution of woody elements to tree reflectance are useful in LAI estimation from remote sensing data using e.g., vegetation indices or physically-based forest reflectance models. Another concrete example is the identification of defoliated stands due to, e.g., insect outbreaks. The contribution of woody elements to tree level reflectance varied strongly between pixels and was slightly dependent on crown PAIeff and tree height, which implies that often a method producing pixelwise woody element contribution estimates could be useful; especially since conventionally a single value, if any, for a forest plot or region has been used to describe the woody area ratio in LAI estimations (Woodgate et al. 2016).
There are at least two likely reasons for the rather high within plot (between pixel) variation in woody element contribution observed in this study: firstly, the area of woody surfaces has natural variation between pixels, as already one or two thick branches may cover a considerable portion of a 0.25 m2 pixel, and secondly, the illumination level seemed to influence the woody element contribution estimates so that the largest values were seen in the completely sunlit or shaded pixels (not shown). We also acknowledge that there is uncertainty related to the endmembers used in the analysis, i.e., spectra averaged from foliage and bark measurements from different tree heights and illumination conditions may not fully correspond to those present in each pixel. The wavelength region used in the analyses also affects the results, but it must be noted that the requirement of uncorrelated endmembers strongly restricts the selection. Also note that if cone spectra (for pine and spruce) are closer to bark than foliage spectra, our woody element contribution estimates likely include cones.
We compared our remotely-sensed estimates to the few, previous studies which have measured the ratio of woody-to-total (plant) area in forest stands. Malenovský et al. (2008) mentioned that according to destructive measurements of 16 Norway spruce trees, the brown woody biomass would represent about 13% of canopy surface area. Zhu et al. (2018), using terrestrial laser scanning data, observed woody-to-total area ratios of on average ca. 0.1 for Norway spruce and ca. 0.2 for European beech plots. They also observed the woody-to-total area ratio to increase with increasing tree height and canopy cover. Chen (1996), using destructive sampling and modeling, obtained woody-to-total area values of 0.17 for an old black spruce stand and 0.28 and 0.32 for two old jack pine stands. Chen argued that there were considerably more dead branches in the old jack pine stands compared to the old black spruce stand. The results reviewed by Gower et al. (1999) also indicated that the woody-to-total plant area ratio is higher in old than young jack pine stands. In two Scots pine stands studied by Stenberg et al. (2003), the (initial) woody area comprised 13% and 26% of total plant area. The woody element contribution estimates yielded in this study for Norway spruce are quite close to the woody-to-total area ratios mentioned by Malenovský et al. (2008) and obtained by Zhu et al. (2018), and for Scots pine, fall in the range observed by Stenberg et al. (2003).
We compared the woody element contributions obtained when multiple scattering within and between foliage and woody tree components was considered, to those derived by simply using their measured spectra as endmembers. The latter approach produced larger estimates than the former one, the differences being largest for birch (0.064–0.070) and smallest for spruce (0.001–0.002). Rather small differences between the models were expected, as reflectance and transmittance of foliage elements are quite low in the spectral range used in the modeling (467–681 nm). Accounting for the direct forest floor contribution decreased the woody contribution for all but one plot, but this effect was also small (0.004–0.016 in absolute units), probably because the analysis was constrained to tree crown pixels.
Despite the simplicity of Models 1–2, the results were quite close to those obtained using a physically-based model and those reviewed from literature. Therefore, we conclude that estimating woody element contribution by modeling canopy spectra as a simple linear combination of normalized bark and foliage spectra may be adequate in many cases.
Openness of research materials
Understory reflectance spectra are reported in Forsström et al. (2021) and are openly available in Mendeley Data (https://doi.org/10.17632/2g9nkcdj53.1). Bark spectra are reported in Juola et al. (2020) and are openly available through the SPECCHIO Spectral Information System (https://specchio.ch/). Other data are available upon request from authors.
Authors’ contributions
NK designed the concept for this study and performed the analyses. AH and MR planned and coordinated all field and airborne data collections. AH preprocessed the data and supported NK in conceptualization. All authors contributed to interpreting results and writing the article.
Acknowledgements
We would like to thank Jan Hanuš, Tomáš Fabiánek, Lukáš Fajmon, Karel Holouš, Petri Forsström, Jussi Juola, Ville Ranta, Daniel Schraik and staff of the Hyytiälä forestry field station for collaboration during the field and airborne measurement campaigns.
Funding
This study was supported by the Academy of Finland (DIMEBO, grant number: 323004). This study has also received funding from the European Research Council (ERC) under the European Union’s Horizon 2020 research and innovation programme (grant agreement No 771049). The text reflects only the authors’ view and the Agency is not responsible for any use that may be made of the information it contains.
References
Borel CC, Gerstl SAW (1994) Nonlinear spectral mixing models for vegetative and soil surfaces. Remote Sens Environ 47: 403–416. https://doi.org/10.1016/0034-4257(94)90107-4.
Chen JM (1996) Optically-based methods for measuring seasonal variation of leaf area index in boreal conifer stands. Agr Forest Meteorol 80: 135–163. https://doi.org/10.1016/0168-1923(95)02291-0.
Chen X, Vierling L (2006) Spectral mixture analyses of hyperspectral data acquired using a tethered balloon. Remote Sens Environ 103: 338–350. https://doi.org/10.1016/j.rse.2005.05.023.
Forsström P, Juola J, Rautiainen M (2021). Relationships between understory spectra and fractional cover in northern European boreal forests. Agr Forest Meteorol 308–309, article id 108604. https://doi.org/10.1016/j.agrformet.2021.108604.
Gower ST, Kucharik CJ, Norman JM (1999) Direct and indirect estimation of leaf area index, fapar, and net primary production of terrestrial ecosystems. Remote Sens Environ 70: 29–51. https://doi.org/10.1016/S0034-4257(99)00056-5.
Hovi A, Forsström P, Ghielmetti G, Schaepman ME, Rautiainen M (2020a) Empirical validation of photon recollision probability in single crowns of tree seedlings, ISPRS J Photogramm169: 57–72. https://doi.org/10.1016/j.isprsjprs.2020.08.027.
Hovi A, Mõttus M, Juola J, Manoocheri F, Ikonen E, Rautiainen M (2020b) Evaluating the performance of a double integrating sphere in measurement of reflectance, transmittance, and albedo of coniferous needles. Silva Fenn 54, article id 10270. https://doi.org/10.14214/sf.10270.
Juola J, Hovi A, Rautiainen M (2020) Multiangular spectra of tree bark for common boreal tree species in Europe. Silva Fenn 54, article id 10331. https://doi.org/10.14214/sf.10331.
Malenovský Z, Martin E, Homolová L, Gastellu-Etchegorry J-P, Zurita-Milla R, Schaepman ME, Pokorný R, Clevers JGPW, Cudlín P (2008) Influence of woody elements of a Norway spruce canopy on nadir reflectance simulated by the DART model at very high spatial resolution. Remote Sens Environ 112: 1–18. https://doi.org/10.1016/j.rse.2006.02.028.
Miao X, Gong P, Swope S, Pu R, Carruthers R, Anderson GL, Heaton JS, Tracy CR (2006) Estimation of yellow starthistle abundance through CASI-2 hyperspectral imagery using linear spectral mixture models. Remote Sens Environ 101: 329–341. https://doi.org/10.1016/j.rse.2006.01.006.
Myneni RB, Nemani RR, Running SW (1997) Estimation of global leaf area index and absorbed PAR using radiative transfer models. IEEE T Geosci Remote 35: 1380–1393. https://doi.org/10.1109/36.649788.
Shimabukuro YE, Smith JA (1991) The least-squares mixing models to generate fraction images derived from remote sensing multispectral data. IEEE T Geosci Remote 29: 16–20. https://doi.org/10.1109/36.103288.
Smolander H, Stenberg P, Linder S (1994) Dependence of light interception efficiency of Scots pine shoots on structural parameters. Tree Physiol 14: 971–980. https://doi.org/10.1093/treephys/14.7-8-9.971.
Smolander S, Stenberg P (2005) Simple parameterizations of the radiation budget of uniform broadleaved and coniferous canopies. Remote Sens Environ 94: 355–363. https://doi.org/10.1016/j.rse.2004.10.010.
Stenberg P, Linder S, Smolander H (1995) Variation in the ratio of shoot silhouette area to needle area in fertilized and unfertilized Norway spruce trees. Tree Physiol 15: 705–712. https://doi.org/10.1093/treephys/15.11.705.
Stenberg P, Nilson T, Smolander H, Voipio P (2003) Gap fraction based estimation of LAI in Scots pine stands subjected to experimental removal of branches and stems. Can J For Res 29: 363–370. https://doi.org/10.5589/m03-007.
Verrelst J, Schaepman ME, Malenovský Z, Clevers JGPW (2010) Effects of woody elements on simulated canopy reflectance: implications for forest chlorophyll content retrieval. Remote Sens Environ 114: 647–656. https://doi.org/10.1016/j.rse.2009.11.004.
Van der Meer FD, Jia X (2012) Collinearity and orthogonality of endmembers in linear spectral unmixing. Int J of Appl Earth Obs 18: 491–503. https://doi.org/10.1016/j.jag.2011.10.004.
Woodgate W, Armston JD, Disney M, Jones SD, Suarez L, Hill MJ, Wilkes P, Soto-Berelov M (2016) Quantifying the impact of woody material on leaf area index estimation from hemispherical photography using 3D canopy simulations. Agr Forest Meteorol 226–227: 1–12. https://doi.org/10.1016/j.agrformet.2016.05.009.
Zhu X, Skidmore AK, Wang T, Liu J, Darvishzadeh R, Shi Y, Premier J, Heurich M (2018) Improving leaf area index (LAI) estimation by correcting for clumping and woody effects using terrestrial laser scanning. Agr Forest Meteorol 263: 276–286. https://doi.org/10.1016/j.agrformet.2018.08.026.
Total of 20 references.
