Kari T. Korhonen  ,
Arto Ahola,
Juha Heikkinen,
Helena M. Henttonen,
Juha-Pekka Hotanen,
Antti Ihalainen,
Markus Melin,
Juho Pitkänen,
Minna Räty,
Maria Sirviö,
Mikael Strandström
,
Arto Ahola,
Juha Heikkinen,
Helena M. Henttonen,
Juha-Pekka Hotanen,
Antti Ihalainen,
Markus Melin,
Juho Pitkänen,
Minna Räty,
Maria Sirviö,
Mikael Strandström
Forests of Finland 2014–2018 and their development 1921–2018
Korhonen K. T., Ahola A., Heikkinen J., Henttonen H. M., Hotanen J.-P., Ihalainen A., Melin M., Pitkänen J., Räty M., Sirviö M., Strandström M. (2021). Forests of Finland 2014–2018 and their development 1921–2018. Silva Fennica vol. 55 no. 5 article id 10662. https://doi.org/10.14214/sf.10662
Highlights
- Current volume of growing stock, 2500 M m3, is 1.7 times the volume in the 1920s
- Annual volume increment is 107.8 M m3, which is double the increment estimated in the 1930s
- Serious damage is observed on 2% of the forests available for wood supply
- The amount of dead wood is on average 5.8 m3 per ha on productive forest.
Abstract
We describe the methodology applied in the 12th national forest inventory of Finland (NFI12) and describe the state of Finland’s forests as well as the development of some key parameters since 1920s. According to the NFI12, the area of forestry land (consisting of productive and poorly productive forest, unproductive land, and other forestry land) is 26.2 M ha. The area of forestry land has decreased from 1920s to 1960s due to expansion of agriculture and built-up land. 20% of the forestry land is not available for wood supply and 13% is only partly available for wood supply. The area of peatlands is 8.8 M ha, which is one third of the forestry land. 53% of the current area of peatlands is drained. The volume of growing stock, 2500 M m3, is 1.7 times the volume estimated in NFI1 in the 1920s for the current territory of Finland. The estimated annual volume increment is 107.8 M m3. The increment estimate has doubled since the estimate of NFI2 implemented in late 1930s. The annual mortality is estimated to 7 M m3, which is 0.5 M m3 more than according to the previous inventory. Serious or complete damage was observed on 2% of the productive forest available for wood supply. The amount of dead wood is on average 5.8 m3 ha–1 in productive forests. Since the NFI9 (1996–2003) the amount of dead wood has increased in South Finland and decreased in North Finland both in protected forests and forests available for wood supply (FAWS). The area of natural or almost natural forests on productive forest is 380 000 ha, out of this, 42 000 ha are in FAWS and 340 000 ha in protected forests.
Keywords
biodiversity;
National Forest Inventory;
growing stock;
forest resources;
forest damage
-
Korhonen,
Natural Resources Institute Finland (Luke), P.O. Box 68, FI-80100 Joensuu, Finland
E-mail
kari.t.korhonen@luke.fi
- Ahola, Natural Resources Institute Finland (Luke), P.O. Box 2, FI-00790, Helsinki, Finland E-mail arto.ahola@luke.fi
- Heikkinen, Natural Resources Institute Finland (Luke), P.O. Box 2, FI-00790, Helsinki, Finland E-mail juha.heikkinen@luke.fi
- Henttonen, Natural Resources Institute Finland (Luke), P.O. Box 2, FI-00790, Helsinki, Finland E-mail helena.henttonen@luke.fi
- Hotanen, Natural Resources Institute Finland (Luke), P.O. Box 68, FI-80100 Joensuu, Finland E-mail juha-pekka.hotanen@luke.fi
- Ihalainen, Natural Resources Institute Finland (Luke), P.O. Box 2, FI-00790, Helsinki, Finland E-mail anttivj.ihalainen@elisanet.fi
- Melin, Natural Resources Institute Finland (Luke), P.O. Box 68, FI-80100 Joensuu, Finland E-mail markus.melin@luke.fi
- Pitkänen, Natural Resources Institute Finland (Luke), P.O. Box 68, FI-80100 Joensuu, Finland E-mail juho.pitkanen@luke.fi
- Räty, Natural Resources Institute Finland (Luke), P.O. Box 2, FI-00790, Helsinki, Finland E-mail minna.raty@luke.fi
- Sirviö, Natural Resources Institute Finland (Luke), P.O. Box 2, FI-00790, Helsinki, Finland E-mail maria.sirvio@uudenmaanliitto.fi
- Strandström, Natural Resources Institute Finland (Luke), P.O. Box 2, FI-00790, Helsinki, Finland E-mail mikael.strandstrom@luke.fi
Received 22 November 2021 Accepted 29 November 2021 Published 9 December 2021
Views 112168
Available at https://doi.org/10.14214/sf.10662 | Download PDF

Supplementary Files
1 Introduction
The forests of Finland have been monitored by national forest inventories (NFI) since the 1920s. The first NFI was carried out as a line assessment in the early 1920s. Since then, inventories have been carried out initially by about every 10 years and in the 21st century by every five years. The years of implementation of the field work (and main result references) for the previous inventories were: NFI1 1921–1924 (Ilvessalo 1924, 1927), NFI2 1936–1938 (Ilvessalo 1940, 1942, 1948), NFI3 1951–1953 (Ilvessalo 1956), NFI4 1960–1963 (Tiihonen 1968), NFI5 1964–1970 (Kuusela 1973), NFI6 1971–1976 (Kuusela 1978), NFI7 1977–1984 (Kuusela and Salminen 1991), NFI8 1986–1994 (Tomppo et al. 2001), NFI9 1996–2003 (Tomppo et al. 2011), NFI10 2004–2008 (Korhonen et al. 2013), and NFI11 2009–2013 (Korhonen et al. 2017).
The survey method has developed over the decades. The first three inventories were performed as line surveys and calibrated by plot measurements. These inventories were conducted in three to four years. The NFI4–NFI9 were carried out as a clustered plot sampling, and the length of the inventory cycle increased considerably after the NFI4. Since the NFI4 the inventories have been done by regions until the NFI10 when the design was changed from a region-by-region inventory to a continuous inventory, and the length of the inventory cycle was set to five years (Korhonen et al. 2013).
The current mission of the NFI is to provide information on land use and its changes, the amount and increment of growing stock, cutting possibilities, the health status and ownership structure of forests, the quality of forest management and forest biodiversity indicators. The main user of the data is the Ministry of Agriculture and Forestry of Finland using the NFI for example for planning and monitoring of forest policy and other national forest related programs. NFI also provides data for the green house gas reporting on the LULUCF sector and for several other international processes and reporting obligations, like the Global Forest Resource Assessment of FAO (United Nations (UN) Food and Agriculture Organization), the UN Climate Agreement and the Kyoto Protocol, and the Forest Europe process. The Finnish Forest Center uses NFI data for regional forest programs and their monitoring. Ministry of Environment uses NFI for monitoring of habitats and for planning forest protection programmes. The forestry and energy sector enterprises use NFI or NFI based products for estimation of raw material potential. Metsähallitus and other large forest owners use NFI for assessment of the condition of their own forests. Several research institutes and groups of reseachers utilize NFI data in scientific research.
The main objective of this publication is to present the Finland’s forests in the light of the most important variables measured and estimated in the NFI. Most of the results we present for the whole country, and separately for South Finland and North Finland. South Finland consists of sampling regions Åland, Southern Finland, and Central Finland (Fig. 1). Another goal is to describe and document the implementation of NFI12. The report presents the sampling design, the variables estimated and measured at different levels, and the methods used to calculate the results.
2 Material and methods
2.1 Sampling design
The sampling design in the NFI12 was a systematic cluster sampling as in the previous inventories (Tomppo et al. 2011), except that balanced sampling was applied in the Åland region. Finland was divided in the same six sampling regions as in the previous inventories: Åland, Southern Finland, Central Finland, Northern Ostrobothnia and Kainuu, Lapland and Kuusamo, and Upper Lapland (Fig. 1). No new sample plots were measured in the Upper Lapland, instead the NFI11 data from the year 2013 were used. In the Åland region, NFI12 measurements were made during one fieldwork season in 2018. Elsewhere in Finland one-fifth of the clusters were measured annually during the 5-year period (2014–2018).
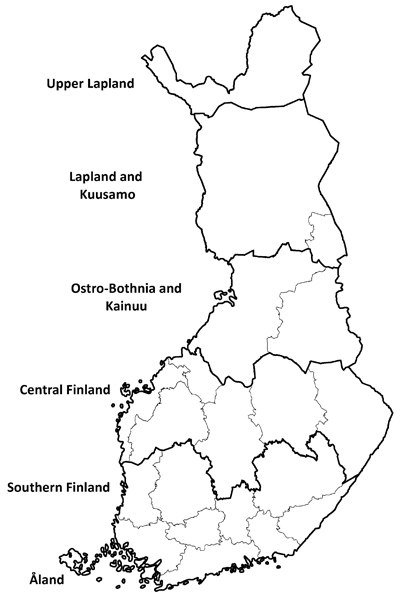
Fig. 1. The sampling regions (thick lines) applied in the 12th National Forest Inventory (NFI12) and regions (thin lines) of Finland.
In the NFI9 (1996–2003) 25% of the sample plot clusters were established as permanent and these plots have been remeasured in all subsequent inventories ever since. Additional permanent clusters, called new permanent clusters, were established in NFI12. Consequently, the proportion of permanent clusters of all the clusters rose to 60% in the NFI12. The locations of the new permanent clusters and temporary clusters in the NFI12 were selected so that they do not overlap with the clusters measured in the previous inventories. The cluster design has been slightly changed: the number of plots in a cluster varied from 8 to 10 for temporary and new permanent clusters and from 10 to 14 for the old permanent clusters (Table 2). The cluster design of the clusters in the different sampling regions is presented in diagrams in the field work instructions (Valtakunnan metsien… 2018). However, in the Åland region, where a balanced sampling method was applied for locating the temporary clusters (Räty et al. 2019), the temporary clusters were not in a regular grid.
The number of plots on land in the entire NFI12 dataset was 64 579 (Table 1). Number of sample plots in one cluster is shown in Table 2 for each sampling region.
| Table 1. Number of plot centers in the 12th National Forest Inventory (NFI12) of Finland for the old permanent, new permanent and temporary clusters by land use class. | ||||
| Land use class | Temporary clusters | Old permanent clustgers | New permanent clusters | Total |
| Productive forest | 17 454 | 11 232 | 16 912 | 45 598 |
| Poorly productive forest | 1553 | 982 | 1153 | 3688 |
| Unproductive land | 1664 | 894 | 1210 | 3768 |
| Other forestry land | 185 | 129 | 174 | 488 |
| Forestry land total | 20 856 | 13 237 | 19 449 | 53 542 |
| Agriculture land | 2659 | 1824 | 2469 | 6952 |
| Built-up land | 1147 | 721 | 1047 | 2915 |
| Roads | 330 | 224 | 322 | 876 |
| Power lines | 117 | 70 | 107 | 294 |
| Total | 25 109 | 16 076 | 23 394 | 64 579 |
| Table 2. Number of sample plots per cluster by sampling region in NFI12 of Finland. | ||
| Sampling region | Temporary clusters and new permanent clusters | Old permanent clusters |
| Southern Finland | 8 | 10 |
| Central Finland | 9 | 14 |
| Ostrobothnia and Kainuu | 8 | 11 |
| Lapland and Kuusamo | 10 | 11 |
2.2 Field measurements
The field measurements are described in detail in the field manual (Valtakunnan… 2018). Measurements and assessments were done at three different levels: tree, sample plot and forest stand. The land use class polygon or forest stand on which the center of the sample plot is located is referred as the center point stand. The forest stand is a polygon that is homogeneous in respect to the growing stock, site class, accomplished management measures and restrictions on wood production.
Tree measurements were made on a concentric circular sample plot layout where the plot radius (r) depend on the tree’s diameter at breast height (dbh):
r = 9 m, if dbh ≥ 95 mm
r = 5.64 m, if dbh = 45 – 94 mm,
if dbh < 45 mm and height > 1.3 m, trees were selected with the Bitterlich relascope with the relascope factor of 1.5.
On productive and poorly productive forest 989 520 living trees were measured in the NFI12, while the corresponding number in the NFI11 was 472 932. The new plot design explains the increase. Particularly, the number of small trees in the sample increased significantly. In the previous inventories a restricted Bitterlich relascope plot was used.
The stand (or land use class polygon) level variables were always recorded for the center point stand, regardless of whether trees were measured on the stand or not. The number of assessed variables depends on the land use class. On forestry land, the nearest quarter of a hectare was the reference area for the stand level variables, with the exception of some soil variables which were measured inside the 9 m plot circle.
The stand level variables are grouped in six categories: general, administrative, site description, growing stock, forest damage, and management data. The general data includes, among other things, the cluster and plot identifier, location, inventory team and date of measurement. Administrative data describe the ownership group and restrictions on wood production. The site description includes the land use/land cover classification according to the national and FAO classification, changes in the land use/land cover classes, site classs and soil type.
The growing stock and damage data were recorded for each tree stratum of the stand. Tree story and tree species were used for defining the tree strata (in seedling stands, also the origin). The tree story position, tree species, origin (natural, cultivated), mean diameter, mean height, age, basal area, number of stems (for seedling stands and undergrowth stories) and damage were recorded for each tree stratum.
The tree species, breast height diameter, tree class describing the quality of the stem, and the canopy layer were recorded as the tree level variables for each measured tree (tally tree). Living trees and dead trees that are usable at least as firewood are included as tally trees. On the permanent plots, the location of the trees, the tree status (describing the change of the tree type after the previous measurement) were recorded in addition to the previous variables. For trees felled after the previous measurement, the method of felling and the time of felling were recorded on permanent plots. For trees that died after the previous measurement, the time of death was also recorded on permanent plots.
Sub-samples of the tally trees were selected as volume, increment and height sample trees. The volume and increment sample trees were selected by weighing the sampling probability with stem basal area. The origin, damage, height, height of the lowest dry branch, height of the living canopy, possible length of the broken part, and age were measured for the volume and increment sample trees. For the increment sample trees (=volume sample trees on temporary plots), the height increment (for the 5 previous growing seasons and for the ongoing growing season) and bark thickness were recorded in addition to the variables listed above. In addition, an increment core was taken and sent to the laboratory for diameter increment and age measurements.
Bucking (division of the stem to quality classes) was done for volume and increment sample trees that were classified as saw log or pulp wood quality. Branchless or thin-branched stem, stem with dry branches, and stem with fresh branches were separated as quality classes for the saw log sized part of the stem. The quality class code, length and the reason for the decrease in quality were recorded for each quality class.
The median tree of the basal area distribution was selected as the height sample tree for each tree species group: pine (Scots pine, Pinus sylvestris L. and other conifers than Norway spruce), spruce (Norway spruce, Picea abies [L.] Karst.), broadleaf trees) in the predominant and the overgrowth tree story. If there were at least eight trees measured as tally trees for a tree species group, the upper quartile tree of the basal area distribution was also measured as a height sample tree.
2.3 Estimation methods
The estimation methods, including the sampling variance estimators, are described in detail in the Supplementary file S1. This sub-chapter gives an overview of the methods.
2.3.1 Estimation of areas
For estimating the area of a domain of interest we used the same method as in the NFI9, NFI10 and NFI11 (Tomppo et al. 2011; Korhonen et al. 2013, 2017). The area estimates are based on the number of the sample plot center points on land and in the domain of interest. We estimated the area represented by one sample plot center point by dividing the land area of the municipalities in the sampling region by the number of plots on land in the sampling region. We used the land areas published by the National Land Survey of Finland (Suomen pinta-ala… 2019) for this step. In the region of Upper Lapland (Fig. 1) we used the NFI11 data because NFI12 did not include this region. The sampling method for Upper Lapland was two-phase sampling with stratification (Korhonen et al. 2017). For this region we calculated the area represented by each sample plot center as follows: (i) we calculated the area represented by each sample plot center in the firsh phase sample as described above, (ii) we estimated the land area of each sampling region with the sample plot centers in each sampling region, and (iii) we calculated the area represented by each plot center in the second phase sample by dividing the land area estimate of each sampling region by the number of second phase sample plot centers in the second phase sample.
2.3.2 Estimation of growing stock volumes and biomass
Estimation of volume of growing stock consists of estimating the volumes for the sampled tally trees and estimating domain level mean and total values using the volume estimates of the tally trees. The estimation of volumes for the tally trees involved several steps, starting from modeling the independent variables (height, upper dimeter, crown height) that are not measured for the tally trees but are necessary for using the volume (Laasasenaho 1982; Tomppo et al. 2011) and biomass functions (Repola et al. 2007; Repola 2008, 2009). These steps are described in the Suppl. file S1.
We estimated the mean volumes by domain by dividing the sum of tally tree volume estimates multiplied by the tree expansion factor by the number of plot centers in the domain. We estimated the total volume for a domain by multiplying the mean volume estimate by the domain area estimate.
2.3.3 Estimation of volume increment
The volume increment in the Finnish NFI is defined as the increase in tree stem volume over bark. It includes the increment of trees alive at the inventory time and the increment of drain (i.e. trees that have been harvested or died naturally during the increment measurement period).
Different from the previous NFI reports, we used the permanent sample plot data for estimating the increment. We converted the volume increment between NFI11 and NFI12 measurements to annual before other estimation steps by dividing it by the calculated number of growing seasons between the two measurements. The number of growing seasons between the NFI11 and NFI12 measurements ranged from four to six and averaged to 4.93. The details of the increment estimation are presented in the Suppl. file S1.
2.3.4 Estimation of sampling variance
The sample plot clusters were located by systematic sampling (continental Finland) or by balanced sampling (Åland region). Therefore, the sampling variance estimators of random cluster sampling are not applicable as such. Since the first NFI, the variance estimators applied in NFI have taken into account the systematic design (see e.g. Heikkinen 1999). The sampling variance estimators applied in the NFI12 are described in the Suppl. file S1.
3 Results
3.1 Land use classes
According to the statistics of the National Land Survey of Finland the land area of Finland is 30.391 M ha (Suomen pinta-ala… 2014, 2019). The area is as of January 1st 2014 for Upper Lapland and as of January 1st 2019 for the rest of Finland.
86% (26.247 M ha) of the land area is forestry land. Forestry land is land that is not used for agriculture or infrastructure (roads, power lines, parks etc.). Forestry land accounts to 95% of the land area in North Finland and to 78% in South Finland. The standard error (square root of the sampling variance) for the estimate of forestry land area is 55 000 ha (0.2%).
Forestry land consists of productive forest land (production capacity of the site more than 1 m3 ha–1 a–1), poorly productive forest land (production capacity between 0.1 and 1.0 m3 ha–1 a–1), unproductive land (production capacity below 0.1 m3 ha–1 a–1), and other forestry land (forestry roads and permanent timber storage sites). The area of productive forest is 20.276 M ha, the area of poorly productive forest 2.536 M ha, and the area of unproductive land 3.224 M ha (Suppl. file S2: Table 1a). The area of other forestry land is 210 000 ha. The standard error for the productive forest area estimate is 88 000 ha (0.4%).
According to the FAO forest definition the forest area of Finland is 22.425 M ha (Suppl. file S2: Table 1d). The area of other wooded land is 744 000 ha and the area of other land is 7.223 M ha, of which 232 000 ha are other land with tree cover. About two-thirds of the nationally defined poorly productive forest is forest according to the FAO definition, and about one-third is other wooded land.
The area of forestry land has decreased from 26.8 M ha in the early 1920s to the current 26.2 M ha, i.e. by 600 000 ha (Table 3, Fig. 2). The area of forestry land has decreaed between the 1920s and 1960s, mainly due to the increase of the agricultural land area. After that, the area of forestry land has increased slightly until the mid-1970s, after which construction activity has reduced the area of forestry land. The area of forestry land has peaked in the results of NFI6 (1971–1976) at 26.8 M ha, compared to this, the area of forestry land has decreased by more than 500 000 ha. The area of non-forestry land has increased from the 1920s to the early 1960s, then decreased until the mid-1970s. After the 1970s, the area of the non-forestry land has increased again but has decreased between NFI11 and NFI12. However, the changes in the area estimates of the non-forestry land area since the 1980s are statistically insignificant.
| Table 3. Area of Finland by land use class (1000 ha) in 1921–2018. | |||||||
| NFI (years of measurement) | Productive forest | Poorly productive forest | Unproductive land | Other forestry land | Forestry land total | Other land | Land area total |
| NFI1 (1921–1924) | 18 032 1) | 4381 2) | 4471 | – | 26 844 | 3661 | 30 545 |
| NFI2 (1936–1938) | 17 085 1) | 4585 2) | 5004 | – | 26 674 | 3826 | 30 500 |
| NFI3 (1951–1953) | 17 352 1) | 4522 2) | 4441 | – | 26 315 | 4225 | 30 540 |
| NFI4 (1960–1963) | 16 909 1) | 4832 2) | 4492 | – | 26 233 | 4307 | 30 540 |
| NFI5 (1964–1970) | 18 697 | 3674 | 4226 | 70 | 26 667 | 3881 | 30 548 |
| NFI6 (1971–1976) | 19 738 | 3583 | 3371 | 86 | 26 778 | 3769 | 30 547 |
| NFI7 (1977–1984) | 20 065 | 3157 | 3049 | 103 | 26 374 | 4091 | 30 464 |
| NFI8 (1986–1994) | 20 074 | 2983 | 3093 | 151 | 26 301 | 4159 | 30 460 |
| NFI9 (1996–2003) | 20 338 | 2670 | 3156 | 154 | 26 317 | 4130 | 30 447 |
| NFI10 (2004–2008) | 20 085 | 2735 | 3259 | 184 | 26 263 | 4151 | 30 415 |
| NFI11 (2009–2013) | 20 267 | 2501 | 3228 | 198 | 26 193 | 4196 | 30 389 |
| NFI12 (2014–2018) | 20 276 | 2536 | 3224 | 210 | 26 247 | 4144 | 30 391 |
| 1) Well growing forest 2) Poorly growing forest | |||||||
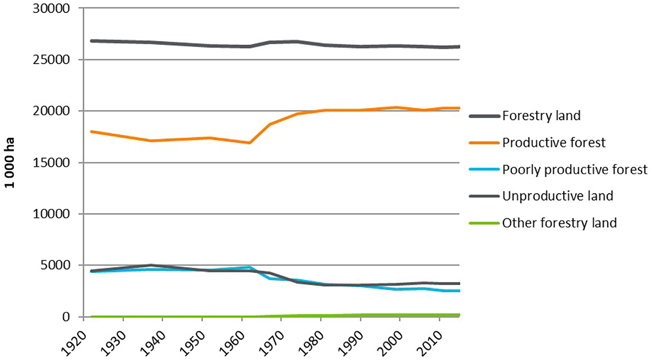
Fig. 2. Area (1000 ha) of Finland by land use classes 1921–2018.
The concept of productive forest has remained unchanged since the NFI5. The development of the productive forest is thus fully comparable only from the end of the 1960s onwards. Current productive forest area, 20.276 M ha is 1.6 M ha larger than the area of productive forest in the late 1960s and more than 2 M ha larger than the area of productive forest in the early 1920s. The increase in the productive forest ended in the early 1980s. The increase of the productive forest from the 1960s to the 1980s is largely explained by the drainage of unproductive peatlands. Peatland drainage was at its busiest at the turn of the 1960s and 1970s, up to 300 000 ha per year (Finnish Statistical Yearbook of Forestry 2004). The area of poorly productive forest has shrunk by nearly 1 M ha and the area of unproductive land by about 900 000 ha since the late 1960s. Drainage declined sharply in the 1980s and virtually ceased in the 1990s.
The area of productive forest according to NFI12 (20.276 M ha) is very close to the estimate of NFI11 (20.267 M ha). The estimates of both NFI11 and NFI12 are higher than the productive forest area according to NFI10 (20.085 M ha). In both NFI11 and NFI12, the standard error of the productive forest area estimate is 90 000 ha. The change in the estimate of productive forest area between NFI10 and NFI11 is not statistically significant, but the identicalness of the results of NFI11 and NFI12 suggests that either the area of productive forest area has increased since NFI10 or the NFI10 result was an under-estimate.
3.2 Forest ownership and restrictions on timber production
3.2.1 Ownership categories
52% of the forestry land area is owned by private individuals, 35% by the government, 7% by companies and 6% by communities (Suppl. file S2: Table 2b). In South Finland, the proportion of private owners is as high as 78%, while in North Finland it is only 38%. The proportion of government owned forestry land is 54% in North Finland and only 7% in South Finland. On productive forest, the proportion of private owners is higher (60%) than on forestry land (Suppl. file S2: Table 2a). The proportion of government owned productive forest is 26% of the total productive forest.
On productive forest available for wood production, the proportion of other ownership categories than government is dominating, while the protected areas are mostly government-owned (Suppl. file S2: Tables 2c and 2d). 65% of the productive forest available for wood production is owned by private individuals and the government owns only 19%. The companies account for 9% of area of the productive forest available for wood supply and the communities for 6%.
The ownership proportions of the growing stock volumes in combined productive forest and poorly productive forest (Suppl. file S2: Table 21c) are distributed almost identically to the proportions of area of forest available for wood supply. In the annual increment tables, the individuals and communities are grouped into one category and the government and companies into another category (Suppl. file S2: Table 22a). The proportion of private and company owned forests of the volume increment on productive forest and poorly productive forest is 76%, which is slightly higher than the corresponding proportion of volume.
The proportion of government-owned forests of productive forest area decreased from the 28% in the early 1950s to about 24% by the 1970s (Fig. 3). Before the 1940s, the proportion of government forests had been higher than this, 34–35% (Ilvessalo 1927, 1942). In recent decades, the proportion of government forests has increased slightly as forests have been bought for protection.
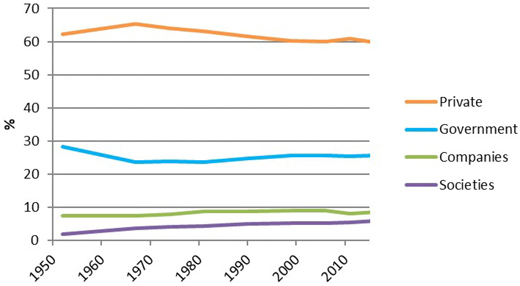
Fig. 3. The proportions of forest owner categories from the area of productive forests of Finland in 1951–2018.
3.2.2 Forest unavailabe for wood production
NFI12 data related to forest protection status and restrictions on wood production are described in the Suppl. file S3. 20% (5.3 M ha) of forestry land, including productive forest, poorly productive forest, unproductive land and other forestry land, is excluded from wood production and 13% (3.5 M ha) is in restricted wood production. The proportion of protected forest on productive forest area is clearly lower, 9% (1.8 M ha). In North Finland, the proportion of protected forests is higher than in South Finland, 33% on forestry land and 16% on productive forest. In South Finland, 5% of forestry land and 3% of productive forest is protected. The area protected productive forest is 1.830 M ha of which 380 000 ha are in South Finland.
Forest protection has been clearly increased since the early 1980s (Korhonen et al. 2020). There is no statistically significant change between NFI11 and NFI12.
3.3 Site fertility classes
3.3.1 Mineral soils
The site classification used in NFI12 is described in the Suppl. file S3. Of the total 26.2 M ha of forestry land, 66% are on mineral soils (Suppl. file S2: Tables 1 and 6). 76% of the productive forest are on mineral soils, while only one third of the poorly productive forest and unproductive land are on mineral soils.
The most typical site fertility type is mesic heath forests both in South and North Finland (Fig. 4). The proportion of this class is 50% of the productive forests on mineral soils in South Finland and close to 60% in North Finland. The proportion of herb rich forests is 3% and the proportion of herb rich heath forests is 24% in South Finland. In North Finland the proportions of these classes are 1% and 3% of the productive forests on mineral soils.
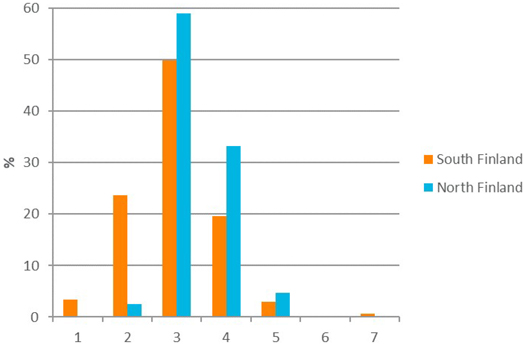
Fig. 4. The proportions of site fertility types (fertility classes) on mineral soils of the productive forest in South and North Finland according to NFI12: 1 = herb-rich forests, 2 = herb-rich heath forests, 3 = mesic heath forests, 4 = sub-xeric heath forests, 5 = xeric heath forests, 6 = barren heath forests, 7 = rocky and sandy soils and alluvial lands.
Since the 1950s, the proportion of the most fertile mineral soils (herb rich, mesic) has increased by about 15%-units in South Finland and the proportion of mesic sites by about 6%-units (Fig. 5). The proportion of sub-xeric heaths decreased in South Finland from the 1950s to the 1980s, but has remained almost the same since then. There has been no major change in the proportion of the most fertile mineral soil sites in North Finland, but the proportion of mesic heath forests has risen by 30%-units, i.e. doubled. The proportions of sub-xeric and xeric heath forests have correspondingly decreased in North Finland since the 1950s.
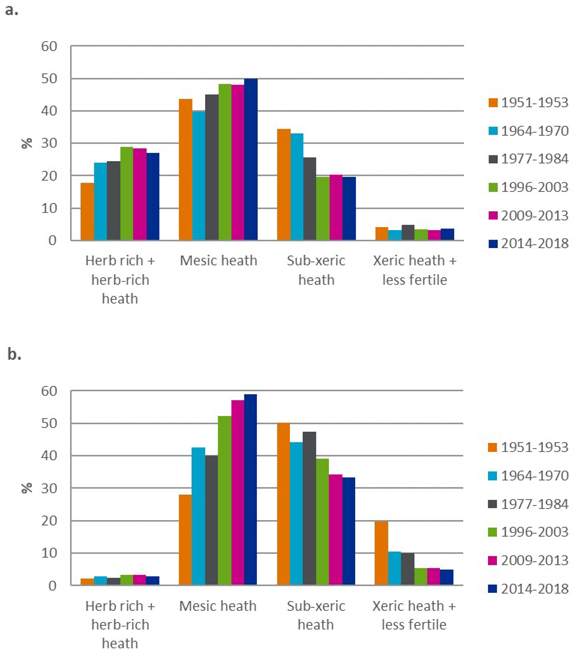
Fig. 5. The proportions of grouped site fertility types in productive forests on mineral soils in 1951–2018 a) in South Finland and b) in North Finland.
There are several reasons for the change towards more luxuriant vegetation (i.e. more fertile site types) on mineral soils: fertilization, recovery of nitrogen storages in humus layer after the use of slash-and-burn agriculture period, accelerated nutrient cycling as a result of forest management, climatic conditions, etc.
There are 1.32 M ha of drained mineral soil sites, i.e. 8% of the productive forest on mineral soils (Suppl. file S2: Table 5) are drained. A large part of these drained mineral soils, almost 700 000 ha, have originally been peatlands with a thin peat layer and the peat layer has decomposed as a result of the drainage (Tomppo 2000).
Three quarters of productive forests on mineral soils are on moraine soils (Suppl. file S2: Table 11). The proportion is the highest on mesic (81%) and sub-xeric (76%) site type classes. In both more fertile and dry site type classes the proportion of sorted soil types is higher. Moraine and sorted soils account for a total of 94% of the productive forests on mineral soils, and 82% of them are medium-grained, i.e. coarse silt or fine sand with a predominant grain size of 0.06–0.2 mm or 0.2–0.6 mm. The soil type of sorted soils is often fine-grained on the most fertile sites and quite often on mesic sites. Even in the moraine soils, the proportion of fine-grained particles is higher in fertile site types than in dryer site types.
The thickness of the soil layer above the bedrock is almost always more than 30 cm on mineral soils on productive forest. The proportion of the 10–30 cm class is 7% and the proportion of less than 10 cm class is only 3% (Suppl. file S2: Table 11).
3.3.2 Peatlands
The total area of peatlands is 8.79 M ha, which is 33% of forestry land (Suppl. file S2: Tables 1 and 4). There are 3.11 M ha of peatlands in South Finland and 5.68 M ha in North Finland.
At the beginning of the 1950s, there were still 9.74 M ha of peatlands (Ilvessalo 1956, 1957; Hökkä et al. 2002). The area of peatland on forestry land has decreased due to clearing for agriculture land, peat production, the construction of water regulation basins and other construction, and the turning of drained peatlands with thin peat layer to the mineral soils category after their peat layer has disappeared.
Undrained peatlands
Of the total area of undrained peatlands (4.11 M ha), 16% are spruce mires, 48% pine mires and 36% open mires. In South Finland (774 500 ha of undrained peatlands) the proportions are: spruce mires 28%, pine mires 48% and open mires 24%. In North Finland (3.33 M ha of undrained peatlands): spruce mires 14%, pine mires 48% and open mires 38% (Suppl. file S2: Table 4). 19% of the undrained peatlands are productive forest, 31% poorly productive forest and 50% unproductive land.
Of the undrained spruce mires 42% have thin peat layer (peat thickness less than 30 cm) (Suppl. file S2: Table 8). For the undrained pine mires and undrained open mires the proportions of thin-layered mires is 17% and 6%, respectively. The most common peat layer thickness class in the spruce mires in South Finland is 0–29 cm (54%), while in North Finland it is 30–99 cm (44%). In the pine mires the most common peat layer thickness class is 200+ cm in South Finland and 30–90 cm in North Finland. On open mires, the most common thickness class of peat in South Finland is the thickest class (200+ cm) with a proportion of 62%. In North Finland the thickness classes 30–99, 100–199 and 200+ cm are almost equally common (with proportions 27%, 36% and 31%, respectively).
Drainage status and it’s development
The assessment of drainage status is described in the Suppl. file S3. The area of drained peatlands, 4.68 M ha, is 53% of the total peatland area (Suppl. file S2: Table 4). 75% of the current peatland area in South Finland and 41% of the current peatland area in North Finland is drained peatland. 88% of the drained peatlands are productive forest; 96% in South Finland and 80% in North Finland. 11% of the drainage area is poorly productive forest; 3% in South Finland and 18% in North Finland. The corresponding proportions for unproductive land are 2%, 1% and 3%.
Transformed mires (Sarasto 1961), in which the undergrowth resembles mineral soil forest type, already totals to 3.33 M ha, which is 71% of the current drained peatland area. There are 2.03 M ha of transformed mires in South Finland, which is 87% of the drained peatland area. For North Finland the values are 1.30 M ha and 55%, respectively (Suppl. file S2: Table 5).
The area of transformed mires has grown rapidly and continuously (Fig. 6). According to NFI8, in the 1980s only 19% of the drained peatlands were transformed mires (South Finland 27%, North Finland 10%). According to NFI11, 61% of the drained peatlands were transformed mires (South Finland 78%, North Finland 45%) (Korhonen et al. 2017).
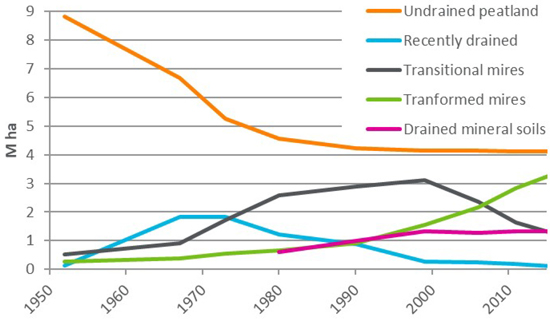
Fig. 6. Area of the drained mires by drainage stages and area of drained mineral soils in 1951–2018 in Finland.
The area of transforming mires is 1.24 M ha and it has continuously decreased since the late 1990s (Fig. 6). The area of non-changed drained peatlands is now only 109 000 ha because the draining of undrained peatlands has decreased close to zero in late 1990’s and the vast majority of the earlier drained peatlands have developed to more advanced drainage status classes. 61% of the recently drained peatlands are in North Finland (Suppl. file S2: Table 5).
There are 613 000 ha of drained peatlands where the draining has not been successfull, i.e. the sites have remained unsuitable for wood production. This corresponds to 13% of the current drained peatland area in the whole country (Suppl. file S2: Table 5).
3.4 Tree species dominance and age structure of forests
3.4.1 Dominant tree species and tree species proportions
The assessment of dominant tree species is described in the Suppl. file S3. Of the productive forest, 64% is Scots pine dominated forests, 25% is Norway spruce dominated and 10% is broadleaf dominated (Suppl. file S2: Table 14a). Birch dominated forests account for 9.2%, of which 6%-units are dominated by downy birch (Betula pubescens Ehrh.) and 3.2%-units by silver birch (Betula pendula Roth). The most common of the other tree species are European aspen (Populus tremula L.) dominated forests, which cover 70 000 ha (0.3% of productive forest), and common alder (Alnus incana [L.] Moench) dominated forests, which cover 46 000 ha (0.2% of productive forest). There are 24 000 ha of forests dominated by black alder (Alnus glutinosa [L.] Gaertn.). The most common forests of alien tree species are forests dominated by larch (Siberian larch, Larix sibirica Lebed. or European larch, Larix decidua Mill.) (22 000 ha) or lodgepole pine (Pinus contorta var. latifolia Engelm.) (9000 ha). At the time of the measurement, there has been 260 000 ha of treeless regeneration area (1.3% of the productive forest area).
In South Finland the proportion of Norway spruce dominated forests (33%) is markedly higher than in North Finland 16% (Fig. 7; Suppl. file S2: Table 14a). The broadleaf dominated forests are more frequent in South Finland (12%) than in North Finland (8%), also. The proportion of Scots pine dominated forests is 54% in South and 75% in North Finland.
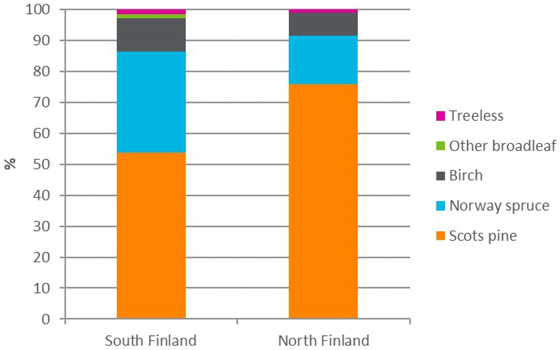
Fig. 7. Dominant tree species (Birch – Silver and downy birch) proportions of productive forest area according to NFI12 in South and North Finland.
54% of the productive forest are pure coniferous or pure broadleaf forests, where the proportion of coniferous trees in coniferous forests and broadleaf trees in broadleaf forests is more than 95% (Suppl. file S2: Table 15). If a 75% threshold is applied, the proportion of pure coniferous or pure broadleaf forests is 81%.
28% (5.617 M ha) of productive forest area are forests of one tree species and 36% (7.325 M ha) are forests of two tree species, when the number of tree species is estimated using the NFI tree stratum descriptions (Suppl. file S2: Table 16a). Forests of at least four tree species make up 7% of the productive forest. Due to weaker growing conditions, the single-species forests are markedly more frequent in North Finland than in South Finland.
In South Finland, the proportion of Scots pine dominated forests of the productive forest area is now almost equal to the propoprtion in the 1920s (Fig. 8). The proportion of Scots pine dominated forest decreased fom 1920s to 1950s, but has increased since then upto the beginning of 2000s. This increase was due to drainage of peatlands and extensive use of Scots pine in the regeneration. During the ongoing millennium, the proportion of Scots pine dominated forests has decreased due to increasing use of Norway spruce seedlings in the regeneration. The proportion of Norway spruce dominated forests increased in South Finland from 1920s to 1950s and then decreased from 1970s to 1990s. During the latest two decades the proportion of Norway spruce dominated forests have again increased in South Finland. The proportion of birch dominated forests was at the lowest level in the early 1970s, 6% of productive forest area. Since then, the proportion has increased upto 10%.
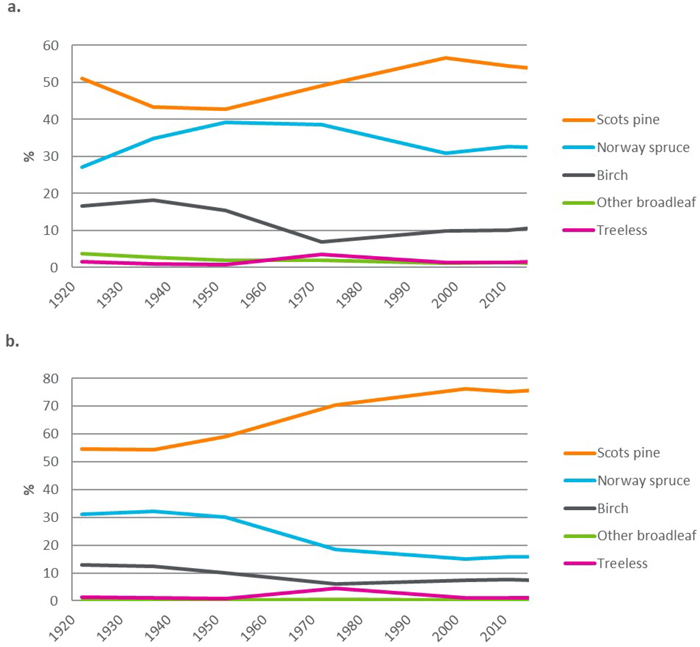
Fig. 8. Dominant tree species (Birch – Silver and downy birch) proportions of the productive forest area 1921–2018 in a) South Finland, and b) North Finland.
In North Finland, the proportion of Scots pine dominated forests increased from 1940s to the end of 1990s. This increase was caused by regenerating the under-productive old Norway spruce dominated forests with Scots pine and also by drainage of peatlands. During the ongoing millennium the proportion of Scots pine dominated forests in North Finland has remained stable. The proportion of Norway spruce dominated forests decreased in North Finland after the early 1950s due to the regeneration of the old Norway spruce forests.
3.4.2 Age and development classes
The most typical age class in productive forests is 41–60 years old forests, which account for 21% of the productive forest area (Suppl. file S2: Table 17a; Fig. 9). The proportions of the age groups 1–20 years, 21–40 years and 61–80 years are also at least 15% of the productive forest area. The 81–100 age group accounts for 11% of the productive forest area. Forests over 100 years of age make up 16% and forests over 120 years of age 10% of the productive forest area.
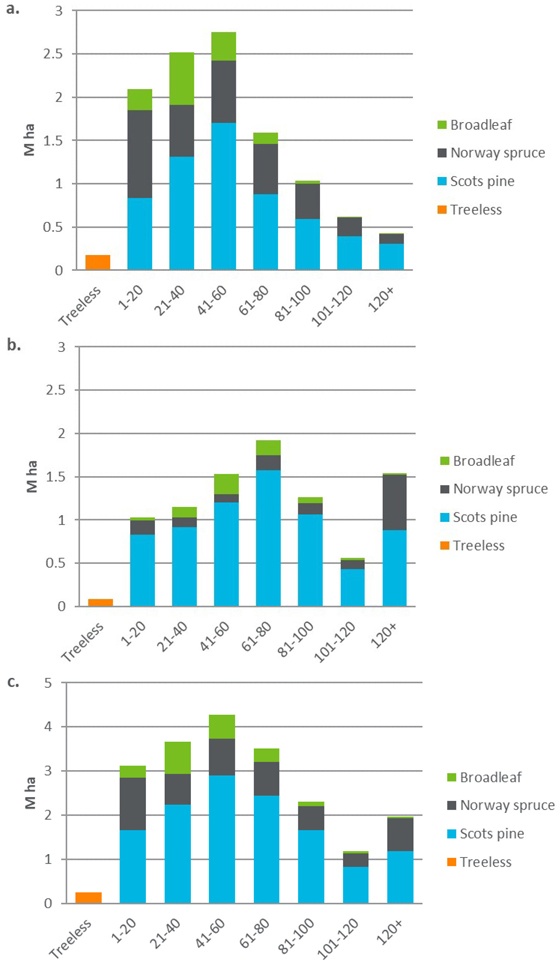
Fig. 9. Productive forest area (M ha) by age class and dominant tree species according to NFI12 in a) South Finland, b) North Finland, and c) the whole country.
The age structures of the forests of South Finland and North Finland differ markedly (Fig. 9), although the difference has leveled off in recent decades. In North Finland, the most common age group is 61–80 years, while in South Finland the age groups 41–60 and 21–40 years are the most common.
In the whole country, the most common age group of Scots pine dominated forests is 41–60 years, 22% of the area of the Scots pine dominated forests. In Norway spruce dominated forests, the most common age group is 1–20 years, which accounts for almost a quarter of the Norway spruce dominated forests. In broadleaf forests, the most common age groups are 31–40 years and 41–60 years.
Of the forests available for wood supply, 17% are seedling stands, 35% are young thinning forests, 35% are advanced thinning forests and 12% are mature forests (Suppl. file S2: Table 18a; Fig. 10). Regeneration areas (clear cut areas, seed tree stands and shelter tree stands) account for 2% of the wood production forest area. Unevenaged forests cover only 9000 ha, which is 0.05% of the forests available for wood supply.
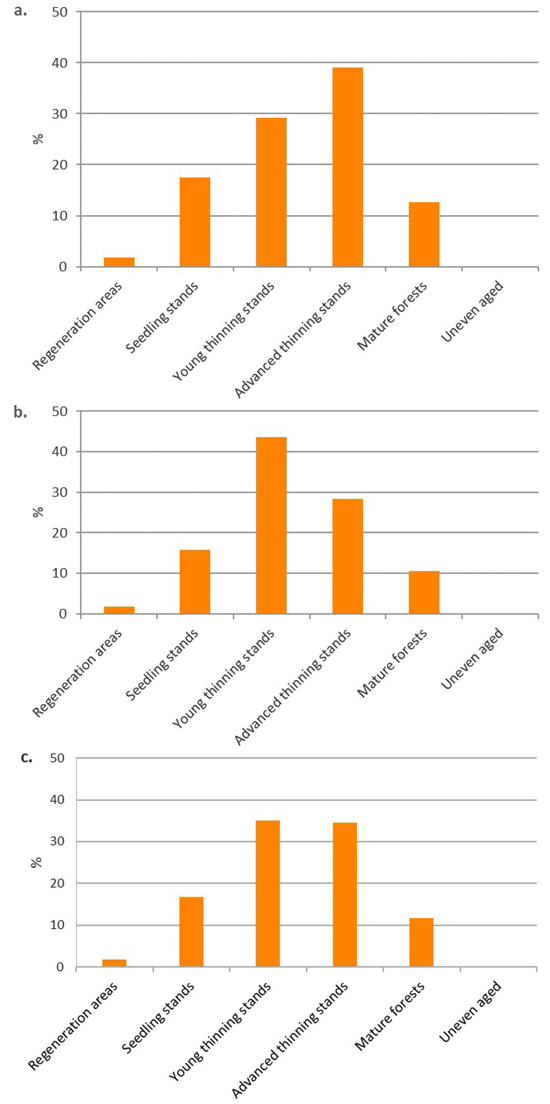
Fig. 10. The proportions of development classes of the productive forests available for wood supply according to NFI12 in a) South Finland, b) North Finland, and c) the whole country.
The proportions of mature forests and advanced thinning forests of area of forests available for wood supply in South Finland (39% and 13%, respectively) are higher than in North Finland (28% and 11%, respectively) (Fig. 10). Correspondingly, the proportion of young thinning forests is markedly lower in South Finland (29%) than in North Finland (44%). The proportions of seedling stands and regeneration areas are almost the same in South and North Finland, but in North Finland seed tree and shelter tree stands are more common than in South Finland, which indicates the wider use of natural regeneration in North Finland.
The Scots pine dominated forests on forests available for wood supply are mostly young and advanced thinning stage forests (proportions 38% and 37%, respectively), while advanced thinning forests and seedling stands are the most common classes in the Norway spruce dominated forests (proportions 34% and 26%, respectively). In broadleaf forests, the proportion of young thinning forests is as high as 55%. The proportion of mature forests is 10% in Scots pine dominated forests, 19% in Norway spruce dominated forests and 9% in broadleaf forests.
Of the seedling stands in the whole country, 55% are Scots pine dominated, 39% Norway spruce dominated and 6% broadleaf dominated. In the mature forests the proportions of tree species are almost the same as in the seedling stands. In young and advanced thinning forests, Scots pine dominated forests are more common (69% and 70%, respectively) and Norway spruce dominated forests are less common. In the seedling stands of South Finland, Norway spruce dominated forests are more common than Scots pine dominated forests – the proportion of Norway spruce dominated forests is already 52% of the seedling stands in South Finland.
3.4.3 Age and development class changes
Fig. 11 shows the age structure on productive forest since the 1920s. The comparison is influenced by the fact that in the 1920s and even in the 1950s uneven-aged forests were common. The age variation is large in uneven-aged forests, which makes it difficult to define the age class of a stand.
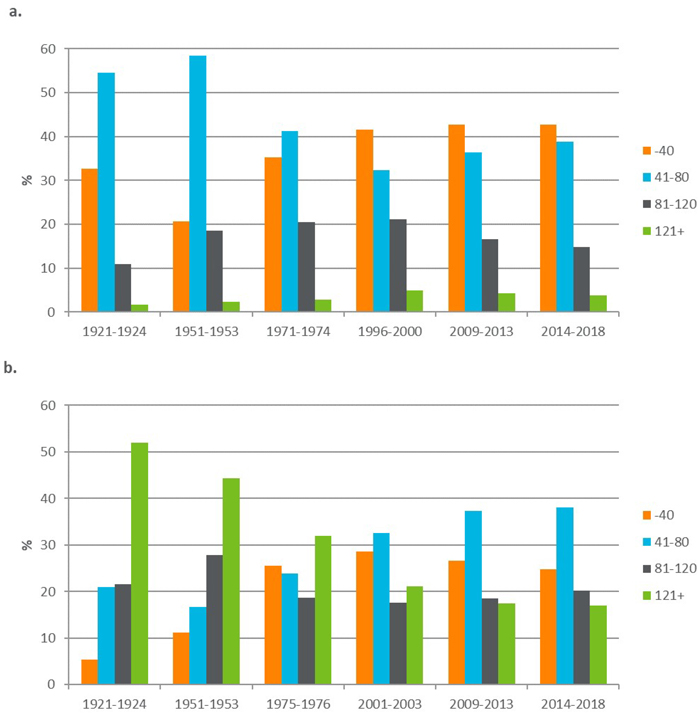
Fig. 11. The proportions of age groups (%) of the productive forest area 1921–2018 in a) South Finland and b) North Finland.
In South Finland, the proportion of the age class 0–40 years was almost one third of the productive forest area in the early 1920s. The proportion of the youngest forests decreased clearly upto early 1950s. Since then, the proportion of youngest forests has increased, upto the current proportion of 40%. In the 1950s the proportion of age class 41–80 years was almost 60% of the productive forest area in South Finland. The proportion of this class decreased from 1950s to early 1990s but increased after early 1990s upto the current 40%. The proportion of age class 81–120 years was only 10% of the productive forest area in early 1920s in South Finland and increased upto 20% by the 1990s. In this millennium the proportion of this age class has clearly decreased. The proportion the forests older than 120 years is now double the proportion in early 1920s in South Finland. Between 1990s and the NFI12 the proportion of these oldest forests has deacreased from 5% to 4%. This change is statistically not significant but since the slightly decreasing trend has continued from NFI9 to NFI12, it is unlikely that the change is caused by sampling error. The increasing growth rate of forests means that forest reach the maturity at younger age and the rotation age is decreasing (Kniivilä et al. 2020).
In North Finland, the most remarkable change in the age structure has been the decreasing area of forests over 120 years fron 1920’s to the beginning of this millennium. In the 1920s the proportion of forests over 120 years was more than 50% of the productive forest area while the current proportion is 17%. Between the NFI11 and NFI12 there has not been significant change in the proportion of this age class. The proportion of age class 81–120 years has slightly increased in this millennium and is now 20% of the productive forest area in North Finland. The proportion of forest younger than 81 years has increased continuously from 1920s to the beginning of this millenium, but has decreased ever since as the proportion of the forests younger than 41 years has decreased.
Between the NFI10 (2004–2008) and NFI11 (2009–2014), the proportion of advanced thinning forests on forests available for wood supply has increased from 25% to more than 30% (Korhonen et al. 2017). The proportion has continued to increase to the current 35%. The proportion of mature forests (now 12%) has slightly decreased since NFI9 (then 14%). The differences of mature forest proportions between successive NFIs are not significant, but between NFI9 and NFI12 the proportion estimate has been steadily declining. The proportion of seedling stands has decreased in line with the increase in the proportion of advanced thinning forests.
3.5 Volume and biomass of growing stock
3.5.1 Volume and biomass according to NFI12
The total volume of growing stock on productive forest and poorly productive forest is 2475 M m3 (Suppl. file S2: Table 20a). The standard error for the total volume estimate is 13 M m3, or about 0.5% of the total volume.
Of the total volume of growing stock, 1244 M m3, or 50%, are Scots pine, 740 M m3 (30%) Norway spruce and 492 M m3 (20%) broadleaf trees, mainly birch (Fig. 12). In South Finland, Scots pine accounts for 44% of the total volume, Norway spruce for 35% and broadleaf trees for 21%. In North Finland, the proportion of Scots pine is clearly higher, 62%, and that of Norway spruce 20% and broadleaf trees 18%.
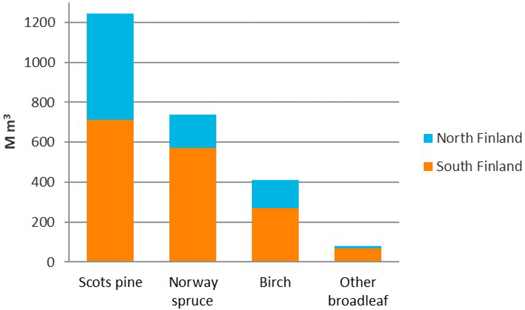
Fig. 12. Total volume of growing stock (M m3) by tree species according to NFI12 in South and North Finland.
The mean volume of growing stock is 109 m3 ha–1 on productive forest and poorly productive forest together and 119 m3 ha–1 on productive forest. The standard error of the latter mean volume estimate is 0.4 m3 ha–1, or 0.3%. The mean volume of growing stock on mineral soil on productive forest is 121 m3 ha–1 and that of peatlands 113 m3 ha–1. In South Finland, the mean volume of growing stock is 141 m3 ha–1 on productive forest and poorly productive forest together and 144 m3 ha–1 on productive forest. The corresponding averages in North Finland are 75 and 88 m3 ha–1.
24% of the total growing stock volume on productive forest and poorly productive forest and 23% of the total growing stock volume on productive forest are on peatlands (Suppl. file S2: Table 20a). The proportions of Scots pine and broadleaf trees are slightly higher and the proportion of Norway spruce is lower on peatlands than in the forests on mineral soils. In peatland forests, 53% of the growing stock volume is Scots pine, 24% Norway spruce and 23% broadleaf tree species.
90% of the total volume of growing stock is on forest available for wood supply (Supp. file S2: Table 20b). The proportion of volume of growing stock on forest not available for wood supply is clearly higher in North Finland (20%) than in South Finland (5%).
Of the total volume of 2189 M m3 on forest available for wood supply, 1088 M m3 (32%) is saw log volume (Suppl. file S2: Table 21a). The largest proportion of saw log volume of the stem volume is 43% for Norway spruce. The percentage is 32% for Scots pine, 18% for silver birch and only 4% for downy birch.
9% of the growing stock on productive forest and poorly productive land belong to the diameter class of less than 10 cm (Suppl. file S2: Table 25). The prorportion of the largest diameter class, more than 30 cm, is 21%. The proportion of this diameter class is 19% for Scots pine and 29% for Norway spruce.
The estimated total biomass of living trees is 1744 G kg of dry matter, including the stem, living and dead branches, foliage, stump and roots. The average biomass of the growing stock is 76 M kg ha–1 in productive forest and poorly productive forest together. About half of the biomass is carbon. On average, 57% of the forest biomass is stem biomass (Fig. 13). Living branches account for 12%, foliage for 6% and stumps and roots for 24%. Scots pine accounts for 45% of the total biomass of living trees, Norway spruce for 32%, birches for 19% and other broadleaf trees for 4%.
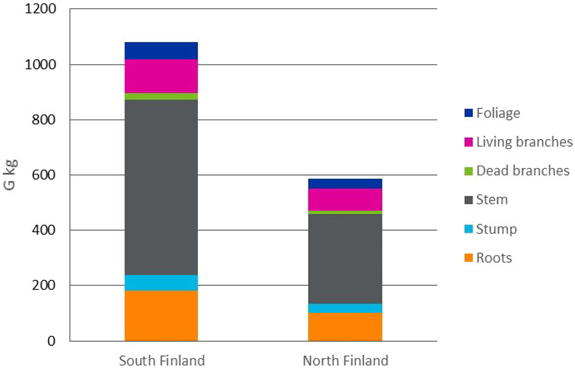
Fig. 13. Forest biomass (G kg) according to NFI12 in South and North Finland.
The stem biomass of dead trees is 27.5 G kg. The estimate only includes dead wood that, due to its degree of decay, is still suitable for at least firewood.
3.5.2 Development of growing stock volume
The current volume of growing stock, 2475 M m3, is 1.7 times higher than what it was in the 1920s (Fig. 14). In the 1930’s and in the 1950’s and 1960’s, the use of wood and construction reduced the volume of growing stock. The increase in growing stock volume in the 1940s is explained by the fact that logging was low during the war years. The comparability of the NFI results is slightly affected by two factors: 1) until NFI6, the tables of Ilvessalo (1947) were used for tree level volume estimation (in this publication, however, the results of NFI1 have been recalculated with the volume models currently in use), and 2) trees with a diameter of less than 2.5 cm have only been included in the inventory since NFI7.
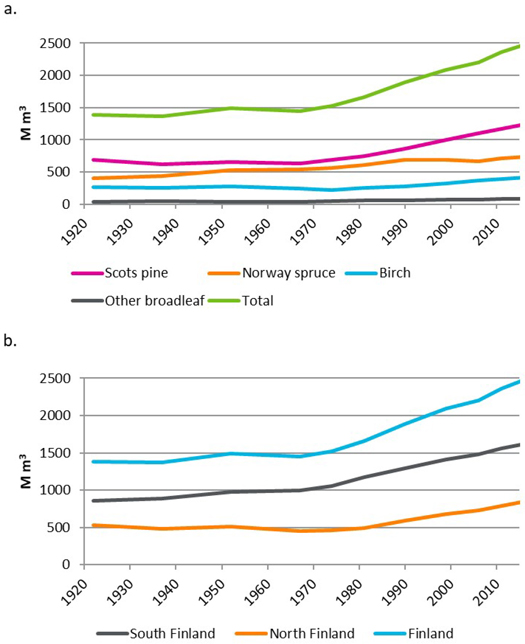
Fig. 14. The total volume of growing stock (M m3) in 1921–2018 a) by tree species, and b) in South Finland, North Finland and whole country.
The drainage of peatlands has increased the area of productive forest by about 1.5 M ha since NFI5 (Hökkä et al. 2002) and the drainage has increased the mean volume of peatland forests.
Half of the increase in the growing stock volume is Scots pine and about a third is Norway spruce, and the total volume of broadleaf trees has also clearly increased.
The mean volume of growing stock on productive forest has increased in the recent decades. For example, compared to the result of NFI7 (1977–1984), the mean volume has increased from 80 m3 ha–1 to the current 119 m3 ha–1, or about 30% (Suppl. file S2: Table 18b; Kuusela and Salminen 1991). The increase of mean volume between NFI11 and NFI12 (3 m3 ha–1), is remarkable considering the short time difference (5 years). The long-term increase in the mean volume is explained by the decline in low-yielding forests. Retention trees have also increased the mean volume in regeneration areas and seedling stands in the 21st century (Suppl. file S2: Table 18b; Tomppo et al. 2001).
3.6 Volume increment and forest balance
3.6.1 Volume increment
The annual volume increment on productive forest land and poorly productive forest land is 107.8 M m3 (Suppl. file S2: Table 22a). Almost half of the increment (49.8 M m3) is Scots pine, Norway spruce accounts for less than a third (33.7 M m3) and broadleaf trees for more than a fifth (24.3 M m3). The annual volume increment on land available for wood production is 103.0 M m3 (Suppl. file S2: Table 22b). The average annual increment on productive forest land is 5.2 m3 ha–1 (Fig. 15).
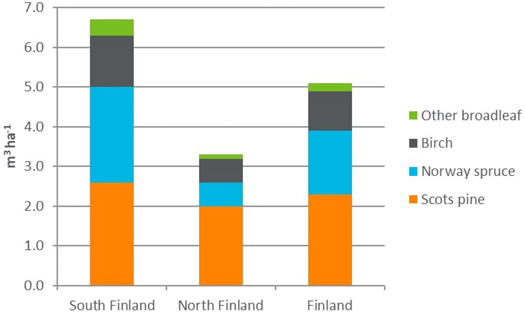
Fig. 15. The annual volume increment in productive forests by tree species according to NFI12 in South Finland, North Finland, and whole country.
South Finland accounts for 72% (77.3 M m3) of total annual increment and North Finland for 28% (30.6 M m3). The average annual increment on productive forest land is 6.9 m3 ha–1 in South Finland and 3.2 m3 ha–1 in North Finland (Fig. 15).
76% (81.6 M m3) of increment is in privately and community-owned forests and 24% (26.2 M m3) in forests owned by government and forest companies. In North Finland, the proportion of increment in forests owned by government and companies is 42% of the total increment.
77% (83.2 M m3) of the increment is on mineral soils and 23% (24.6 M m3) from peatlands. In North Finland, peatlands account for 32% of increment.
The volume increment estimates of NFI12 are based on remeasured permanent sample plots, while measurements on the temporary plots were used in the previous inventories. In the NFI12, the volume increment estimate calculated from permanent plots was 2 M m3 smaller than the estimate from temporary plot data. The increment estimates from NFI7 to NFI11 are comparable, although some changes in estimation methods and sampling trees for increment measurements were made in the 1980s and 1990s. In the older inventories, different threshold values were applied in tree sampling, e.g. in NFI6 the minimum diameter at breast height (dbh) was 2.5 cm. The proportion of trees smaller than 2.5 cm in dbh was 2.1% (Kuusela and Salminen 1991) of the NFI7 volume increment estimate. The increment of drain has been included since the 1960s (NFI5) (Kuusela 1973). The proportion of increment of drain is 6% of the NFI12 total volume increment estimate.
The annual volume increment estimate, 107.8 M m3, is 2.2 times the estimate of NFI2 in the 1930s (for the current territory of Finland), 49.8 M m3 (Fig. 16). The increment showed a limited increase from the 1920s to the late 1940s, but according to the NFI4 results, increment decreased in the late 1950s. The slowdown in increment between NFI3 and NFI4 is partly explained by the strong increase in logging in the years before NFI4, the effect of which is underlined by the fact that the increment of drain was not yet included in the increment estimates. Unfavourable climatic conditions also reduced the increment estimate of NFI4 (Kuusela 1973). In the early 1960s increment increased markedly, but leveled off in the late 1960s. Since then, the volume increment has steadily increased. According to the study of Henttonen et al. (2017), environmental changes, such as climate change, explains 37% of the increase in increment of growing stock on mineral soil from the 1970s to the 2010s.
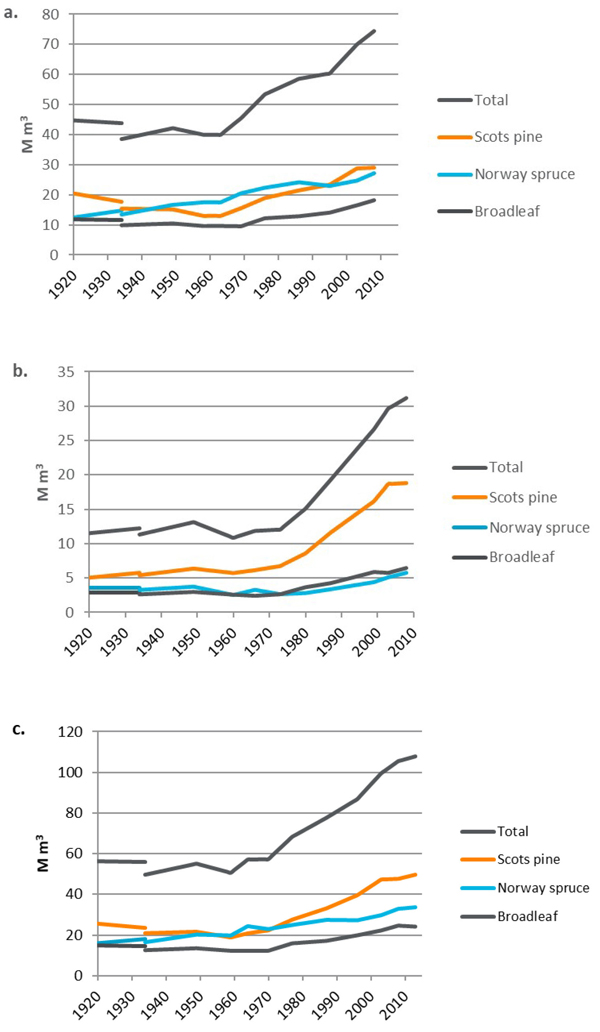
Fig. 16. The annual volume increment (M m3 by tree species in a) South Finland b) North Finland, and c) the whole country 1920–2014. NFI1 estimate is for the territory of Finland of those times, NFI2 estimate for both the current and historical territory of Finland.
Between NFI9 and NFI10, the annual increment of growing stock increased from 86.8 to 99.5 M m3. Between NFI10 and NFI11, the annual increment continued to increase to 105.5 M m3 and between NFI11 and NFI12 to 107.8 M m3. Between NFI11 and NFI12, the increase in increment has decreased.
3.6.2 Annual variation in increment
Estimation of growth indices is described in the Suppl. file S1. Figure 17 shows the average growth indices of Scots pine, Norway spruce and birch in South and North Finland. Table 4 shows the average increment indices for the increment measurement periods of NFI11 and NFI12.
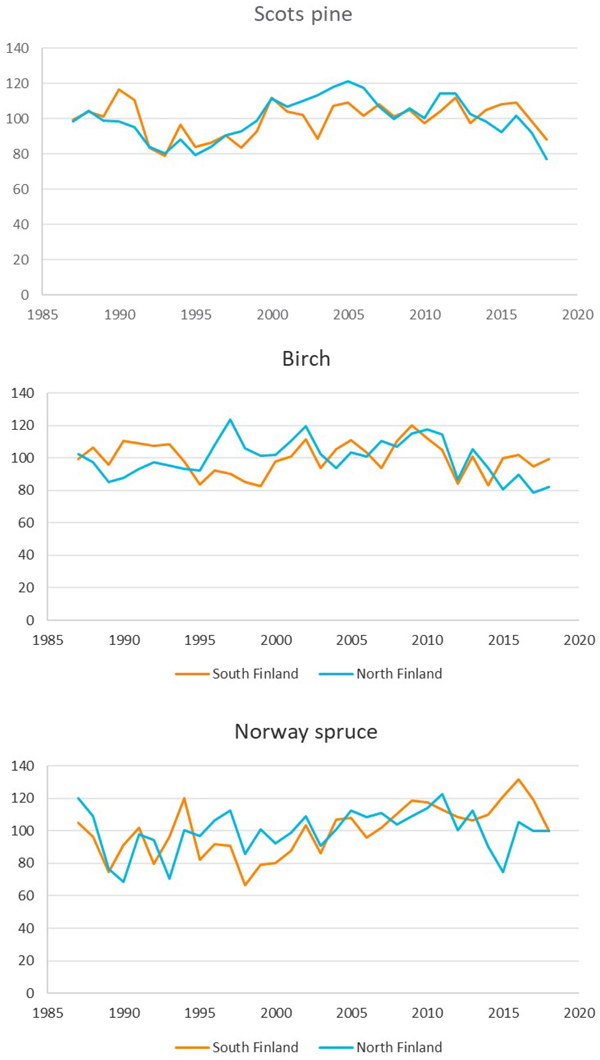
Fig. 17. The increment indices for Scots pine, Norway spruce and birch (silver and downy birch) in South and North Finland.
| Table 4. Average increment indices for the increment measurement periods of NFI11 and NFI12 of Finland (100 = average level of 1985–2018). | ||||||
| Scots pine | Norway spruce | Silver and downy birch | ||||
| NFI | South Finland | North Finland | South Finland | North Finland | South Finland | North Finland |
| NFI11 | 104 | 105 | 110 | 106 | 104 | 104 |
| NFI12 | 104 | 100 | 114 | 98 | 99 | 93 |
In North Finland the growing conditions have been less favourable in NFI12 than in the NFI11 increment measurement period for all tree species. In South Finland there are differences between species. For Scots pine there is no significant difference between NFI11 and NFI12 increment measurement periods. For Norway spruce the NFI12 increment measurement period has been more favourable than that of NFI11. For birch the NFI11 increment measurement period was more favourable.
3.6.3 Forest balance
The estimation of forest balance is described in Suppl. file S1. The calculated final growing stock for the balance period between NFI11 and NFI12 is 26 M m3 larger than the total volume of growing stock measured in NFI12 (Table 5). The standard error of the change estimate of the growing stock, based on the volumes measured in NFI11 and NFI12, is 17.6 M m3, i.e. the observed difference in the final growing stock is 1.5 times the standard error. The balance matches well for broadleaf trees and Norway spruce both in South and North Finland. The final growing stock calculated for Scots pine in South Finland is 18 M m3 larger than the final growing stock measured in NFI12.
| Table 5. Forest balance between NFI11 and NFI12 mid years (2011–2015) for South Finland, North Finland, and the whole country. Notation: GS11 = Volume for growing stock in NFI11, GS12 = Volume for growing stock in NFI12, Difference = Increment–Drain–(GS12–GS11). | |||||||||
| GS11 | Increment | Drain | GS11 +Increment –Drain | GS12 | Increment –Drain | GS12–GS11 | Difference | Standard error of change | |
| A | B | C | D = A+B–C | E | F = D–A = B–C | G = E–A | F–G | ||
| M m3 | |||||||||
| South Finland | |||||||||
| Scots pine | 686 | 154 | 108 | 732 | 713 | 45 | 27 | 18 | 8.5 |
| Norway spruce | 552 | 140 | 115 | 577 | 572 | 25 | 20 | 5 | 9.1 |
| Broadleafs | 326 | 92 | 83 | 335 | 339 | 9 | 13 | -4 | 4.4 |
| Total | 1564 | 386 | 306 | 1644 | 1624 | 80 | 60 | 20 | 14.1 |
| North Finland | |||||||||
| Scots pine | 488 | 96 | 49 | 534 | 530 | 46 | 43 | 3 | 8.6 |
| Norway spruce | 156 | 28 | 14 | 171 | 168 | 14 | 11 | 3 | 5.0 |
| Broadleafs | 149 | 29 | 25 | 153 | 153 | 4 | 5 | 0 | 3.5 |
| Total | 793 | 153 | 88 | 857 | 852 | 64 | 59 | 5 | 10.6 |
| Whole country | |||||||||
| Scots pine | 1174 | 249 | 157 | 1266 | 1244 | 92 | 70 | 22 | 12.1 |
| Norway spruce | 708 | 168 | 129 | 747 | 740 | 39 | 32 | 7 | 10.4 |
| Broadleafs | 474 | 122 | 108 | 487 | 492 | 14 | 18 | -4 | 5.6 |
| Total | 2356 | 539 | 394 | 2502 | 2475 | 145 | 119 | 26 | 17.6 |
The difference between the calculated and measured change in growing stock volume (26 M m3) is within the double standard error (95% confidence interval) of the estimated change in the total growing stock volume. The standard error of the change estimate in Table 5 is estimated assuming that the NFI11 and NFI12 estimates of volume are independent which is not completely true. Appr. 20% of the sample plots are permanent and the true sampling error of change estimate is therefore somewhat lower than presented in Table 5. Compared to the volume increment estimate of the period, the difference is 4.8%, which means that the balance would match if the increments estimate were 4.8% lower. Based on the balance calculation, the volume increment is probably not under-estimated, although the estimate calculated from the remeasured permanent plots is lower than the estimate employing temporary plot measurements.
There are several sources of uncertainty in the forest balance calculation. The growing stock volume estimates and the increment estimate include sampling error. The statistics on removals may be incomplete and contain measurement error caused by loosing of bark in the processing of the stem. It is not possible to define an exact time stamp for the volume estimates because the field data are collected over several years. Changes in land use and removals on non-forestry land may cause further uncertainty.
3.7 Forest damage
Damage was observed on a total of 9.05 M ha, corresponding to 49% of the productive forest available for wood supply (Suppl. file S2: Table 41a). More than half of the damage area (4.6 M ha) are classified as mild damage which means that the damage has not affected the quality of the forest stand. The area of more severe damage is 4.4 M ha (where the damage is at least slightly affecting the technical quality or yield of timber). The proportion of the most serious damage, i.e. complete damage that have destroyed the growing stock or causes need for immediate regeneration, of the productive forest available for wood supply is only 0.1%.
Measured by the area affected, the most significant causes of damage on productive forest available for wood supply are abiotic (3.3 M ha), followed by fungal pests (1.36 M ha), ungulates (1.01 M ha) and insect pests (0.13 M ha) (Fig. 18). Unidentified damage is observed on 2.34 M ha of productive forest available for wood supply. The class ungulates includes damage by moose (Alces alces L.) and deers, namely roe deer Capreolus capreolus L. and white-tailed deer Odocoileus virginianus Zimmermann.
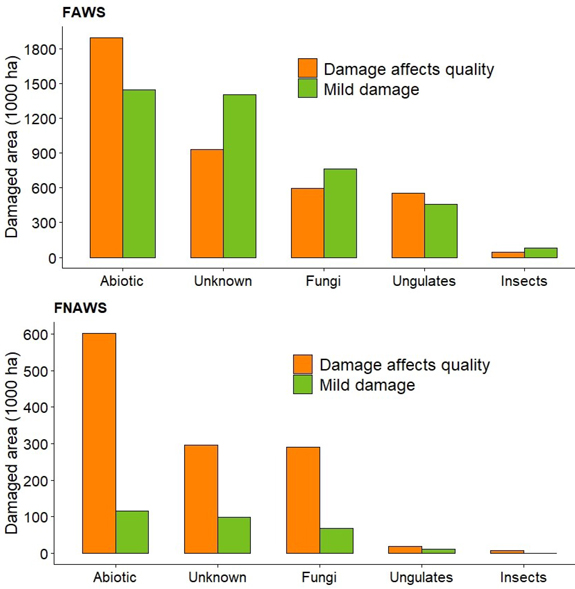
Fig. 18. Area of damaged forest by different damage agent groups in forests available (FAWS) and non-available for wood supply (FNAWS) according to NFI12 in Finland.
On productive forest not available for wood supply, damage was observed on 1.5 M ha (85% of the total area of the class) (Suppl. file S2: Table 41b; Fig. 18). On 67% (1.23 M ha) of the damage area, the damage is degrading the forest quality when assessed with the same criteria as in forests available for wood supply. Serious damage occur in 16% and complete damage in 1% of the total area of the class.
In each group of damage causing agents there are a few agents that cause vast majority of the damage. Among the abiotic damage snow, imbalance of nutrients in the soil and wind cause 87% of all the abiotic damage (when those damage that cause degrading of forest quality are considered), (Fig. 19). Among the insect damage, 56% of the damage area is caused by the European pine sawfly (Neodiprion sertifer G.), the spruce bark beetle (Ips typographus L.), and the large pine weevil (Hylobius abietis L.). Among the fungi damage, 45% of the damaged area were due to the resin top disease caused by Cronartium flaccdium (Alb. & Schwein.) and C. pini (Wild.), the root rot disease caused by Heterobasidion annosum (Fr.) and H. parviporum (Niemelä & Korhonen), and the Scleroderris canker caused by Gremmeniella abietina (Lagerb). The proportion of unidentified causing agent is high among the insect and fungi damage.
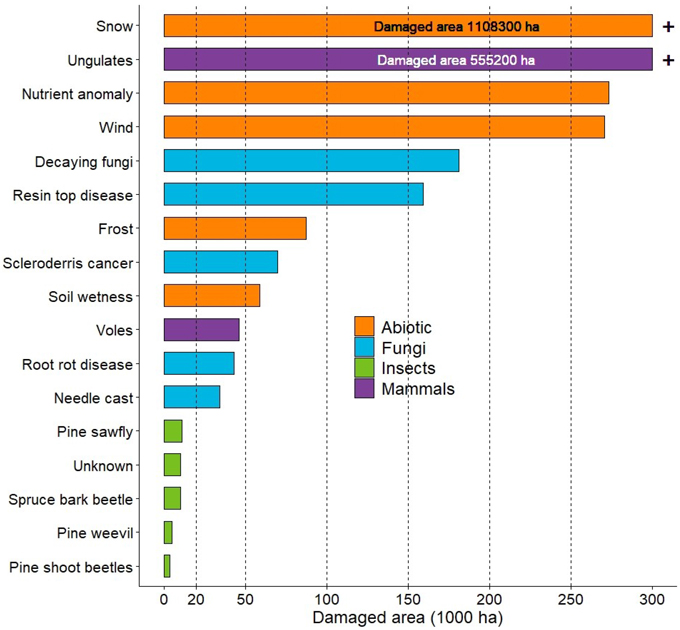
Fig. 19. The most severe damage agents (when measured in terms of area affected) in forests available for wood supply according to NFI12 of Finland. The damage here only includes the quality decreasing damage.
Most of the damage are observed in pine dominated forests – the area of pine dominated damaged forests, excluding mild damage, is 2.94 M ha. The area of spruce dominated damaged forests is 0.95 M ha and broadleaf forests 0,55 M ha. Figure 20 shows the damage area by dominant species for the causing agents abiotic, fungi, ungulates and insects. This shows more species-specific damage such as the spruce needle rust caused by Chrysomyxa ledi (Alb. & Schwein.) or the insect damage on pine caused by the pine-shoot beetles (Tomicus piniperda L., Tomicus minor L.
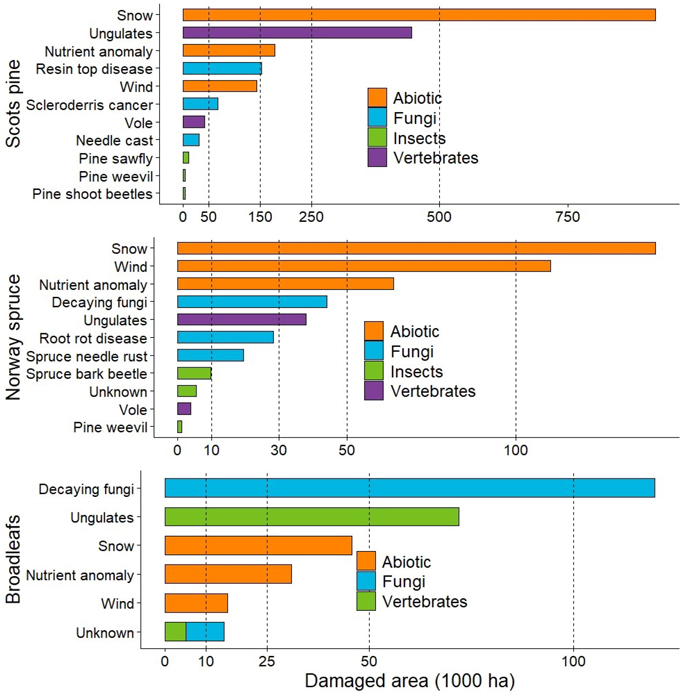
Fig. 20. The most common damage agents (when measured in terms of area affected) in forests available for wood supply by dominant tree species according to NFI12 of Finland. The damage here only includes quality decreasing damage.
For comparing the damage areas between different damage agents, it should be noted that the estimated damage areas for insect and fungal damage should be treated as underestimates: while the field season for NFI lasts from April to October, symptoms for some of the fungal or insect pests (e.g. leaf discoloration) are not even visible and therefore not quantifiable during the full field season. On contrary, browsing damage by ungulates happen mostly during winter, allowing them to be quantified during the full NFI field season.
The scale of ungulate browsing damage across the country is further illustrated in Fig. 21. The damage are most severe in Northern Finland and South-West Finland. In Northern Finland the damage are largely caused by moose only as the deer species are not abundant in Northern Finland. Whereas, in South-West Finland the two deer species are present as well, and in some areas they are even more abundant than moose. In South-West Finland, the damage in young pine seedling stands is the most severe in the areas with the densest population of the two deer species.
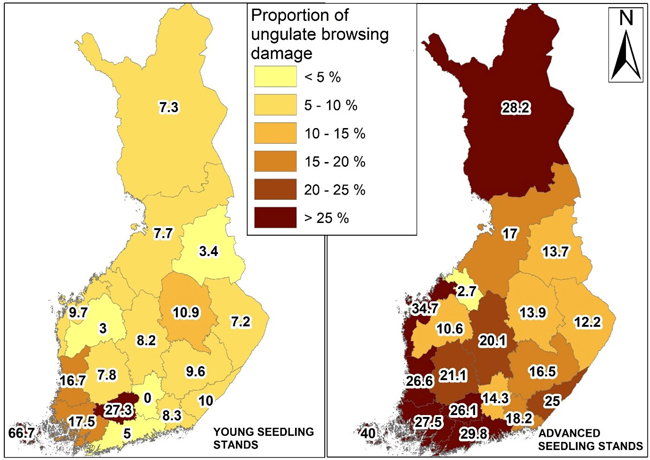
Fig. 21. Proportion of ungulate browsing damage in young (left) and advanced (right) pine dominated seedling stands in Finland by regions according to NFI12. The damage here only includes quality decreasing damage. In young seedling stands the mean height of crop seedlings is < 1.3 m and at least 1.3 m in advanced seedling stands.
3.8 Forest quality and forest management
3.8.1 Forest quality
Classification of forest stands in quality classes is described in the Suppl. file S3. 76% of the productive forests available for wood supply are of good or satisfactory quality (Fig. 22; Suppl. file S2: Table 28a). 24%, or 4.4 M ha, are of passable quality or under-productive. The proportion of good quality forests has decreased slightly in recent years and is clearly lower than at the turn of the 1980s and 1990s (NFI8), but considerably higher than in the 1950s and 1970s (Fig. 23). The combined proportion of good or at least satisfactory forests is somewhat higher than in previous inventories – and at the same time higher than in any previous inventory. 6% of the forests available for wood supply are under-productive. The proportion is slightly lower than in the most recent previous inventories and markedly lower than in NFI3–NFI8. In South Finland, the proportion of good quality forests is higher than in North Finland (Fig. 22).
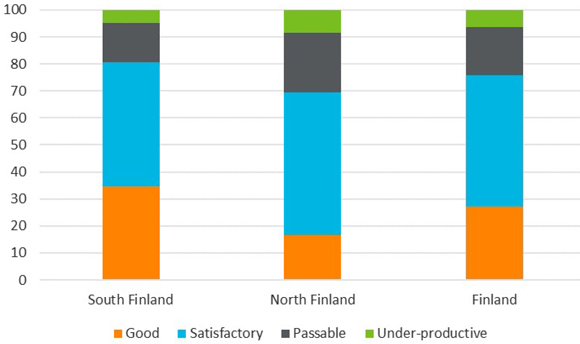
Fig. 22. Proportions of quality classes of the forests available for wood supply in South Finland, North Finland and the whole country according to NFI12.
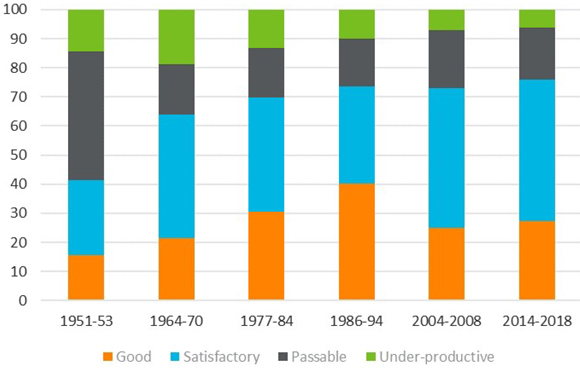
Fig. 23. Area of forests by quality classes in 1951–2018 in Finland. NFI3: productive forest land according to the criteria of those times, NFI5: excluding protected forests, NFI8–NFI12 excluding all forests not available for wood supply.
Almost 70% of the forests land unavailable for wood supply are of passable quality or under-productive when classified with the same economic criteria as the production forest. Typically, damage or age of growing stock are the reasons of under-productivity (Suppl. file S2: Table 28b).
Uneven spatial distribution or size distribution of trees, as estimated in the field, is the most common cause of decreased quality. It has been recorded for 4.0 M ha, which is 22% of productive forest available for wood supply (Fig. 24; Suppl. file S2: Table 28a). Forest damage has been recorded as the most significant cause of quality reduction for 3.2 M ha (17% of the productive forest available for wood supply). The area has increased by 140 000 ha compared to the previous inventory. The technical quality of the growing stock, such as thick branches, has now reduced the quality for 2.1 M ha (11%) of forests.
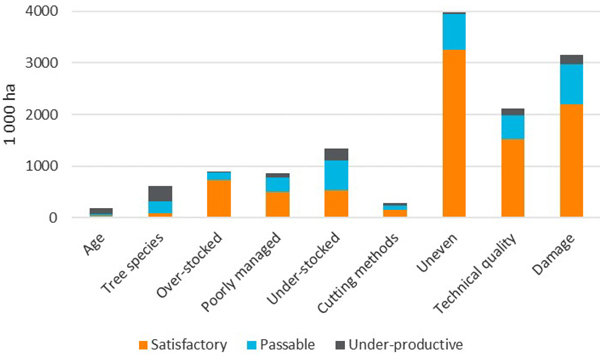
Fig. 24. Area of forests available for wood supply by the reason for degraded quality according to NFI12 of Finland.
900 000 ha of forests are markedly denser than recommended in the forest management guidelines and where the density of growing stock is reducing yield (4.9% of the productive forests available for wood supply). These over-dense forests are typically thinning stands where the thinning has been delayed causing suppression of the tree crowns. Poor forest management is recorded as the cause of decreased quality for seedling stands where the thinning is delayed, thus these seedling stands are not included in the 900 000 ha of forests that have been classified as over-dense in NFI12.
There are 860 000 ha (4.7% of the productive forests available for wood supply) of poorly managed regeneration areas, seedling stands and young thinning stands. In these forests the regeneration or pre-commercial thinning operations have been neglected or delayed. 1.3 M ha (7.3%) of forests are under-stocked for site-induced reasons (naturally under-stocked forests). Poorly accomplished harvesting is the reason for the decrease in the quality for 270 000 ha (1.5%). In these forests the thinning or pre-commerial thinning has been too heavy or selection of remaining trees has failed.
Low-value tree species are the reason of decrease in quality for 610 000 ha (3.3% of the productive forest available for wood production. There are 180 000 ha (1%) of forests with over-mature growing stock where the increment has already clearly decreased or damage related to ageing of trees is observed.
More than one reason for the decrease in quality was recorded for 7.3 M ha, most often uneven spatial or size distribution of trees, damage or technical quality.
The area of under-productive forests is 1.2 M ha, which is 6% of the productive forests available for wood supply. As compared to mid 1960s, the proportion of under-productive forests has decreased from almost 20% to 6% (Fig. 23). In the mid 1980s, there were more than 500 000 ha of under-productive, over-aged forests (Fig. 25). In NFI12, this area has decreased to one fifth, the development is partly due to the increased protection of old forests. The area of forests where damage has caused the under-productive state has remained stable since 1980, at around 200 000 ha.
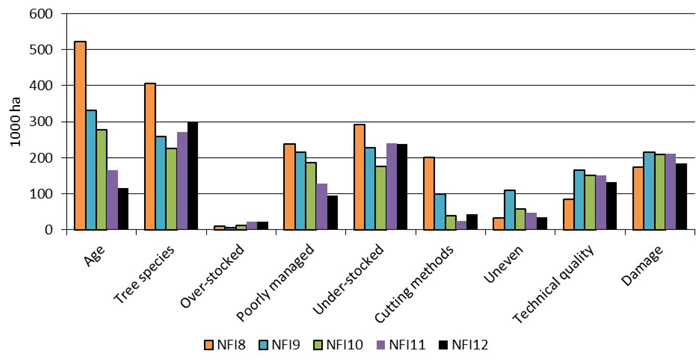
Fig. 25. Reasons for degraded quality in the productive forests available for wood supply in 1986–2018 in Finland.
The total area of clear-cut areas (not yet regenerated) is 254 000 ha, which is almost the same amount as in the previous inventory. Of these areas, 36 000 ha are under-productive or of passable quality, indicating that the regeneration is delayed or has completely failed. The area of under-productive clear-cut stands has decreased markedly since NFI11 and is less than the area observed in NFI10. This indicates that the timing of regeneration opeations has markedly improved in the past 10 years.
The total area of stands cut for natural regeneration (seed or shelter tree stands) is only 74 000 ha. Of these 32 000 ha are under-productive or of passable quality. The regeneration sites usually develop to seedling stands in few years. Thus, the quality of development classes seed trees and shelter trees does not entirely describle the success of natural regeneration – part of the recently cut successfull natural regeneration sites are no longer in the regeneration development classes at the time of the field work. The quality of regeneration areas (clear cut stands and stands cut for natural regeneration) has clearly improved in recent years and decades, this is partly due to the decline in natural regenation (see Chapter 3.8.2).
Of the seedling stands (young and advanced seedling stands combined), 80% are of good or satisfactory quality and 4.6% are under-productive. Damages and uneven spatial or size distribution of crop seedlings are the most frequent reasons for decreased quality in seedling stands (Suppl. file S2: Tables 29 and 30). Compared to the previous inventory, the proportion of good quality seedling stands has increased and the proportion of under-productive ones has decreased.
71% of young thinning forests are of good or satisfactory quality and 6% are under-productive. The proportions are approximately the same as in the previous inventory. 82% of the advanced thinning forests are of good or satisfactory quality and less than 4% are under-productive (Suppl. file S2: Table 30). The proportion of the good quality class has decreased, but the combined proportion of the good and the satisfactory classes has increased compared to the previous inventory.
67% of the mature forests are of good or satisfactory quality and 16% are under-productive. The combined proportion of the good and satisfactory quality classes has increased slightly and the proportion of under-productive forests is unchanged compared to the previous inventory. The quality distribution of advanced thinning stage forests and mature forests is at the same level as in the previous inventory.
3.8.2 Regeneration methods and succes of regeneration
8.9 M ha of the seedling stands and thinning forests on productive forest available for wood upply have been established with natural regeneration. 7.1 M ha of the seedling stands and thinning forests have been cultivated (through planting or direct seeding), i.e. the proportion of artificially regenerated forests in these development classes is 44% (Suppl. file S2: Table 31a). 72% of the seedling stands have been established with artificial regeneration. 42% of the young thinning forests and 34% of the advanced thinning forests have been established with artificial regeneration. In mature forests it is in most cases impossible to assess the regeneration method, therefore the regeneration method is not recorded for mature forests. In some cases, it is difficult to estimate the regeneration method in advanced thinning stands, also. The field teams have beed instructed to classify the stand as naturally regenerated if it is not possible to observe signs of artificial regeneration.
Unsuccessful cultivation was observed on 780 000 ha of forests, which is 11% of the area of forests established with artificial regeneration. Only 22% of the unsuccessfully cultivated forests are under-productive, i.e. the majority of these forests have at least reasonable density of cultivated or naturally regenarated growing stock. In the seedling stand development classes the proportion of unsuccessful cultivation is 10% of the artificially regenerated seedling stands.
Supplementary file S2 table 31b shows the area of seedling stands by the number of crop seedlings and the total number of seedlings. 18% of the advanced Scots pine seedling stands are sparse (number of crop seedlings per hectare less than 1450). Among the naturally regenerated Scots pine seedling stands the proportion of sparse stands is 26%, among the planted Scots pine seedling stands 19%, and among the direct sown Scots pine seedling stands 10%. The advanced Norway spruce seedlings stands are mainly planted. 16% of the planted advanced Norway spruce seedling stands are sparse. More than one third of the naturally regenerated advanced Norway spruce seedling stands are sparsely stocked. Half of the advanced broadleaf seedling stands are sparse, but they include sites that have been unsuccessfully regenerated for conifers. Therefore, the Suppl. file S2 table 31b should not be used for comparing the regeneration results for conifers and broadleaf species.
Slightly less than half of the advanced coniferous seedling stands are fully stocked or at least almost fully stocked (more than 1950 crop seedlings per hectare). The proportion is highest in direct sown advanced Scots pine seedling stands (65%) and lowest in naturally regenerated advanced Norway spruce seedling stands (31%).
3.8.3 Accomplished and proposed cuttings
During the 10-year period preceding the inventory, cuttings (including early and later pre-commercial thinings) have been carried out on a total of 7.4 M ha, which is 40% of the productive forest available for wood supply (Suppl. file S2: Table 32a).
The total area of accomplished pre-commercial thinnings is 2.0 M ha, the area of accomplished thinnings 3.5 M ha and the area of accomplished regeneration cuttings 1.3 M ha during the 10-year period preceding the inventory (Suppl. file S2: Table 32a; Fig. 26). The total area of cuttings is slightly larger than in the previous inventory (Korhonen et al. 2017). The area of pre-commercial thinnings during the 10-year period preceding the inventory is 220 000 ha larger and the area of accomplished thinnings is 350 000 ha larger than in the previous inventory.
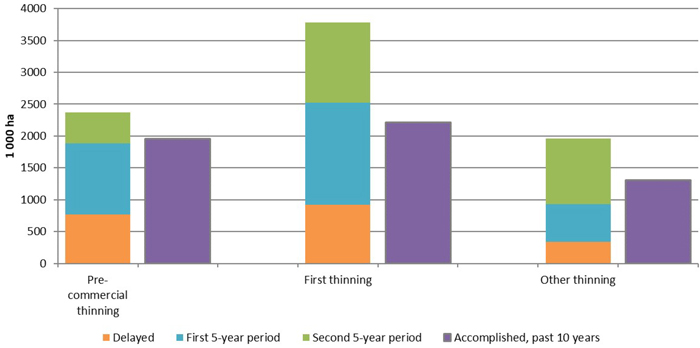
Fig. 26. Accomplished cuttings in the 10-year period before the measurement and proposed cuttings by proposed timing for the coming 10-year period according to NFI12 in Finland. Pre-commercial thinning includes the early management of seedling stands. Delayed thinning means that the quality of forest stand has already decreased due to the delay of the thinning.
The area of regeneration cuttings during the 10-year period preceding the inventory (1.3 M ha) is 190 000 ha less than in the previous inventory. The area of clear-cutting during the 10-year period preceding the inventory has decreased by 100 000 ha. The area of natural regeneration cuttings is 200 000 ha for the preceding 10-year period, while the area was 480 000 ha in NFI9 (Tomppo et al. 2011). The long-lasting decline in natural regeneration has also reduced the cuttings to remove the over-story trees by more than 50 000 ha in the same period.
Special fellings, where the amount of harvested wood is usually quite small (these include salvage cuttings, cuttings for roads or ditches, or removal of single over-storey trees) have been carried out on 320 000 ha during the 10-year period preceding the inventory. Nurse crop cutting (for natural regeneration of Norway spruce) was observed on 9000 ha.
Selection cuttings related to uneven-aged forest management were observed only on 12 000 ha even though the Forest Act has accepted uneven-aged foreste management since 2014. Small gap fellings related to uneven-aged forest management were not observed at all. In the previous inventory it was reported 17 000 ha of selective cuttings, allowed only for specific reasons in the Forest Act of those days, and 24 000 ha of thinnings from above (Korhonen et al. 2017).
Since 2014 the Forest Act has accepted removal of growing stock in underproductive drained peatlands without the obligation to regenerate. These cuttings were observed only on 7000 ha in current NFI12, almost all of which on poorly productive forest (Suppl. file S2: Table 32c).
Cuttings were recorded for 56 000 ha of productive forest not available for wood supply over a 10-year period, which is 3% of the productive forest not available for wood supply (Suppl. file S2: Table 32b). 30 000 ha of cuttings were recorded on poorly productive forest, which is 1.2% of the area of poorly productive foreset land area (Suppl. file S2: Table 32c).
Of the thinnings carried out during the last five years preceding the field measurement, 82% were carried out in accordance with the forest management guidelines – 85% of first thinnings and 77% of other thinnings. The proportion of too heavy thinnings is 13% of the total thinning area and the proportion of thinnings where the remaining growing stock is unrecoverable is 0.3%. Root or stem damages were found on less than one percent of the thinning area. 4% of the thinnings are too slightly thinned.
For each NFI plot stand the future management measures are proposed in the field following the principles of forest management guidelines (Äijälä et al. 2014). Only stand level data are considered in these proposals. Neither the preferences of the forest owner nor the national or regional sustained yield are considered in these proposals. The proposed cuttings for the next 10-year period and the timing of the next cuttings are presented in Suppl. file S2 table 33.
The area of proposed cuttings (including pre-commercial thinnings) for the next 10 years is 12.0 M ha, which is 65% of the productive forest available for wood supply. These estimates of proposed cuttings are based on the management proposals made in the field, meaning that only the stand level data are considered in the proposal. The area of proposed cuttings is the same as in the previous inventory (Korhonen et al. 2017). Thinnings have been proposed for larger area than in the previous inventory. There are fewer proposals for removal of over-story trees, natural regeneration cutting and pre-commercial thinning.
There are 3.3 M ha of forests where the cutting is late at the time of the field measurement. This is 28% of the total area of proposed cuttings for the coming 10-year perio and 72 000 ha more than in the previous inventory (Korhonen et al. 2017). 770 000 ha of pre-commercial thinnings are overdue (Fig. 26). First thinnings are late on 920 000 ha.
By ownership groups, the proportion of overdue cuttings is the lowest in the forests owned by companies. The forests owned by companies have the largest proportion of thinning proposals – 59% of the cutting proposals – and the smallest proportion of regeneration cutting proposals – 17% of the proposals (Suppl. file S2: Table 33).
32% of the productive forest area has no signs of cuttings or the most recent cutting has been more than 30 years before the field measurement (Suppl. file S2: Table 34a). On productive forest available for wood supply the proportion is 27% (5 M ha) (Suppl. file S2: Table 34b). 96% of the total area of poorly productive forest has been outside harvesting activities for the last 30 years (Suppl. file S2: Table 34c). Almost half of the poorly productive forest is not available for wood supply. 94% of the total area of poorly productive forest available for wood supply has been outside harvesting activities for the last 30 years.
3.8.4 Other accomplished and proposed forest management measures
20 000 ha of supplementary planting were observed, most of which were on previously cultivated and the rest on naturally regenerated seedling stands (Suppl. file S2: Table 35). The area of supplementary planting is probably under-estimated because after few years it can be difficult to observe the supplementary planting. 73 000 ha of pruning were observed. Harvesting of cutting residues for energy wood was observed on 130 000 ha. Restoration measures (other than filling of ditches on peatlands) to increase diversity were observed on less than 1000 ha, all on forest not available for wood supply.
Supplementary planting was proposed for 24 000 ha. The need for both cultivation and supplementary planting is smaller than in the previous inventory (Korhonen et al. 2017).
3.8.5 Accomplished and proposed soil preparation
In the 10-year period preceding the inventory, soil preparations have been accomplished on 1.2 M ha (Suppl. file S2: Table 37). This is 160 000 ha less than observed in the previous inventory, but the reduction is smaller than the reduction in the area of regeneration fellings in the 10-year period preceding the inventory. Light soil preparation methods, i.e. scarification and harrowing, accounts for 53% of all soil preparations. Mounding accounts for almost 40% of all soil preparations. The area of regeneration sites with immediate need for soil preparation was 350 000 ha (Suppl. file S2: Table 38), which is 40 000 ha less than in the previous inventory.
The estimated area of soil preparations in the 10-year period preceding the fiel inventory matches well the official statistics on forest management operations, that are based on data collected from the Forest Owners Associations, forest industry, Metsähallitus and private companies in the business of forest management (Official Statistics of Finland: silvicultural and forest improvement work 2020).
3.8.6 Drainage status and need for drainage
Drainage operations are recorded for each NFI plot on productive, poorly productive forest and unproductive land no matter the time of the operation. In addition to the drainage opeations related to forestry, also the drainage operations that are not related to forestry but have affected the water balance are recorded in the field work.
Different forestry related drainage operations had been accomplished on 730 000 ha in the 10-year period preceding the inventory, of which 80% were on peatlands and the rest on mineral soils (Fig. 27, Suppl. file S2: Table 39a). Drainage operations observed on peatlands total to 580 000 ha, of which the majority were clearing of ditches and supplementary ditching. New draining on previously undrained peatland (stand) was observed on 46 000 ha in the preceding 10-year period. Compared to the previous inventory, the area of clearing of ditches has decreased by 100 000 ha (Korhonen et al. 2017).
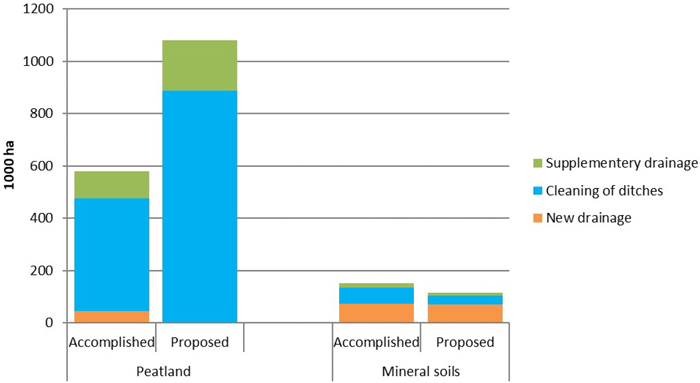
Fig. 27. Accomplished drainage operations in the 10-year period before the measurement and proposed drainage operations for the coming 10-year period according to NFI12 in Finland.
According to the official statistics (Official Statistics of Finland: silvicultural and forest improvement work 2020) the area of ditch network maintenance operations has been on average 58 000 ha per year for the years 2004–2018. The NFI result is slightly higher, which can be explained by the fact that the official statistics cover only those operations that are supported by public funds.
In the 10-year period, there had been drainage operations on a total of about 150 000 ha of mineral soils, more than half of this area was clearing of existing ditches or supplementary ditching and the rest was new drainage on previously undrained mineral soil stand (Fig. 27; Suppl. file S2: Table 39a).
Drainage operations not related to forestry are recorded in NFI if they affect the increment of the growing stock or the drainage covers the entire stand. In the 10-year period preceding the inventory, drainage operations not related to forestry were observed on 25 000 ha (Suppl. file S2: Table 39b). There are more than 500 000 ha of forestry land drained by ditching that is older than 10 years and related to forestry, more than half of which is on peatlands. The restoration of the peatland, i.e. measures to restore the peatland to its natural condition by blocking the ditches, was observed 14 000 ha during the preceding 10-year period and totally on 22 000 ha.
Clearing of ditches or supplementary drainage was proposed for 1.1 M ha of drained peatlands, i.e. 24% of the drained peatland area on productive forest available for wood supply (Fig. 27; Suppl. file S2: Table 40). This is 40 000 ha less than in the previous inventory (Korhonen et al. 2017), but the area of proposed drainage operations is still double compared to the area of accomplished ditch network maintenance operatoins during the preceding 10-year period.
Draining of previously undrained peatland is not proposed in the NFI field work. Undrained mineral soils with peatland characteristics (paludified mineral soils) were found on 220 000 ha in forest available for wood supply. New drainage was proposed for 70 000 ha of this area (Fig. 30; Suppl. file S2: Table 40). The area of proposed new drainage for mineral soils is slightly lower than in the area of new drainage accomplished in the 10-year period preceding the inventory, and less than half of the area of proposals in the previous inventory (Korhonen et al. 2017). The need for clearing of ditches or complementary drainage was observed on 45 000 ha of drained mineral soils, which is also less than in the previous inventory and only more than half of the clearing of ditches and complementary drainage carried out on mineral soils the 10-year period preceding the inventory.
3.9 Biodiversity
3.9.1 Amount and quality of dead wood
On average, the volume of dead wood is 5.7 m3 ha–1 on the combined productive and poorly productive forest. On productive forest the average is 5.8 m3 ha–1 (Suppl. file S2: Table 44; Fig. 28). The amount of standing dead wood is 1.6 m3 ha–1 (appr. 30% of dead wood total) and the amount of lying dead wood 4 m3 ha–1. In North Finland the mean volume of dead wood on productive forest is 7.5 m3 ha–1 and in South Finland 4.4 m3 ha–1. Appr. half of the dead wood volume consists of Scots pine, one quarter of Norway spruce and 15% of broadleaf tree species. The remaining proportion is unidentified soft dead wood.
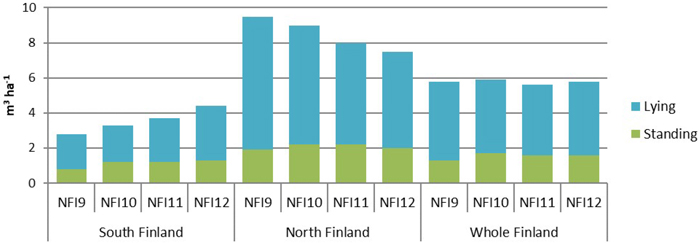
Fig. 28. Mean volume of lying and standing dead wood in productive forests according to NFI9–NFI12 in Finland.
On productive forest available for wood supply the mean volume of dead wood is 4.3 m3 ha–1 and in protected forests 19.9 m3 ha–1 (Figs. 29 and 30; Suppl. file S2: Tables 44b and 48c). Productive forests on mineral soils have markedly higher mean volume of dead wood (6.5 m3 ha–1) than productive forests on peatlands (3.5 m3 ha–1) (Suppl. file S2: Tables 45a and 45b) even though there is no significant difference in the mean volume of living growing stock. The proportion of large-sized (diameter more than 30 cm) dead wood is 19% of the total volume of dead wood (Suppl. file S2: Table 46).
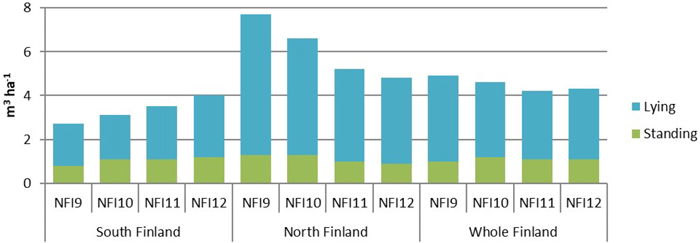
Fig. 29. Mean volume of lying and standing dead wood in productive forests available for wood supply according to NFI9–NFI12 in Finland.
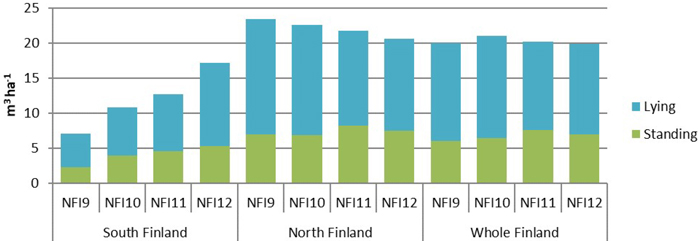
Fig. 30. Mean volume of lying and standing dead wood in protected forests according to NFI9–NFI12 in Finland.
Most of the standing dead wood, 1.2 m3 ha–1 out of the 1.6 m3 ha–1 on productive forest, is hard dead wood. The amount of fairly hard standing dead wood is 0.3 m3 ha–1 and the amount of softer standing dead wood is only 0.1 m3 ha–1. For lying dead wood the distribution by decay class is more even, 0.7–0.9 m3 ha–1 in each of the five decay classes.
The mean volume of dead wood in the whole country has remained at the same level, 5.7–5.9 m3 ha–1, since NFI9 (Fig. 28, Tomppo et al 2011; Korhonen et al. 2013, 2017) but there are remarkable differences in the trends between South and North Finland. In South Finland the mean volume of dead wood on productive forest has increased from the 2.8 m3 ha–1 in NFI9 to the current 4.4 m3 ha–1. In North Finland the mean volume has on the contrary decreased from the 9.5 m3 ha–1 in NFI9 to the current 7.5 m3 ha–1. In North Finland the amount of dead wood has decreased both in protected forests and in forests available for wood supply. Mainly the lying dead wood component has decreased. In South Finland the amount of dead wood has increased both in protected forests and in forests available for wood supply (Figs. 29 and 30).
Most of the lying dead wood consists of fallen or broken trees (Suppl. file S2: Tables 47a and 47b). About 16% of the lying dead wood (larger than 10 cm in diameter) consists of cutting residues.
The amount of dead wood varies by devepment class (Suppl. file S2: Table 49). In seedlings stands on productive forest available for wood supply the mean volume of dead wood is 4.4 m3 ha–1, in thinning stands 3.3 and in mature stands 9.7 m3 ha–1. On regeneration sites the mean volume is 5.1 m3 ha–1.
Measurement of all dead wood was in introduced in NFI9 but hard dead wood that is still usable for at least as fuel wood has been measured in NFIs since NFI2 (Ihalainen and Mäkelä 2009). The hard dead wood has been measured in NFIs with the same plot configuration as the living trees. The amount of hrd dead wood is 3.1 m3 ha–1 on productive forest (Suppl. file S2: Table 50a) while in NFI11 the mean volume was 2.6 m3 ha–1 (Korhonen et al. 2017). At the end of 1930s the mean volume of hard dead wood was 1.9 m3 ha–1 (Ilvessalo 1942) and in the early 1950s 1.8 m3 ha–1 (Ilvessalo 1956). In the 1980s the mean volume was only 1.5 m3 ha–1 (Tomppo et al 2001).
3.9.2 Tree species abundance
Using the stand level registrations on proportions of conifer and broadleaf tree species, the amount of pure or almost pure coniferous or broadleaf forests is 54% of the productive forest (Suppl. file S2: Table 15). The proportion of mixed forests is 14%. In this classification, pure or almost pure coniferous (or broadleaf) forest is forest where the proportion of conifer (broadleaf) species in a conifer (broadleaf) dominated forest is more than 95% of the growing stock. Mixed forests are forests where the proportion of conifers in a conifer dominated forest (or proportion of broadleaf species in a broadleaf dominated forest) is less than 75%.
In NFI12 the species composition is estimated at stand level using recordings for tree strata. Each tree story and each species (in some cases group of species) form a tree stratum. Mean values (like mean height, diameter and age) and total values (basal area for advanced development classes and number of stems for seedling stands) are recorded for each tree stratum. According to the stand level data by tree strata, 28% of productive forest are single species stands (Suppl. file S2: Table 16a). Proportion of forests with at maximum three tree species is 92% of the productive forest. The largest number of tree species for a stand was 8 species. These results are influenced by the fact that in some cases single tree species are grouped in species groups in the stand level data. Tree species with basal area less than 1 m2 ha–1 or 5% of the total basal area can be merged with other species. Further, merging of species is allowed if the number of tree strata in one tree story would exceed four.
3.9.3 Naturalness
NFI12 the naturalness of a forest stand was described using three variables: naturalness of the structure of growing stock, naturalness of the dead wood component and signs of human activities. For each of these variables there were three descriptive classes: natural or almost natural, somewhat modified, clearly modified.
The area of productive forest with natural or almost natural structure of growing stock is 870 000 ha (Suppl. file S2: Table 51a). Out of this, only 62 000 ha are in South Finland. On the productive forest available for wood supply the area of forest with natural or almost natural structure of growing stock is 137 000 ha, out of these 33 000 ha are in South Finland. According to NFI11 the area of productive forest with natural or almost natural structure of growing stock was 990 000 ha (Korhonen et al. 2017).
The area of productive forest with natural or almost natural dead wood component is 480 000 ha, out of these 47 000 ha are in South Finland. On the productive forest available for wood supply the area of forest with natural or almost natural dead wood component is 85 000 ha, out of these 26 000 ha are in South Finland. According to NFI11 the area of productive forest with natural or almost natural dead wood component was 700 000 ha (Korhonen et al. 2017).
Area of productive forest with no or minor signs of human activities is 970 000 ha, out of these 96 000 ha are in South Finland. This includes forests where there are no signs of cuttings, drainage operations or other human activities excluding selective cuttings of few trees in the past. On productive forest available for wood supply the estimate is 173 000 ha, out of these 55 000 ha are in South Finland. In NFI11 950 000 ha of productive forest were classified as forest with no or minor signs of human activities.
Area of productive forest where all the three naturalness criteria are met is 380 000 ha, out of these 42 000 ha are on productive forest available for wood supply and 338 000 ha in protected forests. In NFI11 the estimate was 517 000 ha with 91 000 ha on productive forest for wood supply. It seems that the area of natural or almost natural forests has markedly decreased, but this is mainly due to differences in the subjective classification – in protected forests the area of natural or almost natural forests has decreased by 80 000 ha even though there had been no operations in these forests. Assessment of naturalness is highly subjective and there are no clear numeric thresholds for the different criteria.
3.10 Mortality and natural losses
The volume of annual mortality has been 7.0 M m3 between the NFI11 (2009–2013) and NFI12 (2014–2018) (Suppl.file S2: Table 52). 43% of this is Scots pine, 25% Norway spruce, and 32% broadleaf species. The mean annual mortality on productive and poorly productive forest is 0.3 m3 ha–1.
The annual harvested volume of natural mortality has been 850 000 m3. For Scots pine the proportion of harvested mortality of the total mortality of Scots pines is 13%, for Norway spruce 23% and for broadleaf species only 3%.
The annual natural losses (total mortality minus harvested mortality) have been 6.1 M m3. The proportion of Scots pine from the total natural losses is 43%, Norway spruce 22% and broadleaf species 35%.
The mortality and natural losses were measured for the first time in NFI8 using the permanent plots established in 1985–1986 and remeasured in 1990 and 1995–1996 (Ihalainen 2013). With the NFI8 data the estimate of mortality was 2.8 M m3, which was markedly higher than the earlier estimates (1.2–1.3 M m3) based on separate studies (Ihalainen 2013). Since NFI8 the mortality has been estimated using the permanent plot established in NFI9 (1996–2003) and remeasured in the subsequent NFIs. With the NFI9/NFI10 data the estimates of mortality and natural losses were 5.3 M m3 and 4.7 M m3, respectively (Ihalainen 2013). With the NFI10 and NFI11 (2009–2013) data the estimates were 6.5 M m3 and 5.6 M m3, respectively (Korhonen et al. 2017). (Fig. 31).
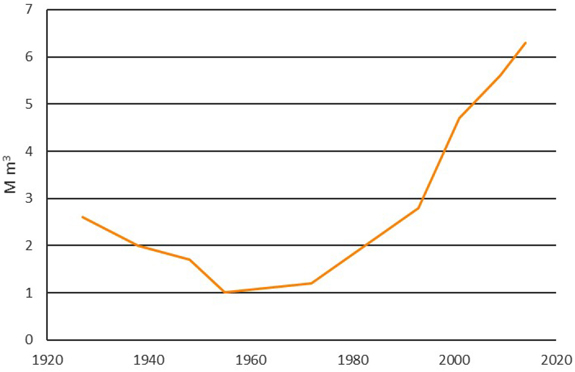
Fig. 31. Estimates of annual natural losses (M m3) 1920–2016 in Finland. Till 1970s the estimates are excluding bark.
The volume of annually harvested mortality is about the same as estimated with the NFI10 and NFI11 data. Thus, the volume of natural losses has increased by the same amount as the mortality, i.e. by 0.5 M m3.
The estimate of mortality is probably an underestimate because the estimate does not include all those trees that have both died and harvested between the two measurements. The field personnel try to separate these stumps as mortality trees but in reality it is extremely difficult to assess from the stump if the tree has been dead or alive at the time of felling. For estimating the total drain this is not a problem because these trees are included in the cuttings and thus included in the total drain.
4 Discussion
This publication describes the state of Finland’s forests according to the NFI12 (2014–2018) data and development of som key parameters since 1920s. The area of forestry land (consisting of productive and poorly productive forest, unproductive land, and other forestry land) is 26.2 M ha, which is 0.5 M ha less than the estimate in the 1920s for the current territory of Finland. The area of forestry land has decreased due to expansion of agriculture from the 1920s to 1960s and also due to increase in area of built-up land.
Even though the area of forestry land has decreased, the area of productive forest has increased. The current 20.3 M ha of productive forest is 1.6 M ha more than according to the NFI5 implemented at the end of the 1960s. The concept of productive forest has remained the same since NFI5. The increase of productive forest is mainly due to drainage of peatlands. The area of forest according to FAO definition is 22.4 M ha.
52% of the forestry land is owned by non-industrial private forest owners, 35% by government, 7% by forest companies, and 6% by communities (including municipalites, parishes, foundations etc.). For the productive forest the proportions are 60%, 26%, 9%, and 6%, respectively. The distribution of growing stock volume by ownership categories is very similar to the distribution of productive forest.
20% of the forestry land is not available for wood supply and 13% is only partly available for wood supply. Restrictions on the harvesting include the legally protected forests, forest protection programmes, restrictions decided by Metsähallitus in the commercial government forests and restrictions included in the regional land use plans. The municipal level land use plans were not available in digital form for checking the restrictions laid in these plans. 9% of the productive forest is not avaible for wood supply.
The area of peatlands is 8.8 M ha, which is one third of the forestry land. There are 4.9 M ha of productive peatland forests, which is 24% of the productive forest area. The area of drained peatlands is 4.7 which is 53% of the current area of peatlands. Recently drained peatlands on previously undrained peatland are rare and therefore the proportion of transformed mires where the undergrowth resembles the undergrowth on mineral soil forest types, totals to 71% of the current drained peatland area. The area of drained mineral soils is 1.3 M ha, which is 8% of the forests on mineral soils.
The volume of growing stock, 2500 M m3 is 1.7 times the volume observed in the NFI1 in the 1920s for the current territory of Finland. In the 1950s and 1960s cuttings and other land use than forestry slightly reduced the forest resources but since 1970s the volume has increased rapidly. Increase of productive forest due to drainage of peatlands, abandoning of selective cutting practices in the 1950s and forest improvement investments to reduce the area of under-productive forests have caused the increase in the total volume of growing stock. In recent decades, also the climate change has increased increment and thus also the total volume.
The annual increment of growing stock was on average 107.8 M m3 on the increment measurement period of 2009–2018. In this inventory, we used the permanent plot data for increment estimation. The mean annual increment was 5.2 m3 ha–1 on productive forest. The increment estimate has doubled since the estimate of NFI2 implemented in late 1930s. Increased increment is explained mainly by the same facts as the increase of volume but also the age structure is nowadays relatively favourable for high increment. According to NFI11 the annual increment was 105.5 M m3. Analyses of increment indices shows that in North Finland the environmental conditions were less favourable for tree growth in the NFI12 increment measurement period than in the NFI11 period. In South Finland the NFI12 period was less favourable for broadleaf trees, more favourable for Norway spruce and equally favourable for Scots pine as compared to the period of NFI11.
Serious or complete damage was observed on 2% of the productive forest available for wood supply. Damages that have at least some effect on the quality of forest stand was observed on 24% of the area. Among the identified damaging agents wind and snow were the most frequent. Notable (other than mild) damage caused by ungulate browsing was identified on 3% of productive forest available for wood supply and on 15% of Scots pine seedling stands.
The quality of forest stand is good or satisfactory on 76% of the productive forest available for wood supply. This is 3%-units more than according to the previous inventory. Among seedling stands, the proportion of good and satisfactory forests is 80%. The proportion of under-productive forests (adviced to be regenerated immediately) is 6% of the productive forest available for wood supply, which is 1%-unit less than according to the previous inventory and markedly lower than the proportion in previous inventories. Uneven structure of growing stock is the most common reason for decreased quality.
The silvicultural need for first thinnings for the next 10-year period is 70% more than the area of observed first thinnings for the 10-year period preceding the inventory. First thinnings are delayed on 920 000 ha, this is 100 000 ha more than according the previous inventory. Pre-commercial thinnings are delayed on 770 000 ha, which equals to the estimate in previous inventory.
The amount of dead wood is on average 5.8 m3 ha–1 on productive forest. In South Finland the amount of dead wood has increased since the NFI9 (1996–2001) from 2.8 m3 ha–1 to the current 4.4 m3 ha–1. In North Finland the amount of dead wood has decreased since NFI9 (2001–2003) from 9.5 m3 ha–1 to the current 7.5 m3 ha–1. In North Finland the amount of dead wood has decreased both in protected forests and forests available for wood supply.
The area of natural or almost natural forests on productive forest is 380 000 ha, out of this, 42 000 ha are in the forest available for wood supply and 340 000 ha in protected forests.
The annual mortality is estimated to 7 M m3, which is 0.5 M m3 more than according to the previous inventory. Volume of annually harvested mortality trees is 0.9 M m3. Thus, the volume of annual losses is 6.1 M m3.
Acknowledgements
The study was part of the NFI project of the Natural Resources Institute Finland (Luke). The immense field data have been collected by a number of field teams with following persons as the field team leaders: Pasi Aatsinki, Juuso Hämäläinen, Asko Harju, Reijo Hautajärvi, Jari Ilomäki, Outi Jokiranta, Kari Kautto, Olavi Kohal, Ari Kokko, Juhani Kumpuniemi, Veli-Matti Lähteenmäki, Jukka-Pekka Lappalainen, Jukka Lehtimäki, Ville Lumberg, Tauno Luosujärvi, Mika-Matti Mantere, Harri Mattila, Juha Metros, Hemmo Nikkonen, Petteri Parviainen, Jouni Peräsaari, Ville Pietilä, Hannu Rantanen, Erkki Salo, Rauno Salo, Maria Sirviö, Kati Tammela, Juha Vänninmaja, and Tapio Ylimartimo. Kati Tammela has measured the increment cores and maintained the inventory equipment together with the field team leaders. The manuscript has been revised by the Silva Fennica Subject Editor and reviewer unknown to the authors. The authors wish to thank all the above-mentioned.
Declaration of openness of research materials and data
The research materials and data are available for scientific research on request from the authors, excluding exact location of the plots. Access to the plot location data is limited to protect the monitoring system based on revisited permanent plots.
Authors contribution
Korhonen: planning of the manuscript, coordinating of writing, writing parts of the manuscript, finalizing the manuscript.
Ahola, Strandström: supervision and support of field data collection, processing of the field data, checking parts of the manusrcipt.
Heikkinen: analyses of sampling variances, writing of parts of the methodology section.
Henttonen: analyses of increment data, writing parts of the manuscript.
Hotanen, Melin: writing parts of the manuscript.
Ihalainen: calculation of the data tables, writing parts of the manuscript.
Pitkänen: processing of the field data, writing most of methodology section.
Räty: checking the manuscript.
Sirviö: translation to English, checking the manuscript.
References
Äijälä O, Koistinen A, Sved J, Vanhatalo K, Väisänen P (eds) (2014) Metsänhoidon suositukset. [Forest Management Guidelines]. Metsätalouden kehittämiskeskus Tapion julkaisuja.
Finnish Statistical Yearbook of Forestry 2004. ISBN 951-40-1946-6.
Henttonen HM, Nöjd P, Mäkinen H (2017) Environment-induced growth changes in the Finnish forests during 1971–2010 – an analysis based on National Forest Inventory. Forest Ecol Manag 386: 22–36. https://doi.org/10.1016/j.foreco.2016.11.044.
Hökkä H, Kaunisto S, Korhonen KT, Päivänen J, Reinikainen A, Tomppo E (2002) Suomen suometsät 1951–1994. [The peatland forests of Finland 1951–2004]. Metsätieteen aikakauskirja 2A/2002: 201–357. https://doi.org/10.14214/ma.6242.
Ihalainen A (2013) Metsähukkapuu ja luonnonpoistuma poistumatilastoissa. [Statistics on cutting residues and natural losses]. Metsätieteen aikakauskirja 3/2013: 609–623. https://doi.org/10.14214/ma.6026.
Ihalainen A, Mäkelä H (2009) Kuolleen puuston määrä ja laatu Etelä- ja Pohjois-Suomessa 2004–2007. [Volume and quality of dead wood in South and North Finland 2004–2007]. Metsätieteen aikakauskirja 1/2009: 35–56. https://doi.org/10.14214/ma.5834.
Ilvessalo Y (1924) Suomen metsät. Metsävarat ja metsien tila. The forest resources and the condition of the forests. Communicationes ex Instituto Quastionum Forestalium Finlandiae 9:1.
Ilvessalo Y (1927) Suomen metsät. Tulokset vuosina 1921–1924 suoritetusta valtakunnan metsien arvioimisesta. The Forests of Suomi (Finland). Results of the general survey of the forests of the country carried out during the years1921–1924. Communicationes ex Instituto Quastionum Forestalium Finlandiae 11.
Ilvessalo Y (1940) Suomen metsävarat vv. 1936–1938. [Finland’s forest resources 1936–1938]. Commun Inst For Fenn 28.6. http://urn.fi/URN:NBN:fi-metla-201207171060.
Ilvessalo Y (1942) Suomen metsävarat ja metsien tila. II valtakunnan metsien arviointi. The forest resources and the condition of the forests of Finland. Commun Inst For Fenn 30.1. http://urn.fi/URN:NBN:fi-metla-201207171062.
Ilvessalo Y (1947) Pystypuiden kuutioimistaulukot. Volume tables for standing trees. Commun Inst For Fenn 34: 1–149. http://urn.fi/URN:NBN:fi-metla-201207171066.
Ilvessalo Y (1948) The forests of present-day Finland. Commun Inst For Fenn 35.6. http://urn.fi/URN:NBN:fi-metla-201207171067.
Ilvessalo Y (1956) Suomen metsät vuosista 1921–24 vuosiin 1951–53. Kolmeen valtakunnan metsien inventointiin perustuva tutkimus. The forests of Finland from 1921–24 to 1951–53. Commun Inst For Fenn 47.1. http://urn.fi/URN:NBN:fi-metla-201207171079.
Kniivilä M, Hantula J, Hotanen J-P, Hynynen J, Hänninen H, Korhonen KT, Leppänen J, Melin M, Mutanen A, Määttä K, Siitonen J, Viiri H, Viitala E-J, Viitanen J (2020) Metsälain ja metsätuholain muutosten arviointi. [Effects of the changes in the Forest Act and Forest Damage Act]. Natural Resources Institute Finland Research Paper 3/2020. http://urn.fi/URN:ISBN:978-952-326-897-5.
Korhonen KT, Ihalainen A, Viiri H, Heikkinen J, Hotanen J-P, Mäkelä H, Nevalainen S, Pitkänen J (2013) Suomen metsät 2004–2008 ja niiden kehitys 1921–2008. [Forests of Finland 2004–2008 and their development in 1921–2008]. Metsätieteen aikakauskirja 3/2013: 269–608. https://doi.org/10.14214/ma.6025.
Korhonen KT, Ihalainen A, Ahola A, Heikkinen J, Henttonen HM, Hotanen J-P, Nevalainen S, Pitkänen J, Strandström M, Viiri H (2017) Suomen metsät 2009–2013 ja niiden kehitys 1921–2013. [Forests of Finland 2008–2013 and their development in 1921–2013]. Luonnonvara- ja biotalouden tutkimus 59/2017. http://urn.fi/URN:ISBN:978-952-326-467-0.
Korhonen KT, Ihalainen A, Kuusela S, Punttila P, Salminen O, Syrjänen K (2020) Metsien monimuotoisuudelle merkittävien rakennepiirteiden muutokset Suomessa vuosina 1980–2015. [Development of forest biodiversity indicators in Finland 1980–2015]. Metsätieteen aikakauskirja, article id 10198. https://doi.org/10.14214/ma.10198.
Kuusela K (1973) Suomen metsävarat ja niiden omistus 1964–70 sekä niiden kehittyminen 1920–70. Forest resources and ownership in Finland 1964–70 and their development 1920–1972. Commun Inst For Fenn 76.5. http://urn.fi/URN:NBN:fi-metla-201207171108.
Kuusela K (1978) Suomen metsävarat ja metsien omistus 1971–1976. Forest resources and ownership in Finland 1971–1976. Commun Inst For Fenn 93.6: 1–2. http://urn.fi/URN:ISBN:951-40-0396-9.
Kuusela K, Salminen S (1991) Suomen metsävarat 1977–1984 ja niiden kehittyminen 1952–1980. Forest resources of Finland 1977–1984 and their development in 1952–1980. Acta For Fenn 220. https://doi.org/10.14214/aff.7666.
Laasasenaho J (1982) Taper curve and volume functions for pine, spruce and birch. Commun Inst For Fenn 108. http://urn.fi/URN:ISBN:951-40-0589-9.
Official Statistics of Finland: total roundwood removals and drain. Natural Resources Institute Finland. https://stat.luke.fi/en/roundwood-removals-and-drain. Accessed 1 December 2020.
Official Statistics of Finland: silvicultural and forest improvement work. Natural Resources Institute Finland. http://stat.luke.fi/en/silvicultural-and-forest-improvement-work. Accessed 1 December 2020.
Repola J (2008) Biomass equations for birch in Finland. Silva Fenn 42: 605–624. https://doi.org/10.14214/sf.236.
Repola J (2009) Biomass equations for Scots pine and Norway spruce in Finland. Silva Fenn 43: 625–647. https://doi.org/10.14214/sf.184.
Repola J, Ojansuu R, Kukkola M (2007) Biomass functions for Scots pine, Norway spruce and birch in Finland. Working Papers of the Finnish Forest Research Institute 53. http://urn.fi/URN:ISBN:978-951-40-2046-9.
Sarasto J (1961) Über die Klassifizierung der für Walderziehung entwässerten Moore. [About the classification drained peatlands]. Acta For Fenn 74: 1–47. https://doi.org/10.14214/aff.7132.
Suomen pinta-ala kunnittain 1.1.2014 (2014). [Land area of Finland by municipalities 1.1.2014]. https://www.maanmittauslaitos.fi/sites/maanmittauslaitos.fi/files/old/alat_2014.pdf. Accessed 1 December 2020.
Suomen pinta-ala kunnittain 1.1.2019 (2019). [Land area of Finland by municipalities 1.1.2019]. https://www.maanmittauslaitos.fi/sites/maanmittauslaitos.fi/files/attachments/2019/01/Suomen_pa_2019_kunta_maakunta.pdf. Accessed 1 December 2020.
Tiihonen P (1968) IV valtakunnan metsien inventointi. 4. Suomen metsävarat vuosina 1960–63. [Fourth National Forest Inventory. Forest resources of Finland 1960–63]. Commun Inst For Fenn 66.3. http://urn.fi/URN:NBN:fi-metla-201207171098.
Tomppo E (2000) Kasvupaikat ja puusto. [Site types and growing stock]. In: Reinikainen A, Mäkipää R, Vanha-Majamaa I, Hotanen J-P (eds) Vegetation in changing forest ecosystems]. Tammi, Helsinki, pp 60–83. ISBN 951-31-1963-7.
Tomppo E, Henttonen H, Tuomainen T (2001) Valtakunnan metsien 8. inventoinnin menetelmä ja tulokset metsäkeskuksittain Pohjois-Suomessa 1992–94 sekä tulokset Etelä-Suomessa 1986–92 ja koko maassa 1986–94. [The method and results in the 8th national forest inventory of Finland by regions in North Finland 1992–94 and the results for South Finland 1986–92 and for the whole country 1986–94]. Metsätieteen aikakauskirja 1B/2001: 99–248. https://doi.org/10.14214/ma.6434.
Tomppo E, Heikkinen J, Henttonen HM, Ihalainen A, Katila M, Mäkelä H, Tuomainen T, Vainikainen N (2011) Designing and conducting a forest inventory – case: 9th National Forest Inventory of Finland. Manag For Ecosyst 22. https://doi.org/10.1007/978-94-007-1652-0.
Valtakunnan metsien 12. inventointi (NFI12) (2018). Maastotyön ohjeet 2018. Koko Suomi ml. Ahvenanmaa. [12th National Forest Inventory of Finland. Field manual 2018, including the Åland region]. Natural Resources Institute Finland.
Total of 34 references.
