Ana Aza  ,
A. Maarit I. Kallio,
Timo Pukkala,
Ari Hietala,
Terje Gobakken,
Rasmus Astrup
,
A. Maarit I. Kallio,
Timo Pukkala,
Ari Hietala,
Terje Gobakken,
Rasmus Astrup
Species selection in areas subjected to risk of root and butt rot: applying Precision forestry in Norway
Aza A., Kallio A. M. I., Pukkala T., Hietala A., Gobakken T., Astrup R. (2022). Species selection in areas subjected to risk of root and butt rot: applying Precision forestry in Norway. Silva Fennica vol. 56 no. 3 article id 10732. https://doi.org/10.14214/sf.10732
Highlights
- We present the best species to plant on previously spruce-dominated sites with different site indexes and rot levels
- We recommend planting Norway spruce on low-rot sites, Scots pine on higher-rot sites, and allowing natural regeneration on low site indexes
- We demonstrate the Precision forestry method for determining the optimal tree species in heterogenous stands
- In the case study, the method increased net present value by approximately 6% on average.
Abstract
Norway’s most common tree species, Picea abies (L.) Karst. (Norway spruce), is often infected with Heterobasidion parviporum Niemelä & Korhonen and Heterobasidion annosum (Fr.) Bref.. Because Pinus sylvestris L. (Scots pine) is less susceptible to rot, it is worth considering if converting rot-infested spruce stands to pine improves economic performance. We examined the economically optimal choice between planting Norway spruce and Scots pine for previously spruce-dominated clear-cut sites of different site indexes with initial rot levels varying from 0% to 100% of stumps on the site. While it is optimal to continue to plant Norway spruce in regions with low rot levels, shifting to Scots pine pays off when rot levels get higher. The threshold rot level for changing from Norway spruce to Scots pine increases with the site index. We present a case study demonstrating a practical method (“Precision forestry”) for determining the tree species in a stand at the pixel level when the stand is heterogeneous both in site indexes and rot levels. This method is consistent with the concept of Precision forestry, which aims to plan and execute site-specific forest management activities to improve the quality of wood products while minimising waste, increasing profits, and maintaining environmental quality. The material for the study includes data on rot levels and site indexes in 71 clear-cut stands. Compared to planting the entire stand with a single species, pixel-level optimised species selection increases the net present value in almost every stand, with average increase of approximately 6%.
Keywords
Norway spruce;
Scots pine;
growth modelling;
precision forestry;
root and butt rot severity;
tree species selection
-
Aza,
Norwegian University of Life Sciences, Department of Ecology and Natural Resource Management, PO Box 5003, NO-1432, Ås, Norway
 https://orcid.org/0000-0002-6416-6697
E-mail
anfe@nmbu.no
https://orcid.org/0000-0002-6416-6697
E-mail
anfe@nmbu.no
- Kallio, Norwegian University of Life Sciences, Department of Ecology and Natural Resource Management, PO Box 5003, NO-1432, Ås, Norway E-mail maarit.kallio@nmbu.no
- Pukkala, University of Eastern Finland, P.O. Box 111, FI-80101 Joensuu, Finland E-mail timo.pukkala@uef.fi
- Hietala, Norwegian Institute of Bioeconomy Research, PO Box 115, NO-1431 Ås, Norway E-mail ari.hietala@nibio.no
- Gobakken, Norwegian University of Life Sciences, Department of Ecology and Natural Resource Management, PO Box 5003, NO-1432, Ås, Norway E-mail terje.gobakken@nmbu.no
- Astrup, Norwegian Institute of Bioeconomy Research, PO Box 115, NO-1431 Ås, Norway E-mail rasmus.astrup@nibio.no
Received 28 March 2022 Accepted 8 September 2022 Published 13 September 2022
Views 39129
Available at https://doi.org/10.14214/sf.10732 | Download PDF

Supplementary Files
1 Introduction
Root and Butt Rot (RBR) is the disease causing most economic loss in Fennoscandian forests, where it mainly affects the main coniferous tree species Norway spruce (Picea abies (L.) Karst.) and Scots pine (Pinus sylvestris L.), which we shall refer in this article simply as spruce and pine respectively. It is caused mainly by the pathogenic white-rot fungi Heterobasidion parviporum Niemelä & Korhonen and Heterobasidion annosum (Fr.) Bref. (Woodward et al. 1998; Pukkala et al. 2005). Spruce and pine have different degrees of resistance against Heterobasidion spp. In the heartwood of spruce, the decay caused by these two fungi can reach a height of 10–12 meters in the stem (Stenlid and Wästerlund 1986). It destroys the most valuable part of the tree, downgrading it from sawn wood quality to pulp or energy wood, depending on the decay extension (Pukkala et al. 2005; Seifert 2007). In pine, the decay associated with Heterobasidion annosum is typically limited to the root system, but small patches of decay may occasionally rise a few decimetres above the root collar (Laine 1976). In Norway, spruce is the dominant tree species, and roughly one out of five spruce trees harvested at the end of the rotation time show Heterobasidion-associated rot to some degree (Huse et al. 1994). While the knowledge of the distribution of Heterobasidion annosum in Norway is limited this species is considered to be present in pine forests primarily in the southern and western parts of the country (Korhonen et al. 1998).
Measures to control and diminish the damage caused by the RBR include stump treatment, growing species mixtures, avoiding cuttings during the high-risk season, avoiding thinning, and change of tree species (Piri et al. 1990; Huse et al. 1994; Korhonen et al. 1998; Pratt et al. 1998; Thor et al. 2006; Möykkynen and Pukkala 2010; Honkaniemi et al. 2019). In this article, we will focus on the species selection for the reestablishment of stands with variable degrees of rot infections in an even-aged management regime. The site’s productivity for alternative tree species plays an important role, often expressed in site index (SI). SI consists of a species’ dominating height at a specific index age (Tveite 1977; Hägglund and Lundmark 1981). In Fennoscandia, pine performs well on poor sites, whereas spruce tends to grow better in richer sites (Bielak et al. 2014; Bielak et al. 2015; Holmström et al. 2018). On intermediate productive sites, the species selection is less straightforward (Holmström et al. 2018).
Studies addressing species selection under the presence of rot in the Fennoscandian region suggest that mixed-species stands of susceptible and non-susceptible species perform better economically than pure stands of susceptible species under the presence of RBR. Mixed stands provide wider spacing between susceptible individuals than pure stands, which reduces the root contacts between trees and thus inhibits the mycelial spread of the fungus (Lindén and Vollbrecht 2002). Möykkynen and Pukkala (2010) obtained higher LEV (Land Expectation Value) with a 25–50% mixture of Scots pine in Norway spruce stands in Southern Finland, where Heterobasidion coll.
-colonised stumps were present (20% and 40% of stumps) compared to pure spruce stands in the same area. The previous studies, however, do not use the information on the actual occurrence of RBR on the harvested site. Following the clear-cut, the disease spreads through root contacts between the following generation plants and infected stumps of the previous tree generation (Redfern and Stenlid 1998; Stenlid and Redfern 1998). Given this dynamic, knowledge of the location of the infested areas in the stand and the magnitude of the infection in these locations should be valuable for the forest owner to assess if a shift from spruce to pine would pay off in the infested locations. Harvesting machines can collect such information, though gathering and processing information comes with an extra cost.
Precision forestry consists of planning and executing site-specific forest management activities and operations to improve the quality and consumption of wood products, minimise waste, increase revenues, and maintain the quality of the environment (Taylor et al. 2002). Precision forestry employs high-technology sensing and analytical tools to aid decision-making at specific sites and locations (Ziesak 2006). Although the concept of Precision forestry has existed for over two decades, its use has only been partially implemented in practice. Forest management in the presence of rot infection provides a case where Precision forestry may provide significant benefits for the forest owner. The amount of site-specific information generated from emerging and existing technologies in forestry is rapidly increasing. However, data from different sources are generally not combined, systemised, analysed, and applied for improving site-specific management. For example, forest harvesters are high-tech machines that, in addition to capturing detailed information on single tree dimensions, include functionality for the operator to record data on each stem, including the volume cut to waste due to defects such as RBR (Thor et al. 2006). Modern harvesters are equipped with global navigation satellite system (GNSS) receivers, associating stem data with an approximate machine position. The fundamental idea of our analysis is that the information collected by harvesters (rot levels) combined with information about SI can serve as the foundation for developing a Precision forestry framework aimed at location-specific management, where different parts of stands receive an optimised regeneration strategy based on SI and rot levels.
The hypothesis behind the presented study is that the Precision forestry approach, where information and rot infection rates and productivity is collected automatically from forest harvesters, and the regeneration strategy is subsequently optimised at a sub-stand scale, will provide the forest owner with a higher economic return than single-species management. To test our hypothesis, we first investigate the economically optimal choice of tree species for planting previously spruce-dominated clear-cut stands in Norway, considering the level of RBR detected on the harvested site. The critical question is whether and under which conditions (SI and detected frequency of rot) planting pine instead of spruce is economically favourable. We also investigate the potential of the Precision forestry approach where each 250 m2 pixel within a stand receives an optimised planting treatment, given site productivity and rot infestation levels, compared to selecting the same species for the entire stand. We conducted the study in a unique dataset with harvester registered rot presence from the harvest sites in Central and Eastern Norway.
2 Material and methods
2.1 Method and data for projecting the stand development given the initial RBR level
We used the RotStand model (Pukkala et al. 2005) to simulate the stand development for the two main tree species of economic interest in Norway (spruce and pine), given the level of RBR infection on the previously spruce-dominated site. RotStand projects the spread of RBR in the trees and the volumes of rotten and healthy roundwood in the next rotation over time. RotStand consists of two sub-models, one for simulating Heterobasidion spp. dynamics and the other one for simulating the stand dynamics. The sub-models interact, so that management of the stand affects the spread of Heterobasidion spp., which affects the stand development, as explained by Möykkynen and Pukkala (2009).
2.1.1 RBR dynamics submodel
Pukkala et al. (2005) describe RotStand in detail for Fennoscandian spruce stands. The dynamics and impacts of decay are different for pine. Pine is susceptible basically to Heterobasidion annosum s.str (P-type), a species considered to be primarily present in the pine forests in southern and western Norway. In older literature, there was no distinction between Heterobasidion annosum s.str and Heterobasidion parviporum. All species used to be referred to as Heterobasidion annosum. In this study, when using Heterobasidion annosum, we refer specifically to s.str (sensu stricto). Spruce is susceptible to both Heterobasidion annosum and Heterobasidion parviporum (S-type), the latter being present throughout most of the distribution area of spruce in the Nordic countries (Korhonen 1978; Korhonen and Piri 1994; Lindén and Vollbrecht 2002). Prior RotStand simulations in Heterobasidion-affected spruce stands have set the relative incidence of Heterobasidion parviporum to either 100% (Oliva and Stenlid 2011; Wang et al. 2015), 95% (Möykkynen and Pukkala 2011) or 90% (Pukkala et al. 2005). That reflects the understanding that Heterobasidion parviporum is predominant over Heterobasidion annosum in spruce forests in the Nordic countries (Korhonen et al. 1998). For the present study, we used the assumed incidence of 95% for Heterobasidion parviporum and that of 5% for Heterobasidion annosum. We set the 5-year probability of pathogen transfer from an infected stump to a tree of the same or a different tree species. Supplementary file S1 contains a list of all the specific parameters considered in the simulation.
As a reference area for the RotStand simulations, we considered a typical clear-cut stand, where there had been 900 stems per hectare (90% spruce and 10% pine) with a 30 cm mean stump diameter. If RBR infected the stand, we assumed the disease to have been in the trees of the clear-cut stand on average for 20 years before clear-cut. Harvest was assumed to have taken place during spring and applying stump treatment. Stump treatment is one of the recently proposed forestry-related measures for climate change mitigation by the Norwegian government (Klima- og miljødepartementet 2021). We simulated the future stand developments in the cases where the share of RBR-infested stums of the total amount of stumps on the clear-felled site varied from 0% to 100%, calculated in 5% intervals. We will refer to these percentages as rot levels. Besides the information referring to the previous rotation, the rot dynamics sub-model considers geographical factors in determining how rot will develop in the new forest rotation. The site was assumed to have an altitude of 275 metres above sea level (m. a.s.l) and a growing season temperature sum of 1240 degree days (d.d.).
As a result of the simulations, the RotStand reports, at five-year intervals, proportions of living trees having rot and proportions of trees killed by rot across stand ages of 30 to 100 years. As there is a stochastic element in the model, we simulated each rot level ten times, varying the location of old stumps and trees. We calculated the mean values for the reported variables, using them in the further analyses of this study.
2.1.2 Stand dynamics submodel
In RotStand, the single-tree models of Bollandsås et al. (2008) and Bollandsås (2007) are used to calculate the diameter increments of trees and mortality. The models of Pukkala and Miina (1997) are used to calculate tree heights. The taper models of Pukkala et al. (2019) and the models of Laasasenaho (1982) are used for calculating volumes of timber assortments for spruce and pine, respectively. The RotStand assumes the stem rot column to have a cone shape in spruce (Tamminen 1985), determined by rot height and stump diameter. Starting from the bottom, Rotstand considers the lowest part of the stem as butt waste until the radius of the healthy outer layer is at least 5 cm. The next part upwards is decayed pulpwood, which ends when the decay column ends. The healthy part of the stem may have sawlog and pulpwood depending on the minimum diameter and length requirements specified by the user for each tree species.
We used RotStand to simulate 100 m × 100 m rectangular sample plots. The stand dynamics depend strongly on the SI of the area, as that has a direct effect on diameter and height increment, and therefore also on the basal area at different stages of stand development, besides the number of trees planted. In Norway, SI is expressed as the dominant height at the indexed age of 40 years (Tveite 1977) and is tree-species specific. We simulated the most relevant SI ranging from 10 to 24 in two SI (meters) intervals. We applied tree-planting densities adjusted to the SI: the higher the SI, the higher the number of spruce or pine trees planted per hectare. Following the common recommendations in Norway (County Governor of Innlandet 2012), these densities varied from 1600 to 2500 plants ha–1. No thinning was assumed to take place. In Norway, spruce stands are thinned typically once, if at all. In many regions in Norway, stands are rarely thinned because of the high logging costs and low pulpwood prices (NIBIO 2017). This issue is unlikely to vanish anytime soon. The closing of the last sulphate pulp mill in 2014 and the closing of some paper machines have reduced the pulpwood demand in Norway. Over 40% of coniferous pulpwood harvested in Norway is currently exported (Statistics Norway 2022a). Pine is typically thinned more often than spruce (NIBIO 2017). However, it is not feasible to do separate thinning to small patches of pine inside a spruce-dominated stand like in our Precision forestry case. Avoiding thinning is also one measure to avoid root rot problems (Piri and Korhonen 2008). Moreover, Rotstand has not yet been calibrated to consider the impact of thinning in Norwegian forests.
2.2 Method and data used for choosing the economically optimal tree species and rotation length
2.2.1 The method used for calculating the optimal tree species and rotation length
We consider the situation where a forest owner has to select a regeneration strategy for a clear-cut previously spruce-dominated stand, represented as a grid of pixels with different combinations of SI and occurrences of RBR. In the absence of rot in the area, the forest owner might continue having spruce on the site or shift to pine if pine is more suitable for it by SI. In the presence of rot, we should consider a shift from spruce to less susceptible species of pine for the entire stand or parts of it. Still, we assume that the stand will also be managed as one entity in the future and clear-felled at the end of the rotation. Hence no part of the stand would be harvested earlier or later than the other pixels in the area. We consider that the rotation length is decided based on the economic criterion of maximising the net present value (NPV) of the whole area, which consists in calculating the present value of its revenues minus the present value of its costs over time. We will use the NPV over infinite time, called LEV, as a decision criterion.
The economically optimal harvesting age for the whole area is the one which gives the highest sum of LEVs of the individual pixels. We find this optimum by comparing the total LEV in alternative plausible rotation lengths where each pixel has the optimal tree species assigned to it given that rotation length, SI, and rot level.
We give the formula of LEV in Eq. 1. That gives the LEV in a discrete-time setting, where St refers to the stumpage value (€ ha–1) at stand age t, I is the silvicultural costs (€ ha–1), and r is the interest rate. Stumpage value St corresponds to the revenues minus operational costs of harvesting at age t. The first part of the formula contains the NPV of one rotation and the second part is a multiplier for the perpetual NPV.

Using the real dataset described below, we will compare the results obtained using the above pixel-optimised Precision forestry method to those obtained by the most profitable single-species selection over the whole stand.
2.2.2 The data used for calculating the LEVs
To calculate stumpage values (St), we need data on roundwood prices, logging costs, and volume of roundwood assortments. Roundwood prices are available for roadside in Norway. For them, we considered 47 € m–3 and 45 € m–3 for spruce and pine sawlogs, and 29 € m–3 and 27 € m–3 for spruce and pine pulpwood, respectively (Statistics Norway 2022b). The rotten pulpwood was assumed to be worth 23 € m–3 for spruce and 21 € m–3. We employed the models of Dale et al. (1993) and Eid (1998) to estimate harvesting costs and Dale and Stamm (1994) and Eid (1998) for forwarding costs. Even though these models are relatively old, updating their hourly rates results in unit costs that are compatible with those currently observed in Norway. Volumes of sawlogs, pulpwood, and rotten pulpwood come from RotStand simulations. These data also disaggregate healthy and rotten wood. For silvicultural costs, our starting point was the average cost for planting spruce in 2020 from Statistics Norway (2022c). We adjusted the costs according to the planted tree species and the SI of the area, which determines the number of seedlings per hectare. Finally, due to the Norwegian tax subsidy system, we deducted 35% of the planting costs accounting for typical subsidies and tax benefits related to silvicultural activities (Skogfond). We used an interest rate of 3%.
2.3 Study area and pixel generation
We had initially 128 stands from sites in Central and Eastern Norway with rot levels data registered by the forest harvester operators. Removal of stands below one hectare reduced the number of stands to 110. Then, removing stands with SI values known for less than 80% of the pixels reduced the number of sites to 102. We also removed sites scattered to several isolated areas by visually going through and looking at the sites. That reduced the number of stands considered in our further analysis to 71.
We collected data on the trees on harvested stands by using cut-to-length harvesters. The operator visually estimated the presence or absence of RBR for each spruce log, classifying each tree with rot at the stem base as rotten. The rot registration was done by adding extra assortments for rotten wood. We created a raster with a 16 m ×16 m pixel size for each stand. In some of the stands, the tree location was simplified and assumed to be the harvester’s location upon felling the tree. We calculated each pixel’s number of spruce, pine and birch trees (Betula spp.) and the relative number of rotten spruce trees. Finally, we extracted the SI for pine and spruce from the Norwegian forest resources map (SR16) (NIBIO 2020). We started by extracting an area that extended 150 m in all directions from the stand for the SR16 dataset. However, not all pixels in all stands had an SI in the SR16 dataset. We used an average SI of all neighbouring pixels for these pixels repeating this process until all pixels on the stand had a SI value.
The 71 stands examined had a total of 16 103 pixels initially. However, as the stand borders are not following the 16 m × 16 m squares, fractions of some pixels are likely to be partly outside of the stand borders. Trying to avoid including pixels not entirely inside the stands, we removed the pixels with less than 7 trees (<273 tree ha–1). We considered the low stocking level to indicate that part of the pixel area was outside the harvested area. Eventually, the number of included pixels was 12 475. Table 1 describes the pixel data included in the analysis, while Fig. 1 gives a picture of the SI and rot level distribution when considering the dominant SI of the stand.
| Table 1. Description of the pixel data from Central and Eastern Norway used in the case study. The table shows the number of pixels for each site index / initial rot level combination and its cumulative distribution in the last row. | ||||||||||||||||||||||
| Site Index spruce | Rot level (%) | |||||||||||||||||||||
| 0 | 5 | 10 | 15 | 20 | 25 | 30 | 35 | 40 | 45 | 50 | 55 | 60 | 65 | 70 | 75 | 80 | 85 | 90 | 100 | Total | ||
| 10 | 321 | 131 | 148 | 129 | 106 | 61 | 43 | 27 | 19 | 21 | 11 | 4 | 4 | 2 | 1 | 1 | 1 | 1 | 1 | 0 | 1032 | |
| 12 | 895 | 365 | 290 | 253 | 135 | 114 | 81 | 47 | 42 | 22 | 19 | 8 | 5 | 6 | 1 | 2 | 1 | 1 | 1 | 0 | 2288 | |
| 14 | 1235 | 583 | 468 | 399 | 319 | 228 | 208 | 133 | 129 | 102 | 48 | 43 | 21 | 20 | 14 | 6 | 3 | 0 | 1 | 0 | 3960 | |
| 16 | 816 | 281 | 225 | 145 | 104 | 80 | 54 | 37 | 35 | 28 | 27 | 20 | 11 | 5 | 3 | 3 | 2 | 0 | 0 | 1 | 1877 | |
| 18 | 523 | 286 | 202 | 162 | 112 | 72 | 55 | 43 | 23 | 22 | 13 | 14 | 6 | 4 | 3 | 0 | 0 | 1 | 1 | 0 | 1542 | |
| 20 | 697 | 290 | 226 | 190 | 110 | 75 | 48 | 34 | 26 | 18 | 3 | 8 | 1 | 2 | 0 | 0 | 0 | 0 | 0 | 0 | 1728 | |
| 22 | 13 | 9 | 7 | 7 | 3 | 2 | 5 | 1 | 0 | 0 | 1 | 0 | 0 | 0 | 0 | 0 | 0 | 0 | 0 | 0 | 48 | |
| Total | 4500 | 1945 | 1566 | 1285 | 889 | 632 | 494 | 322 | 274 | 213 | 122 | 97 | 48 | 39 | 22 | 12 | 7 | 3 | 4 | 1 | 12 475 | |
| Distr. | 36% | 52% | 64% | 75% | 82% | 87% | 91% | 93% | 95% | 97% | 98% | 99% | 99% | 100% | 100% | 100% | 100% | 100% | 100% | 100% | ||
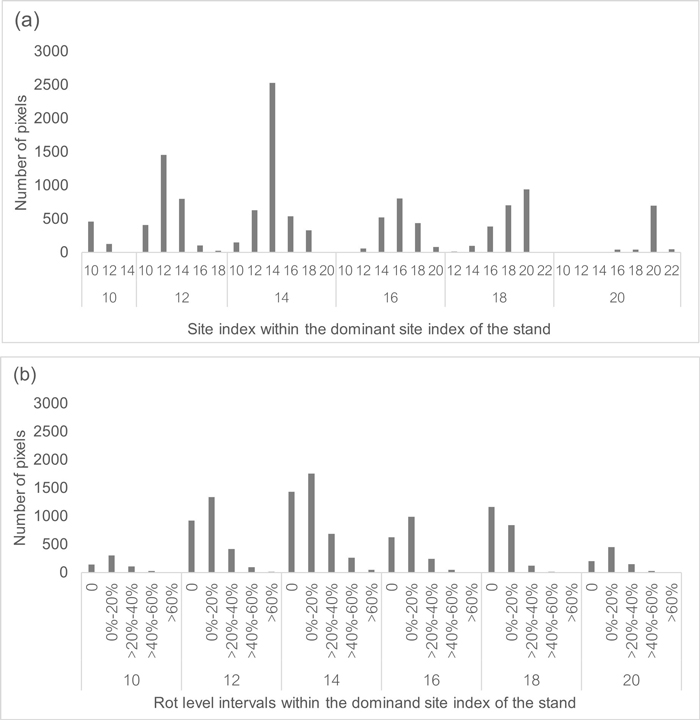
Fig. 1. Pixel data distribution regarding site index and rot level within the 71 stands analysed in central and eastern Norway. (a) Site index distribution when aggregating the stands by its dominant site index (heterogeneous areas). (b) Rot level intervals distribution when aggregating the stands by their dominant site index (heterogeneous areas).
To account for differences in productivity between species on a given site, one needs to know the SI for the alternative species for the site. We used a model by Braastad (1983) for calculating the corresponding SI across species.
3 Results
3.1 Optimal species given the initial level of RBR infection on the site
Table 2 summarises the results by showing the tree species that gives the highest NPV for the different combinations of SI and rot levels for a range of plausible rotation lengths (55–90 years). The table has the spruce SI as reference (first column), but we also indicate the equivalent index for pine. We marked the optimal rotation age in bold, given that a stand is homogenous regarding its SI and initial RBR incidence. For instance, a pixel of SI 20 for spruce with a 20% initial rot level should be planted with spruce if it belongs to a stand managed for a rotation length of 70 years. If the rot level is 35% instead, it would be more favourable to plant the pixel with pine for the same rotation length. It is essential to mention that the results for sites with RBR infestation apply to areas similar to the one used as a reference in the RotStand calculations described earlier.
| Table 2. Optimal tree species for each combination of site index, initial rot level, and rotation length. P stands for Pinus sylvestris (pine) and S for Picea abies (spruce). The economically optimal rotation age (NPV based considering an interest rate of 3%) for each site index given a homogenous rot level is indicated in bold. The brackets indicate negative NPVs, while the lack indicates positive NPVs. | ||||||||||||||||||||||
| H40 Site Index | Rotation length (years) | Initial rot level (%) | ||||||||||||||||||||
| 0 | 5 | 10 | 15 | 20 | 25 | 30 | 35 | 40 | 45 | 50 | 55 | 60 | 65 | 70 | 75 | 80 | 85 | 90 | 95 | 100 | ||
| Spruce -10 | 55–80 | (P) | (P) | (P) | (P) | (P) | (P) | (P) | (P) | (P) | (P) | (P) | (P) | (P) | (P) | (P) | (P) | (P) | (P) | (P) | (P) | (P) |
| Pine -12 | 85 | (P) | (P) | (P) | (P) | (P) | (P) | (P) | (P) | (P) | (P) | (P) | (P) | (P) | (P) | (P) | (P) | (P) | (P) | (P) | (P) | (P) |
| 90 | (P) | (P) | (P) | (P) | (P) | (P) | (P) | (P) | (P) | (P) | (P) | (P) | (P) | (P) | (P) | (P) | (P) | (P) | (P) | (P) | (P) | |
| Spruce - 12 | 55–75 | (P) | (P) | (P) | (P) | (P) | (P) | (P) | (P) | (P) | (P) | (P) | (P) | (P) | (P) | (P) | (P) | (P) | (P) | (P) | (P) | (P) |
| Pine - 13 | 80 | (P) | (P) | (P) | (P) | (P) | (P) | (P) | (P) | (P) | (P) | (P) | (P) | (P) | (P) | (P) | (P) | (P) | (P) | (P) | (P) | (P) |
| 85 | (S) | (P) | (P) | (P) | (P) | (P) | (P) | (P) | (P) | (P) | (P) | (P) | (P) | (P) | (P) | (P) | (P) | (P) | (P) | (P) | (P) | |
| 90 | (S) | (S) | (P) | (P) | (P) | (P) | (P) | (P) | (P) | (P) | (P) | (P) | (P) | (P) | (P) | (P) | (P) | (P) | (P) | (P) | (P) | |
| Spruce - 14 | 55 | (P) | (P) | (P) | (P) | (P) | (P) | (P) | (P) | (P) | (P) | (P) | (P) | (P) | (P) | (P) | (P) | (P) | (P) | (P) | (P) | (P) |
| Pine - 14 | 60 | (S) | (P) | (P) | (P) | (P) | (P) | (P) | (P) | (P) | (P) | (P) | (P) | (P) | (P) | (P) | (P) | (P) | (P) | (P) | (P) | (P) |
| 65–70 | (S) | (S) | (P) | (P) | (P) | (P) | (P) | (P) | (P) | (P) | (P) | (P) | (P) | (P) | (P) | (P) | (P) | (P) | (P) | (P) | (P) | |
| 75 | S | (S) | (S) | (P) | (P) | (P) | (P) | (P) | (P) | (P) | (P) | (P) | (P) | (P) | (P) | (P) | (P) | (P) | (P) | (P) | (P) | |
| 80 | S | S | (S) | (P) | (P) | (P) | (P) | (P) | (P) | (P) | (P) | (P) | (P) | (P) | (P) | (P) | (P) | (P) | (P) | (P) | (P) | |
| 85 | S | S | (S) | (S) | (P) | (P) | (P) | (P) | (P) | (P) | (P) | (P) | (P) | (P) | (P) | (P) | (P) | (P) | (P) | (P) | (P) | |
| 90 | S | (S) | (S) | (S) | (P) | (P) | (P) | (P) | (P) | (P) | (P) | (P) | (P) | (P) | (P) | (P) | (P) | (P) | (P) | (P) | (P) | |
| Spruce - 16 | 55 | S | (S) | (P) | (P) | (P) | (P) | (P) | (P) | (P) | (P) | (P) | (P) | (P) | (P) | (P) | (P) | (P) | (P) | (P) | (P) | (P) |
| Pine - 16 | 60 | S | S | P | P | P | P | P | P | P | P | P | P | P | P | P | P | P | (P) | (P) | (P) | (P) |
| 65 | S | S | S | P | P | P | P | P | P | P | P | P | P | P | P | P | P | P | P | P | P | |
| 70 | S | S | S | P | P | P | P | P | P | P | P | P | P | P | P | P | P | P | P | P | P | |
| 75 | S | S | S | S | P | P | P | P | P | P | P | P | P | P | P | P | P | P | P | P | P | |
| 80 | S | S | S | S | P | P | P | P | P | P | P | P | P | P | P | P | P | P | P | P | P | |
| 85–90 | S | S | S | S | S | P | P | P | P | P | P | P | P | P | P | P | P | P | P | P | P | |
| Spruce - 18 | 55 | S | S | S | S | S | P | P | P | P | P | P | P | P | P | P | P | P | P | P | (P) | (P) |
| Pine - 17 | 60–65 | S | S | S | S | S | P | P | P | P | P | P | P | P | P | P | P | P | P | P | P | P |
| 70 | S | S | S | S | S | S | P | P | P | P | P | P | P | P | P | P | P | P | P | P | P | |
| 75 | S | S | S | S | S | S | P | P | P | P | P | P | P | P | P | P | P | P | P | P | P | |
| 80–90 | S | S | S | S | S | S | P | P | P | P | P | P | P | P | P | P | P | P | P | P | P | |
| Spruce - 20 | 55–65 | S | S | S | S | S | S | S | P | P | P | P | P | P | P | P | P | P | P | P | P | P |
| Pine - 18 | 70 | S | S | S | S | S | S | S | P | P | P | P | P | P | P | P | P | P | P | P | P | P |
| 75–90 | S | S | S | S | S | S | S | P | P | P | P | P | P | P | P | P | P | P | P | P | P | |
| Spruce - 22 | 55–60 | S | S | S | S | S | S | S | P | P | P | P | P | P | P | P | P | P | P | P | P | P |
| Pine - 20 | 65 | S | S | S | S | S | S | S | P | P | P | P | P | P | P | P | P | P | P | P | P | P |
| 70 | S | S | S | S | S | S | S | S | P | P | P | P | P | P | P | P | P | P | P | P | P | |
| 75–85 | S | S | S | S | S | S | S | S | P | P | P | P | P | P | P | P | P | P | P | P | P | |
| 90 | S | S | S | S | S | S | S | P | P | P | P | P | P | P | P | P | P | P | P | P | P | |
| Spruce - 24 | 55–60 | S | S | S | S | S | S | S | S | P | P | P | P | P | P | P | P | P | P | P | P | P |
| Pine - 21 | 65 | S | S | S | S | S | S | S | S | S | P | P | P | P | P | P | P | P | P | P | P | P |
| 70 | S | S | S | S | S | S | S | S | S | P | P | P | P | P | P | P | P | P | P | P | P | |
| 75 | S | S | S | S | S | S | S | S | S | P | P | P | P | P | P | P | P | P | P | P | P | |
| 80–85 | S | S | S | S | S | S | S | S | P | P | P | P | P | P | P | P | P | P | P | P | P | |
| 90 | S | S | S | S | S | S | S | P | P | P | P | P | P | P | P | P | P | P | P | P | P | |
The results for the healthy sites confirm the practices currently adopted in Norway, which is to choose pine in low SI (SI < 12) and spruce in areas with higher SI. However, one can notice from Table 2 that the NPVs are negative for spruce SI lower or equal than 12 even without rot. The choice between spruce or pine, mainly in the medium SI areas in the stand, also depends on the optimal harvesting age of the whole stand. For spruce SI 16 onwards, there is a clear tendency of it being more profitable to plant spruce in areas with a low rot level and pine for higher rot levels. The higher the SI, the higher the threshold is for continuing to plant spruce. That suggests that the vigorous spruce growth in high productivity sites compensates for losses caused by RBR. In the highest spruce SI 22 and 24, shifting to pine becomes an economically interesting alternative only in relatively high initial rot levels of 40% or above, which are not very common (Table 2).
Regarding rotation age, the optimal values tend to be around 70–75 for spruce SI 16–20 and 65–70 for SI of 22–24. Among the cases where spruce remains the economically optimal tree species also under the presence of some rot, we can notice that the presence of rot never shortens the suggested optimal rotation ages but, in some cases, lengthens it (high SIs). The same seems to apply to the cases where pine is the preferred species. The more severe the rot level, the longer it seems to take for the stand to reach its best economic potential. On the other hand, shifting from spruce to pine due to rot is often accompanied by a shorter rotation length. Hence, it seems that the presence of rot does not always shorten the rotation but may make it longer.
We can use the above results for homogenous stands in both productivity and rot levels. However, the area managed as one unit may be a mosaic of pixels of various SI. Importantly, also the RBR infections tend to be somewhat unevenly distributed within the stand so that the area may have locations that are free of RBR and locations that have varying levels of it. We determine the rotation length and the related choice of tree species across the site by maximising the NPV for the whole stand. In the next section, we present a Precision forestry case study and illustrate the choices of economically optimal tree species for stands consisting of heterogenous pixels.
3.2 Precision forestry illustrated by a case study
We applied the results in the previous section (summarized in Table 2) to choose pine or spruce for individual pixels so that the NPV of the entire stand will be maximised. The changes in species and economic gain of Precision forestry guided by pixel-level information on SI and the presence of RBR are here compared to the case where the forest owner uses forest management relying on one tree species over the whole stand.
Fig. 2 shows the share of stands where the implementation of Precision forestry (pixel-optimised species selection) was more profitable than choosing a single species. There was a gain in the LEV in 99% of the stands considered when using the pixel-optimised species selection. The average gain was 29.7 € ha–1, corresponding to a 6.3% increase in LEV in arithmetic terms, or a 5.8% increase when weighted by the stand area. As expected, the most significant gains from applying the Precision forestry method came in areas formerly designated for spruce, now converted to pine. If not considering RBR, spruce would have been recommended as the best alternative for the whole site in several stands since most of our pixels have SI 14 and 16 (Fig. 1a). However, by considering the information on RBR levels (mostly 10–20% according to Fig. 1b), planting of pine could be directed to the rot-infected areas.
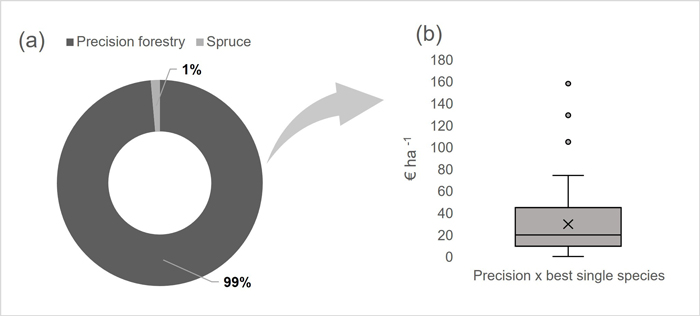
Fig. 2. Precision forestry method results. (a) Share of stands where the most profitable option was planting Picea abies (spruce) only or planting mixed species according to the site index and rot level (Precision forestry). (b) Increase in LEV (€ ha–1) observed in the stands where Precision forestry yields the best results. The values are obtained by comparing the results of the Precision forestry method to the best single species (only Picea abies or Pinus sylvestris – whichever is the best) alternative.
Converting an RBR-infested spruce stand entirely to pine can result in loss compared to continuing with spruce. Fig. 3 shows the decrease in NPV expressed at the hectare level for different combinations of SI and rot levels when planting a pixel with a species that is not economically optimal. For instance, if a forest owner decides to plant pine, instead of spruce, in a site with SI 22 and a rot level of 10%, he/she might incur a loss in decreased NPV of 1094 € ha–1. Considering all our case study stands, if the forest owner reacted to RBR detected in all the stands by planting them entirely with pine, a loss of on average 295 € ha–1 would occur compared to the LEV that one could obtain if she/he had implemented Precision forestry. The opposite case – continuing to plant spruce in areas heavily affected by rot instead of shifting to pine – also incurs losses for the forest owner.
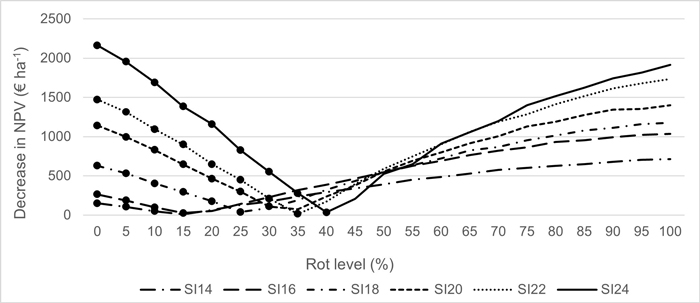
Fig. 3. Decrease in NPV (€ ha–1), considering the economically optimal rotation age when choosing the non-optimal species. The bulleted part of the graph refers to the losses when planting Pinus sylvestris (pine) instead of Picea abies (spruce) in a homogeneous area. The non-bulleted part of the graph refers to the losses when planting Picea abies (spruce) instead of Pinus sylvestris (pine) in a homogeneous area. The lines refer to different site indexes.
4 Discussion
By applying Precision forestry to the stands in our case study, the forest owner gained on average 29.7 € ha–1, the gain ranging from 2 € ha–1 to 158 € ha–1. Like in many economic analyses related to forestry, the expected gains depend highly on the assumed timber prices. If the prices differ much from the ones used here (section 2.2), the optimal species may change, and the gains of Precision forestry are also affected. Nevertheless, the results demonstrate that for RBR-affected forests, there is a strong potential for Precision forestry with technology (harvesters and SI information) that is already operational and readily available. Further, the results illustrate that for a large part of the Norwegian forest, where the main practice is to plant spruce monocultures independent of RBR infections, there is an excellent potential for improving regeneration strategies and economic value for the forest owner.
We can consider the gains of Precision forestry suggested by our calculations underestimated for two reasons. First, we compare Precision forestry with the best single-species case that accounts for the different SI per pixel and adapts planting density for each unit. Given a standard practice, a forest owner might instead consider a homogeneous SI with the same plant density for the entire stand, thus obtaining a lower return than we considered a point of comparison. Second, when having the information on SI and rot level, the forest owner could consider if the conditions were favourable to natural regeneration with birch (or pine if possible) in the infected pixels where planting would result in negative or else low NPV. Birch is a pioneer species that often appears on the clear-cut stands soon after harvesting. Letting birch colonise areas with rot would comply with the forest certification applied in Norway, which requires 10% broadleaved species. In some cases, however, planting may be the only means for establishing the new tree generation within the time frame required by the forest law. Planting could also be regarded as an investment to constrain the spread of the fungi in higher SI areas and to prevent the RBR situation from becoming more severe in the subsequent rotations. Another possibility we did not evaluate in this study would be to plant pine in clusters around infected spruce stumps to constrain the spread of the RBR. Möykkynen and Pukkala (2011) suggest it to be an effective means for decreasing the economic losses caused by RBR.
Identifying parameters, such as SI and rot levels, precisely is essential for economically optimal forest management. Inaccurate identification of SI might result in planting species that are not economically optimal. For instance, considering Table 2, a homogenous area of spruce SI 24 and 35% rot is recommended to be planted with spruce and clear-felled at the age of 70. However, if we mistakenly identified this area as SI 22, the forest owner might plant pine, harvesting the area at age 65. That would cause a loss in terms of decreased NPV of 28 € ha–1. The differences in NPV vary from case to case and might not always happen. In this context, one should note that we used the Braastad (1983) equations to convert spruce SI to pine SI. The fact that we did not correct for errors in variables, as suggested by Sharma (2013) and Nigh (1995), may result in inaccuracies when computing the equivalent SI. Consequently, that might influence the species’ choices. While this study aimed at illustrating the Precision method, uncertainties in SIs are worth considering in the next stage.
We considered planting as the only means for regeneration. In practice, planting pine in lower SI might be an economically inferior choice compared to regenerating the site naturally. Among the spruce SI considered in this study, those equal to or lower than 12 yielded negative NPV regardless of the rot level if planted, meaning that only the natural regeneration would pay off. Hence, our results are not necessarily applicable to stands dominated by pixels of low SI. Considering natural regeneration in the presence of rot could be an interesting extension for further work. Another limitation of our study is that we did not consider thinning as a management option. Including thinning as a management alternative would be a natural next step in developing modelling tools for Precision forestry.
5 Conclusion
The optimal species for regeneration in RBR-infected forests should consider, among other possible criteria, the SI and the frequency of RBR in the area. The results for healthy sites are in line with the practices currently adopted in Norway, which is to choose pine in low SI (SI < 12) and spruce in areas with higher SI. However, planting any species in areas with SI < 12 yields negative NPVs, implying that natural regeneration is the best alternative in this condition. The choice between spruce or pine, mainly in medium SI areas, also depends on the optimal harvesting age of the whole stand. For spruce SI 16 onwards, there is a clear tendency towards planting spruce in areas with a low rot level and pine for higher rot levels. The higher the SI, the higher the threshold for continuing to plant spruce.
Our case study with real data demonstrated that Precision forestry can bring returns to the forest owner. The application of spatial information on SI and decay level to choose the optimal tree species at pixel level increased the LEV of almost all 71 stands in the dataset compared to planting a single species across the stand. The average gain in LEV was approximately 6%.
Declaration of openness of research materials, data, and code
The datasets generated/analysed during the current study are available from the corresponding author on reasonable request.
Authors’ contributions
Ana Aza: Conceptualisation, Methodology, Software, Formal analysis, Investigation, Writing - Original Draft, Writing - Review & Editing, Visualization, Final approval.
A Maarit I. Kallio: Conceptualisation, Methodology, Investigation, Writing - Review & Editing, Supervision, Final approval.
Timo Pukkala: Methodology, Software, Writing - Review & Editing, Final approval.
Ari Hietala: Methodology, Writing - Review & Editing, Final approval.
Terje Gobakken: Methodology, Writing - Review & Editing, Funding acquisition, Final approval.
Rasmus Astrup: Conceptualisation, Methodology, Writing - Review & Editing, Funding acquisition, Project administration, Final approval.
Acknowledgements
We would like to thank Simon Berg for preparing the pixel dataset from the harvester machine data and Kjersti Holt Hansen for her advice on parameters for silviculture and the first introduction to the RotStand.
Funding
The Research Council of Norway funded this research through the PRECISION project—Precision forestry for improved resource use and reduced wood decay in Norwegian Forests (project number NFR281140).
References
Bielak K, Dudzinska M, Pretzsch H (2014) Mixed stands of Scots pine (Pinus sylvestris L.) and Norway spruce [Picea abies (L.) Karst] can be more productive than monocultures. Evidence from over 100 years of observation of long-term experiments. For Syst 23: 573–589. https://doi.org/10.5424/fs/2014233-06195.
Bielak K, Dudzinska M, Pretzsch H (2015) Volume growth of mixed-species versus pure stands: results from selected long-term experimental plots in Central Europe. Sylwan 159: 22–35.
Bollandsås OM (2007) Uneven-aged forestry in Norway: inventory and management models. PhD thesis 2007:30. Norwegian University of Life Sciences.
Bollandsås OM, Buongiorno J, Gobakken T (2008) Predicting the growth of stands of trees of mixed species and size: a matrix model for Norway. Scand J Forest Res 23: 167–178. https://doi.org/10.1080/02827580801995315.
Braastad H (1983) Produksjonsnivaaet i glissen og ujamn granskog. [Yield level in Picea abies stands with low initial density and irregular spacing]. Rapp Skogforsk 7: 1–42. Norwegian Forest Research Institute - NIBIO.
County Governor of Innlandet (2012) Standard for planting densities for spruce in Innlandet. https://www.statsforvalteren.no/innlandet/landbruk-og-mat/skogbruk/skogkultur/planting/. Accessed 15.7.2022.
Dale Ø, Stamm J (1994) Grunnlagsdata for kostnadsanalyse av alternative hogstformer. [Base data for harvesting cost analysis on alternative silvicultural methods]. Rapp Skogforsk 7: 1–37. Norwegian Forest Research Institute - NIBIO.
Dale Ø, Kjøstelsen L, Aamodt H (1993) Mekaniserte lukkede hogster. [Mechanized selective cuttings]. Rapport fra skogforskningen. In: Aamodt HE (ed) Flerbruksrettet driftsteknikk. Rapp Skogforsk 20: 3–23. Norwegian Forest Research Institute - NIBIO.
Eid T (1998) Langsiktige prognoser og bruk av prestasjonsfunksjoner for å estimere kostnader ved mekanisert drift. [Long-term prognoses and the use of productivity functions for cost estimation in mechanised harvesting and forwarding]. Rapp Skogforsk 7: 1–31. Norwegian Forest Research Institute - NIBIO.
Hägglund B, Lundmark J (1981) Handledning i bonitering med Skogshögskolans boniteringssystem. [Guide in using site index system according to the Swedish Forest School]. National board of forestry, Jönköping, Sweden.
Holmström E, Goude M, Nilsson O, Nordin A, Lundmark T, Nilsson U (2018) Productivity of Scots pine and Norway spruce in central Sweden and competitive release in mixtures of the two species. Forest Ecol Manag 429: 287–293. https://doi.org/10.1016/j.foreco.2018.07.008.
Honkaniemi J, Ahtikoski A, Piri T (2019) Financial incentives to perform stump treatment against Heterobasidion root rot in Norway spruce dominated forests, the case of Finland. Forest Policy Econ 105: 1–9. https://doi.org/10.1016/j.forpol.2019.05.015.
Huse KJ, Solheim H, Venn K (1994) Råte i gran registrert på stubber etter hogst vinteren 1992. [Rot in spruce registered at stumps after harvesting at winter 1992]. Rapp Skogforsk 23: 1–26. Norwegian Forest Research Institute - NIBIO. http://hdl.handle.net/11250/2560332.
Klima- og miljødepartementet (2021) Klimaplan for 2021–2030. [Climate plan for 2021–2030]. In: Klima- og miljødepartementet Dkk-o (ed).
Korhonen K (1978) Intersterility groups of Heterobasidion annosum. Commun Inst For Fenn 94: 1–25. http://urn.fi/URN:NBN:fi-metla-201207171125.
Korhonen K, Piri T (1994) The main hosts and distribution of the S and P groups of Heterobasidion annosum in Finland. In: Johansson M, Stenlid J (eds) Proceedings of the Eight International Conference on Root and Butt Rots Wik, Sweden and Haikko, Finland, August 9–16, 1993. Swedish University of Agricultural Sciences, Uppsala, Sweden, pp 260–267.
Korhonen K, Delatour C, Greig BJW, Sconhar S (1998) Silvicultural control. In: Woodward S, Stenlid J, Karjalainen R, Hüttermann A (eds) Heterobasidion annosum, biology, ecology, impact and control. CAB International, Wallingford (UK), pp 283–313.
Laasasenaho J (1982) Taper curve and volume functions for pine, spruce and birch. Commun Inst For Fenn 108: 1–74. http://urn.fi/URN:ISBN:951-40-0589-9.
Laine L (1976) The occurrence of Heterobasidion annosum (Fr.) Bref. in woody plants in Finland. Commun Inst For Fenn 90: 1–52. http://urn.fi/URN:NBN:fi-metla-201207171123.
Lindén M, Vollbrecht G (2002) Sensitivity of Picea abies to butt rot in pure stands and in mixed stands with Pinus sylvestris in southern Sweden. Silva Fenn 36: 767–778. https://doi.org/10.14214/sf.519.
Möykkynen T, Pukkala T (2009) Optimizing the management of a Norway spruce stand on a site infected by Heterobasidion coll. Scand J Forest Res 24: 149–159. https://doi.org/10.1080/02827580902870508.
Möykkynen T, Pukkala T (2010) Optimizing the management of Norway spruce and Scots pine mixtures on a site infected by Heterobasidion coll. Scand J Forest Res 25: 127–137. https://doi.org/10.1080/02827581003667322.
Möykkynen T, Pukkala T (2011) Effect of planting Scots pine around Norway spruce stumps on the spread of Heterobasidion coll. Forest Pathol 41: 212–220. https://doi.org/10.1111/j.1439-0329.2010.00673.x.
NIBIO (2017) Tynning og skogproduksjon. [Thinning and forest production]. https://www.nibio.no/tema/skog/skogbehandling-og-skogskjotsel/tynning/tynning-og-skogproduksjon. Accessed 13.7.2022.
NIBIO (2020) Produktark: Skogressurskartet SR16. [Product worksheet: forest resource map SR16]. Norwegian Forest Research Institute - NIBIO, Ås.
Nigh GD (1995) The geometric mean regression line: a method for developing site index conversion equations for species in mixed stands. Forest Sci 41: 84–98. https://doi.org/10.1093/forestscience/41.1.84.
Oliva J, Stenlid J (2011) Validation of the Rotstand model for simulating Heterobasidion annosum root rot in Picea abies stands. Forest Ecol Manag 261: 1841–1851. https://doi.org/10.1016/j.foreco.2011.02.007.
Piri T, Korhonen K (2008) The effect of winter thinning on the spread of Heterobasidion parviporum in Norway spruce stands. Can J Forest Res 38: 2589–2595. https://doi.org/10.1139/x08-103.
Piri T, Korhonen K, Sairanen A (1990) Occurrence of Heterobasidion annosum in pure and mixed spruce stands in Southern Finland. Scand J Forest Res 5: 113–125. https://doi.org/10.1080/02827589009382598.
Pratt JE, Shaw III CG, Vollbrecht G (1998) Modelling disease development in forest stands. In: Woodward S, Stenlid J, Karjalainen R, Hüttermann A (eds) Heterobasidion annosum: biology, ecology, impact and control. CAB International, Wallingford (UK), pp 213–233
Pukkala T, Miina J (1997) A method for stochastic multiobjective optimization of stand management. Forest Ecol Manag 98: 189–203. https://doi.org/10.1016/s0378-1127(97)00081-9.
Pukkala T, Möykkynen T, Thor M, Rönnberg J, Stenlid J (2005) Modeling infection and spread of Heterobasidion annosum in even-aged Fennoscandian conifer stands. Can J Forest Res 35: 74–84. https://doi.org/10.1139/x04-150.
Pukkala T, Hanssen K, Andreassen K (2019) Stem taper and bark functions for Norway spruce in Norway. Silva Fenn 53, article id 10187. https://doi.org/10.14214/sf.10187.
Redfern DB, Stenlid J (1998) Spore dispersal and infection. In: Woodward S, Stenlid J, Karjalainen R, Hüttermann A (eds) Heterobasidion annosum: biology, ecology, impact and control. CAB International, Wallingford (UK), pp 105–124.
Seifert T (2007) Simulating the extent of decay caused by Heterobasidion annosum s. l. in stems of Norway spruce. Forest Ecol Manag 248: 95–106. https://doi.org/10.1016/j.foreco.2007.02.036.
Sharma RP (2013) Modelling height, height growth and site index from national forest inventory data in Norway. Norwegian University of Life Sciences (NMBU), Ås.
Statistics Norway (2022a) Utenrikshandel med varer. [Foreign trade in goods]. https://www.ssb.no/statbank/table/08801. Accessed 13.7.2022.
Statistics Norway (2022b) Average price (NOK per m³), by assortment, contents and year. Statistics Norway. https://www.ssb.no/statbank/table/07413/tableViewLayout1/. Accessed 19.05.2022.
Statistics Norway (2022c) Silviculture. https://www.ssb.no/jord-skog-jakt-og-fiskeri/skogbruk/statistikk/skogkultur#content. Accessed 19.05.2022.
Stenlid J, Redfern D (1998) Spread within the tree and stand. In: Woodward S, Stenlid J, Karjalainen R, Hüttermann A (eds) Heterobasidion annosum: biology, ecology, impact and control. CAB International, Wallingford (UK), pp 125–141.
Stenlid J, Wästerlund I (1986) Estimating the frequency of stem rot in Picea abies using an increment borer. Scand J Forest Res 1: 303–308. https://doi.org/10.1080/02827588609382421.
Tamminen P (1985) Butt rot in Norway spruce in southern Finland. Commun Inst For Fenn 127: 1–52. http://urn.fi/URN:ISBN:951-40-0686-0.
Taylor S, Veal M, Grift T, Mc Donald T, Corley F (2002) Precision forestry: operational tactics for today and tomorrow. 25th annual Meeting of the council of Forest Engineers.
Thor M, Arlinger JD, Stenlid J (2006) Heterobasidion annosum root rot in Picea abies: modelling economic outcomes of stump treatment in Scandinavian coniferous forests. Scand J Forest Res 21: 414–423. https://doi.org/10.1080/02827580600917338.
Tveite B (1977) Bonitetskurver for gran. [Site-index curves for Norway spruce (Picea abies (L.) Karst)]. Medd Nor Inst Skogforsk 33: 1–84.
Wang L, Gunulf A, Pukkala T, Rönnberg J (2015) Simulated Heterobasidion disease development in Picea abies stands following precommercial thinning and the economic justification for control measures. Scand J Forest Res 30: 174–185. https://doi.org/10.1080/02827581.2014.978887.
Woodward S, Stenlid J, Karjalainen R, Huttermann A (1998) Heterobasidion annosum : biology, ecology, impact, and control. CAB International, Wallingford (UK).
Ziesak M (2006) Precision forestry – an overview on the current status of Precision Forestry. A literature review. In: Precision Forestry in plantations, semi-natural and natural forests. IUFRO Precision Forestry Conference 2006 Technical University Munich – Stellenbosch University.
Total of 48 references.
