Eva Ring  ,
Lars Högbom,
Hans-Örjan Nohrstedt,
Staffan Jacobson
,
Lars Högbom,
Hans-Örjan Nohrstedt,
Staffan Jacobson
Soil and soil-water chemistry below different amounts of logging residues at two harvested forest sites in Sweden
Ring E., Högbom L., Nohrstedt H.-Ö., Jacobson S. (2015). Soil and soil-water chemistry below different amounts of logging residues at two harvested forest sites in Sweden. Silva Fennica vol. 49 no. 4 article id 1265. https://doi.org/10.14214/sf.1265
Highlights
- Soil-water chemistry, ground vegetation cover and water flux were affected by the amounts of logging residues stored on the ground after harvest
- A strong response on soil-water chemistry was recorded at only one of the two sites
- At the site showing a weak response, less residue remained after seven years in the treatments giving the most pronounced effects.
Abstract
Logging residues (LR), i.e. tops, branches, and needles, are increasingly being harvested for energy production in Fennoscandia. These residues are temporarily piled on site awaiting transport. This study was undertaken to investigate effects on the soil and soil-water chemistry below different amounts of LR at two recently harvested coniferous sites in Sweden. Seven treatments were included and the studied amounts of LR ranged from no LR left on the ground to four times the estimated LR amount of the harvested stands. Two treatments included eight times the estimated LR amount of the harvested stands but here the LR were removed after 7 or 20 weeks. Soil-water samples were collected during the first six or seven growing seasons. Effects of treatment were detected in the soil water for 11 chemical variables at the northern site, and for the NO3- and Cl- concentrations at the southern site. The strongest response was generally found in the treatment with four times the estimated LR amount, for which the highest concentrations were recorded in most cases. In the first three seasons, the water flux through the LR decreased with an increasing amount of residue. Effects on the exchangeable store of Ca2+ in the mor layer and the upper 20 cm of the mineral soil was detected at both sites. At the northern site, the weight of the remaining LR, ground vegetation and all other material above the mor layer in the treatments with two and four times the estimated LR amount was roughly twice the corresponding weights at the southern site seven years after treatment. Although strong effects on the soil-solution chemistry were detected at one of the study sites, in the treatments corresponding to two and four times the estimated logging residue amount, the effect on the leaching from an entire regeneration area is likely to be relatively small given the percentage of the area hosting these logging residue amounts (ca. 20% after stem-only harvesting and 9% after fuel-adapted felling).
Keywords
clearcutting;
final felling;
bio fuel;
conifer;
fuel-adapted felling;
nutrient;
soil solution
-
Ring,
Skogforsk, Uppsala Science Park, SE-751 83 Uppsala, Sweden
E-mail
eva.ring@skogforsk.se
- Högbom, Skogforsk, Uppsala Science Park, SE-751 83 Uppsala, Sweden E-mail lars.hogbom@skogforsk.se
- Nohrstedt, Swedish University of Agricultural Sciences, Department of Soil and Environment, P.O. Box 7014, SE-750 07 Uppsala, Sweden E-mail hans-orjan.nohrstedt@slu.se
- Jacobson, Skogforsk, Uppsala Science Park, SE-751 83 Uppsala, Sweden E-mail staffan.jacobson@skogforsk.se
Received 16 October 2014 Accepted 5 June 2015 Published 25 June 2015
Views 169073
Available at https://doi.org/10.14214/sf.1265 | Download PDF

Corrections
1 Introduction
In Fennoscandia, logging residues, consisting of tops, branches and needles, are increasingly being harvested for energy production (Swedish Forest Agency 2013; Finnish Forest Research Institute 2014). These logging residues are concentrated in piles distributed over the harvested area at final felling to facilitate future collection and transport from the site (so called fuel-adapted felling). Logging residues left on the cutting area during stem-only harvesting are still in heaps, however the size distribution of these heaps is different to that when the fuel-adapted felling technique is used (Jacobson & Filipsson 2013). In general, the storage time on the harvested area is one year or less after fuel-adapted fellings in Sweden, while the logging residues are left permanently after stem-only harvesting.
The NO3- concentration in soil water collected in forest ecosystems in Europe has been found to increase at increasing rates of N throughfall (Gundersen et al. 2006). The NO3- concentration is also affected by forestry operations such as final felling and fertilization. After final felling, the concentration and leaching of NO3- typically increase (inter alia Gundersen et al. 2006; Kreutzweiser et al. 2008). Harvesting the logging residues at final felling has been proposed as a means to reduce N leaching from harvested areas in areas subjected to high N deposition levels (Lundborg 1997). Using a modelling approach, Laurén et al. (2008) concluded that harvesting logging residues at final felling in areas with low atmospheric N deposition seemed to be ineffective in reducing N export to stream water compared with stem-only harvesting. In the model this resulted from a decrease in microbial immobilization, which for stem-only harvesting reduced the net release of N from decomposition and mitigated N export. Gundersen et al. (2006) concluded that the response in NO3- leaching to stem-only and whole-tree harvesting seemed to depend on pre-existing site conditions. The importance of site-specific conditions has been illustrated further in subsequent studies (Kreutzweiser et al. 2008; Thiffault et al. 2011; Devine et al. 2012; Zetterberg et al. 2013).
Logging residues left on the ground can reduce the rate of revegetation, resulting in reduced biomass and nutrient accumulation by vegetation (Stevens and Hornung 1990; Fahey et al. 1991), but minor effects on ground vegetation cover have also been reported (Staaf and Olsson 1994). In a study by Hedwall et al. (2013), there was an effect of whole-tree harvesting on the forest-floor biomass for different species, but not on the total biomass of the forest-floor vegetation. Vegetation regrowth mitigates NO3- leaching (Gundersen et al. 2006). Logging residues also shade the ground, intercept precipitation, and decrease the mean wind speed near the ground (Proe et al. 2001), thus, affecting temperature and moisture conditions in the soil (Jansson 1987; Proe et al. 2001). However, the effects on soil temperature and moisture also depend on how the ground vegetation is affected (cf. Roberts et al. 2005; Harrington et al. 2013). Changes in the soil microclimate may influence mineralization and nitrification rates (Kriebitzsch 1978; Schütt et al. 2014a, 2014b). When studying leachates from lysimeters containing soil organic horizons, Emmett et al. (1991) found that a covering of polystyrene beads resulted in NO3- losses similar to those recorded with a covering of fresh logging residues. They suggested that both types of cover improved microclimatic conditions, stimulating mineralization and nitrification. Higher concentrations or leaching rates of NO3- in the soil water have been found below various amounts of logging residues compared with those for soil water in uncovered soil (Rosén and Lundmark-Thelin 1987; Stevens and Hornung 1990; Staaf and Olsson 1994; Ring et al. 2001; Wall 2008; Slesak et al. 2009; Hedwall et al. 2013), but contrasting or no effects have also been reported (Thiffault et al. 2011). In the study by Hedwall et al. (2013), there was also a statistical interaction effect between whole-tree harvesting and previous fertilization. In the previously fertilized plots, the NO3- concentrations were lower after whole-tree harvesting and higher after stem-only harvesting than on control plots.
Apart from acting as a physical barrier, logging residues represent a significant nutrient pool in coniferous forests (Weetman and Webber 1972; Palviainen and Finér 2011) from which nutrients are released (Johansson 1994; Hyvönen et al. 2000). Water collected below logging residues on a regeneration area in Finland had higher concentrations of organic N, PO43-, Ca2+, Mg2+ and K+ compared to incoming precipitation, while the concentrations of inorganic N generally were of similar magnitude (Wall 2008). Logging residues from a Sitka spruce plantation in Great Britain released organic N but immobilized incoming NO3- (Emmett et al. 1991).
Effects of whole-tree harvesting on the soil stores of C, N, P and exchangeable K+, Mg2+ and Ca2+ have been reported (inter alia Nykvist and Rosén 1985; Kreutzweiser et al. 2008; Thiffault et al. 2011; Zetterberg et al. 2013; Kaarakka et al. 2014). However, the reported effects tended to vary inter alia with the studied element, soil layer and time after harvest (Thiffault et al. 2011). Climate, site productivity, tree-species composition, topography, and logging system are other factors which may influence the ecosystem response to whole-tree harvesting. Although the general pathways of element cycling are well-known, site-specific responses to different harvest intensities cannot yet be predicted. The investigation reported herein was initiated to examine how different amounts of logging residues on two regeneration areas, located in different parts of Sweden, affect soil and soil-water chemistry and the water flux through the logging residues. The studied treatments reflect the amounts of logging residues which may be found on regeneration areas in Sweden (Jacobson and Filipsson 2013). We hypothesized that, with increasing amounts of logging residues left permanently on the ground, 1) the concentrations of NO3--N, Al and K+ will increase in the soil water while pH will decrease, 2) the soil stores of exchangeable K+, Mg2+, Ca2+ and P will increase as a consequence of the increased amounts of nutrients applied with the logging residues, 3) the water flux through the logging residues will decrease, and finally 4) the strongest response in the soil-water chemistry will be found at the site with the highest historic N deposition.
2 Material and methods
The study was performed at two sites in Sweden, 269 Asa and 270 Turbo (hereafter referred to by name only) (Table 1). The sites were covered by coniferous stands dominated by Picea abies (L.) Karst., which were harvested shortly before the study commenced. At each site, seven treatments with four replicates were tested on study plots measuring 3.16 m × 3.16 m (Table 2). The Asa experiment had a completely randomized design, while the randomization at Turbo was within blocks. The division into blocks was based on location on the slope: four rows of study plots (i.e. blocks) were located in parallel lines perpendicular to the slope. At Asa, one extra plot with treatment 0LR was included. The study plots were located about 1–2 m apart. The stand-specific amounts of logging residues for the harvested tree stands at Asa and Turbo were estimated according to biomass allocation functions (Marklund 1988). The stand-specific amount of LR (1LR) is defined as the estimated LR amount per hectare of the harvested tree stand spread on one hectare of the ground. The treatments 2LR and 4LR refer to, respectively, two and four times that amount. The 8Needle_7 and 8Needle_20 treatments resemble the storage and subsequent harvest of logging residues at fuel-adapted fellings. Logging residues corresponding to the different treatments were weighed on site using a boom-mounted scale and applied to the study plots. The treatments were designed to reflect the distributions of LR typically found on regeneration areas in Sweden. In ten stem-only harvested areas, 38% of the area was without LR (47% for ten whole-tree harvested (WTH) areas), 41% was covered by 1LR (29% for WTH areas), 11% by 2LR (8% for WTH areas), 9% by 4LR (1% for WTH areas) and 1% by 8LR (15% for WTH areas) (Jacobson and Filipsson 2013). The moisture content of logging residues may vary (e.g. Pettersson and Nordfjell 2007). In the present study, the dry matter content was assumed to correspond to 55% of the fresh matter content. In the plots representing the 0LR, 1LR, 2LR, and 4LR treatments, the residues were present on the ground during the entire study period, while in the plots representing the remaining treatments the residues were removed after 7 or 20 weeks (Table 2). The study plots were not re-planted during the course of the study.
| Table 1. Details of the study sites, Asa and Turbo, and experimental installations. | ||
| Asa | Turbo | |
| Latitude / longitude | 57°08´N / 14°47´E | 60°14´N / 15°51´E |
| Altitude (m amsl) | 235 | 195 |
| Aspect / topography | east /gentle slope | west / gentle slope |
| Soil type | podzolized sandy-silty till | podzolized silty till |
| C/N in mor layera | 29.9 (26.7) | 27.5 (25.5) |
| Mean precipitation (mm year–1)b | 664 | 581 |
| Annual mean air temperature (°C)b | 5.3 | 5.0 |
| Open-field deposition (mean for 1994–2000)c (kg ha–1 year–1) | ||
| NO3--N | 3.8 | 2.0 |
| NH4+-N | 3.4 | 1.9 |
| SO42--S | 5.2 | 3.0 |
| Cl- | 12 | 2.7 |
| Na++K++Mg2++Ca2+ | 12 | 4.4 |
| Site quality class (m3 ha–1 year–1) | 11.3 | 8.4 |
| Tree species composition of the harvested stand, by basal area | P. abies (100%) | P. abies (71%) & Pinus sylvestris L. (29%) |
| Date of harvest | 23–24 April, 2001 | Shift May-June, 2001 |
| Date of residue treatment | 3 May, 2001 | 31 May, 2001 |
| Date of installation of suction cups and funnelsd | Late April, 2001 | Early May, 2001 |
| aMeasured in 2006 and, shown within parentheses, in 2008. bData from nearby meteorological stations (Alexandersson and Eggertsson Karlström 2001). cData from nearby monitoring stations (http://www.krondroppsnatet.ivl.se/). dFunnels were installed at Asa only. | ||
| Table 2. Studied treatments at the Asa and Turbo sites. Logging residues (LR) include tops and branches with needles. The stand-specific amount of LR (1LR) is defined as the estimated LR amount per hectare of the harvested tree stand spread on one hectare of the ground. The treatments 2LR and 4LR refer to, respectively, two and four times that amount. For the needle treatments, the amounts of needles, calculated according to Marklund (1988), are presented within parentheses. | |||
| Treatment | Abbreviation | Added amount of logging residues in 2001 (kg m-2 dry matter) | |
| Asa | Turbo | ||
| LR harvested | 0LR | 0 | 0 |
| 1×stand-specific amount of LR | 1LR | 4.4 | 5.0 |
| Needles from 1×stand-specific amount of LR (tops and branches were removed after about 20 weeks)a | 1Needle_20 | 4.4 (1.5) | 5.0 (1.6) |
| 2×stand-specific amount of LR | 2LR | 8.8 | 9.9 |
| 4×stand-specific amount of LR | 4LR | 17.6 | 19.8 |
| Needles from 8×stand-specific amount of LR (tops and branches were removed after about 7 weeks)a | 8Needle_7 | 35.2 (11.6) | 39.6 (12.6) |
| Needles from 8×stand-specific amount of LR (tops and branches were removed after about 20 weeks)a | 8Needle_20 | 35.2 (11.6) | 39.6 (12.6) |
| aThe added amounts of needles were less than the presented total amounts, i.e. significant amounts of needles were removed with the tops and branches after storage on the study plots. In the 8Needle_7 and 8Needle_20 treatments, less than 30% of the total amount remained on the ground after removing the LR. | |||
The nutrient content of the logging residues was estimated using nutrient concentrations representative for the harvested stands (Jacobson and Mattsson, 1998), yet bearing in mind that nutrient concentrations may vary considerably among stands. The estimated amounts were 334 kg N ha–1, 39 kg P ha–1, 144 kg K ha–1, 204 kg Ca ha–1 and 34 kg Mg ha–1 at Asa, and 380 kg N ha–1, 43 kg P ha–1, 164 kg K ha–1, 223 kg Ca ha–1 and 38 kg Mg ha–1 at Turbo.
Uncorrected annual precipitation in the period 2001 to 2006 varied between 510 and 901 mm at Asa (data from Asa research station, Swedish University of Agricultural Sciences, SLU, 2014), and between 502 and 697 mm at Turbo (data from a nearby recording station operated by the Swedish Meteorological and Hydrological Institute, SMHI). Total precipitation during 2001 to 2006 was 16% greater at Asa than at Turbo. For individual years, the annual precipitation was 2% (in 2005) to 48% (in 2004) greater at Asa. Annual mean air temperature in the period 2001 to 2006 varied between 6.0 and 7.2 °C at Asa (data from Asa research station, SLU, 2014), and between 6.0 and 7.0 °C at Turbo (data from a nearby SMHI station).
2.1 Soil-water chemistry
One ceramic suction cup (type P80, http://www.ceramtec.com) was installed at a depth of 50 cm in the mineral soil in the centre of each plot. Soil water was collected by applying a suction of 70–80 kPa by hand pumping three to four days before collection. The soil water was transported, through plastic tubing, into a buried PVC-pipe (V = 0.75 dm3). At the time of sampling, the soil water was transferred to polyethene bottles and kept frozen prior to chemical analysis. Starting in 2001, three to five samplings were performed annually, mainly during the growing season, until 2007 at Asa and 2006 at Turbo.
The soil-water samples were sent by mail to the laboratory for chemical analysis of pH and the concentrations of K+, Mg2+, Ca2+, Al, NH4+-N, NO3--N, SO42--S and Cl- without prior filtration. In addition, some samples were analysed for Cd, Zn and electrical conductivity. The samples collected in 2001 to 2003 were analysed according to standard methods at Alcontrol Laboratories AB (http://www.alcontrol.se/). The samples collected in 2004 and after were analysed at the Soil Science Laboratory, SLU Umeå. At this laboratory, electrical conductivity was measured with a conductivity meter, equipped with a conductivity electrode, and pH was measured potentiometrically at 20 ± 2 oC using a combination pH electrode. Metal concentrations were determined by inductively coupled plasma – mass spectrometry with an ICP/MS-DRC. Ammonium-N was determined by flow injection analysis. Chloride, NO3--N and SO42- were determined by anion chromatography.
2.2 Soil chemistry
Soil samples were collected in 2008, in May at Turbo and in September at Asa. The superficial layer, including any remaining logging residues, ground vegetation and all other material above the mor layer, were collected from three 0.50 m × 0.50 m sub-plots on each plot. From the mor layer, three samples were taken per plot using a 10 cm × 10 cm stainless steel frame. From the mineral soil, six soil cores (50 mm diam.) were collected from each plot and divided into two layers (0–10 cm and 10–20 cm). Samples from each soil layer and plot were pooled to form a composite sample representing the whole plot. The samples from the mor layer and the mineral soil were homogenized by sieving (5.6 mm mesh) and thoroughly mixed before chemical analysis. The samples from the superficial layer were ground and homogenized before determination of N and C. Soil pH was measured in a soil:water extract (1:1 v/v) with a pH-probe. Total C (TC) and total N (TN) concentrations were determined for all layers using dried (70 °C, 24h) samples and a CNS 2000 analyser. The concentrations of K+, Mg2+, Ca2+ and P were determined using an ICP Optima 3000 DV in soil extracts with ammonium lactate (1M, pH = 3.75) as the extracting agent, for samples from the mor, 0–10 cm and 10–20 cm layers.
2.3 Ground vegetation
The total ground vegetation cover of the study plots was estimated by eye for the entire plot, in June, 2006 at Asa, and in August or September of 2002, 2003 and 2006 at Turbo. The ground vegetation after final felling was dominated by Rubus idaeus L. and Deschampsia flexuosa (L.) Trin. at both Asa and Turbo.
2.4 Water flux
Water-flux measurements were undertaken at Asa. To measure the volume of water entering the soil, square funnels made from galvanized sheet metal (0.30 m × 0.30 m and 7 cm deep) were installed with the upper brim at the soil surface; one funnel per plot in treatment 0LR (with three replicates), and three funnels per plot in treatments 1LR, 2LR, 4LR and 8Needle_20 (with four replicates). Each funnel was drained by tubing connected to a 10 l plastic container. A textile mesh was placed in the neck of the funnel to avoid litter entering the tubing. In 2001, the water volume in the containers was measured from May until mid-September. The water flux measurements continued in the following years, but only some of these data could be used due to overfilling or other technical problems. Thus, data were also available from 2002 (from Feb. to Oct. inclusive) and 2003 (from Feb. until mid-Nov.).
2.5 Soil temperature
At Asa, the soil temperature beneath the mor layer and the air temperature 1 m above the ground were measured at hourly intervals using data loggers (TinytagPlus™, model 12 Temp G, http://www.geminidataloggers.com/). One logger, wrapped in a plastic bag, was installed per plot in a total of five plots representing the treatments 0LR, 1LR, 2LR, 4LR and 8Needle_20. Thus, the temperature measurements were unreplicated. The depth of the mor layer above the loggers ranged between 5 and 7 cm. The measurements started in May, 2001 and ended in March, 2003. In the 8Needle_20 treatment, however, the measurements were terminated in Sept., 2001 when the residues were removed.
2.6 Statistical analysis
The soil-water chemistry data were statistically analysed using SAS/STAT® software version 9.2 (http://www.sas.com/). The soil-water chemistry data from Asa and Turbo, respectively, were analysed separately according to the following mixed linear model (Model 1) by means of the MIXED procedure:
where yijk is element concentration, pH or electrical conductivity in the soil water, μ is the overall mean, αi is the fixed effect of residue treatment for treatment i, bj is random effect of block j (only at Turbo), τk is the fixed effect of time, k = 1,…, 27 (at Asa) and 20 (at Turbo), (ατ)ik is the fixed effect of interaction between treatment and time, pij is the plot effect and eijk is the residual term (random effect associated with plot effect ij at time k).
In order to account for the dependence between repeated measurements, a spatial covariance structure for residuals was used (σ2ρtij), in which the dependence between samplings (ρ) declines with increasing time intervals (tij). The denominator degrees of freedom for the tests of fixed effects were estimated according to a general Satterthwaite approximation. To test whether treatment effects were significantly different (p < 0.05), differences between least-square means (lsm), adjusted for multiple comparisons according to Tukey-Kramer, were used. To analyze the interactions with time, the slice option was used to determine the sampling occasions that showed effects of treatment. Effects on ground vegetation cover at Turbo were also analysed on the basis of Model 1.
Judged on the skewness and kurtosis for the soil-water chemistry data, the normal distribution of the residuals improved after logarithmic transformation of the electrical conductivity and the concentrations of all variables, except for SO42--S at Asa. Consequently, the statistical analyses were performed on logarithmically transformed concentrations. For pH, the best distribution was found for H+ activity, which was therefore used in the analyses. The least-square means presented in the text were reconverted and corrected for logarithmic bias according to Baskerville (1972). However, the data presented graphically in Figs. 1–3 are least-square means obtained by running Model 1 on untransformed data. Concentrations below the chemical detection limit were set equal to half this limit. No account was taken of the fact that the detection limits varied over time. Between 0and 2.4% of the concentrations of K+, Mg2+, Ca2+, Al and SO42--S were below the detection limits at both sites. For Zn, 11–12% of the concentrations were below the detection limit. The corresponding proportions for the concentrations of NO3-, NH4+, Cl- and Cd were 8, 74, 32 and 8%, respectively at Turbo, and 28, 61, 3.7 and 1.3% at Asa. In the data set from Asa, 6% of the observations on pH, K+, Mg2+, Ca2+, Al, SO42--S, Cl- and NH4+-N (9% for NO3--N) were missing, and in the Turbo data about 13% of the observations were missing. Data from four samples collected at Asa were excluded from the analyses because of strongly deviating values. Pearson correlation coefficients were calculated for each treatment and study site, separately, using untransformed chemistry data from all individual samples.
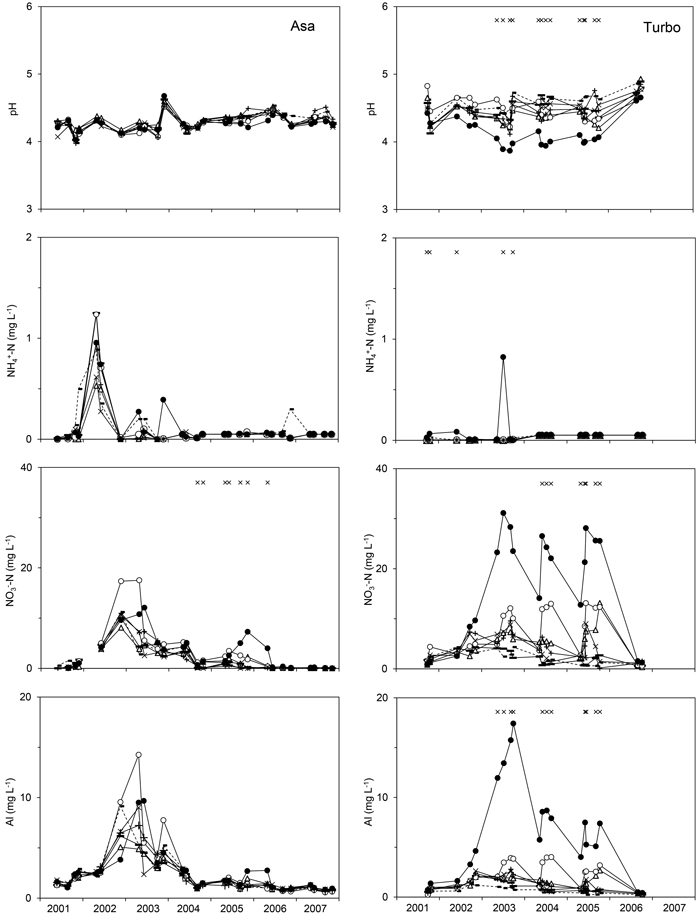
Fig. 1. pH and the concentration of NO3--N, NH4+-N or Al in the soil water representing the logging-residue treatments studied at Asa (left) and Turbo (right) after application of the logging residues. The graphs show least-square means for each sampling occasion obtained by running Model 1 on untransformed concentrations or pH. Study year is presented on the x-axis. 0LR (--■--), 1LR (─∆─), 1Needle_20 (─▬─), 2LR (─○─), 4LR (─●─), 8Needle_7 (─×─), 8Needle_20 (─ + ─). × indicates sampling occasions at which a significant effect of treatment was detected. View larger in new window/tab.
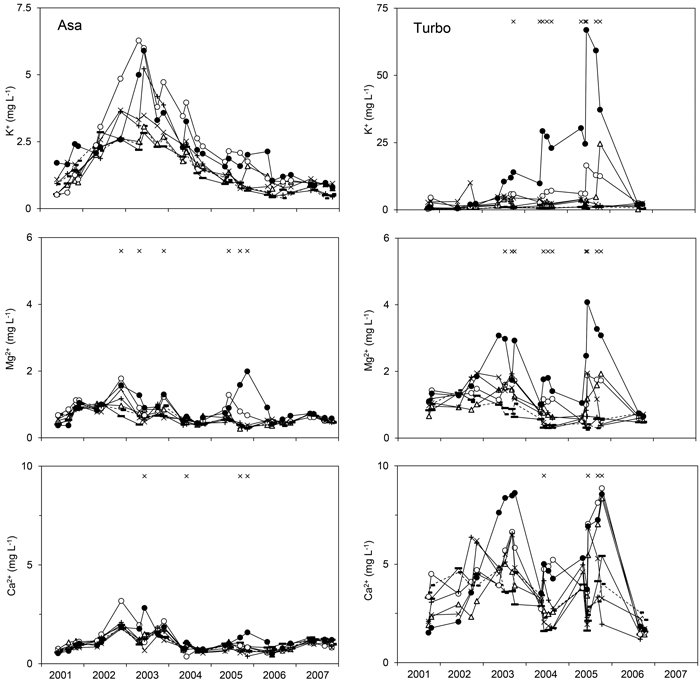
Fig. 2. Concentration of K+, Mg2+, or Ca2+ in the soil water representing the logging-residue treatments studied at Asa (left) and Turbo (right) after application of the logging residues. Note the different scales on the y-axis for the K+ concentration. The graphs show least-square means for each sampling occasion obtained by running Model 1 on untransformed concentrations except for the Ca2+ concentration at Asa which were reconverted from logarithmic values. Study year is presented on the x-axis. 0LR (--■--), 1LR (─∆─), 1Needle_20 (─▬─), 2LR (─○─), 4LR (─●─), 8Needle_7 (─×─), 8Needle_20 (─ + ─). × indicates sampling occasions at which a significant effect of treatment was detected. View larger in new window/tab.
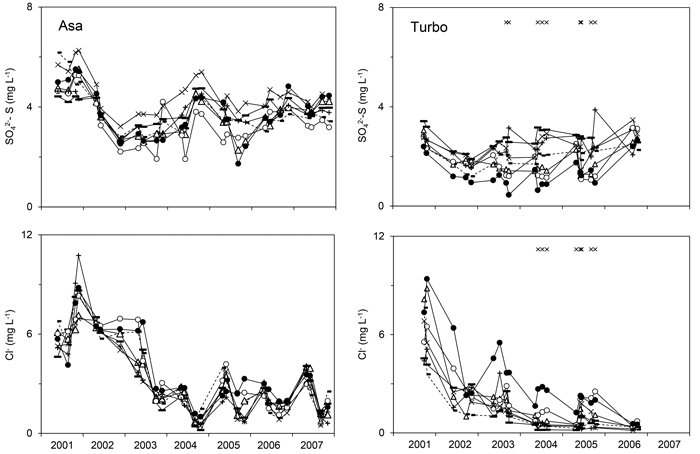
Fig. 3. Concentration of SO42--S or Cl- in the soil water representing the logging-residue treatments studied at Asa (left) and Turbo (right) after application of the logging residues. The graphs show least-square means for each sampling occasion obtained by running Model 1 on untransformed concentrations. Study year is presented on the x-axis. 0LR (--■--), 1LR (─∆─), 1Needle_20 (─▬─), 2LR (─○─), 4LR (─●─), 8Needle_7 (─×─), 8Needle_20 (─ + ─). × indicates sampling occasions at which a significant effect of treatment was detected. View larger in new window/tab.
The soil chemistry data from Asa and Turbo were individually analysed using one-way ANOVAs by means of the GLM procedure. No effect of block was found on the soil chemistry at Turbo, and block was therefore excluded from the analysis. One-way ANOVAs were also used to determine treatment effects on the seasonal water fluxes, separately for each season, and on ground vegetation cover at Asa. Effects were considered statistically significant at p < 0.05.
3 Results
3.1 Soil-water chemistry
At Asa, Al was the dominant cation in the soil water collected from all treatments (when assuming its valence to be +3), and sulphate was the dominant anion. At Turbo, Ca2+ was the dominant cation except in the 4LR treatment where Al dominated. The negative charge was mainly made up of NO3- and SO42-. When including all samplings and treatments, 90 and 99% of the NH4+-N concentrations were < 0.1 mg l–1 at Asa and Turbo, respectively, while 38 and 9% of the NO3--N concentrations were <0.05 mg l–1.
At Asa, the concentrations of NO3--N and Cl- in the soil water were affected by residue treatment (αi) according to Model 1 (Table 3). For NO3--N, there was a significant difference in concentration between the 4LR treatment (with an arithmetic mean of 3.1 mg l–1 for the entire post-treatment period) and the following treatments: 0LR, 1Needle_20, 8Needle_7 and 8Needle_20 with corresponding arithmetic means ranging from 1.6 to 1.8 mg l–1. There was a difference in Cl- concentration between the 4LR (least-square mean (lsm) 3.6 mg l–1) and the 8Needle_7 treatments (lsm 2.5 mg l–1), and there was some indication of differences (p = 0.09) between the 4LR treatment and, respectively, the 0LR (lsm 2.7 mg l–1) and 8Needle_20 (lsm 2.6 mg l–1) treatments. An interaction between treatment and time was found for the concentrations of Mg2+, Ca2+ and NO3--N (Table 3). The NH4+-N concentration tended to increase in the early part of the study at Asa (Fig. 1). There was no effect of treatment or the interaction between treatment and time for the Cd and Zn concentrations. The lsm concentrations for all treatments varied between 0.14 and 0.20 μg l–1 for Cd and between 6.3 and 14 μg l–1 for Zn.
| Table 3. Results from the linear mixed models (Model 1) used to determine effects of treatment, time and the interaction between treatment and time for the studied soil-solution variables; number of observations and p-values according to Model 1. | ||||||||
| Variable | Number of observations, n | p-values for effect of treatment, αi | p-values for effect of time, τk | p-values for interaction between treatment and time, (ατ)ik | ||||
| Asa | Turbo | Asa | Turbo | Asa | Turbo | Asa | Turbo | |
| Electrical conductivity | 629 | 266 | 0.36 | <0.0001 | <0.0001 | <0.0001 | 0.25 | <0.0001 |
| H+ | 735 | 490 | 0.56 | 0.0015 | <0.0001 | <0.0001 | 0.56 | <0.0001 |
| K+ | 736 | 490 | 0.77 | 0.0048 | <0.0001 | <0.0001 | 0.90 | <0.0001 |
| Mg2+ | 736 | 490 | 0.21 | 0.0005 | <0.0001 | <0.0001 | 0.025 | <0.0001 |
| Ca2+ | 736 | 490 | 0.68 | 0.57 | <0.0001 | <0.0001 | 0.042 | <0.0001 |
| Al | 735 | 489 | 0.98 | 0.026 | <0.0001 | <0.0001 | 0.28 | 0.0022 |
| Cd | 386 | 214 | 0.46 | 0.0049 | <0.0001 | 0.0006 | 0.19 | 0.049 |
| Zn | 579 | 218 | 0.21 | 0.0043 | <0.0001 | <0.0001 | 0.46 | 0.40 |
| NH4+-N | 734 | 487 | 0.30 | 0.028 | <0.0001 | <0.0001 | 0.39 | 0.0048 |
| NO3--N | 710 | 487 | 0.0039 | 0.0013 | <0.0001 | <0.0001 | 0.0002 | 0.0009 |
| SO42--S | 735 | 485 | 0.65 | 0.014 | <0.0001 | <0.0001 | 0.29 | <0.0001 |
| Cl- | 735 | 485 | 0.028 | 0.0008 | <0.0001 | <0.0001 | 0.84 | 0.020 |
At Turbo, all variables except the Ca2+ concentration were affected by residue treatment (αi) (Table 3); differences in concentration were detected between the 4LR treatment and one or more treatments with the highest concentration associated with the 4LR treatment for all variables except SO42--S (Figs. 1–3). For SO42--S, differences were found between the 4LR (lsm 1.2 mg l–1) and the 1Needle_20 (lsm 2.7 mg l–1) and 8Needle_20 (lsm 2.4 mg l–1) treatments, respectively. The pH in the 4LR treatment tended to be lower than in all other treatments (Fig. 1); significant differences between treatments were detected without exceptions. The concentrations of respectively K+, Mg2+, Al, Cd, Cl- and NO3--N differed between the 4LR treatment and the 0LR and 1Needle_20 treatments, with the highest concentrations found in the 4LR treatment (Figs. 1–3). For Al, the difference between the 4LR and the 1Needle_20 treatments was nearly significant (p = 0.060). For Mg2+ there was also a difference between the 2LR treatment (lsm 1.2 mg l–1) and the 0LR and 1Needle_20 treatments (lsm 0.84 respectively 0.63 mg l–1), and between the 4LR (lsm 1.7 mg l–1) and 8Needle_7 treatments (lsm 0.83 mg l–1). The Ca2+ concentration showed an interaction between treatment and time but not an overall effect of residue treatment. For NO3--N, there was also a difference between the 0LR and 2LR treatments, with the highest concentration associated with the 2LR treatment (lsm 7.9 mg l–1 compared with 1.2 mg l–1 in 0LR). In the 2LR and 4LR treatments at Turbo, seasonal variations in the NO3--N concentration tended to be consistent between years (Fig. 1). The lsm NO3--N concentration for the 4LR treatment was 18 mg l–1. There was a difference in Cl- concentration between the 4LR treatment (lsm 2.8 mg l–1) and the 8Needle_7 and 8Needle_20 treatments (lsm 0.84 and 0.93 mg l–1 respectively), and between the 0LR and 2LR treatments (lsm 0.73 and 2.0 mg l–1 respectively). Data on Cd, Zn and electrical conductivity were available from the latter part of the study period. There was a difference in Cd concentration between the 4LR treatment and the 0LR, 1Needle_20, 8Needle_7 and 8Needle_20 treatments. The Cd concentration tended to be highest in the 4LR treatment (lsm 0.76 μg l–1 in 4LR, 0.051 μg l–1 in 0LR, 0.093 μg l–1 in 1Needle_20, 0.10 μg l–1 in 8Needle_7 and 0.11 μg l–1 in 8Needle_20). Least-square mean concentrations could not be estimated for Zn using Model 1, and therefore differences between least-square means could not be determined. The average Zn concentration for all treatments varied between 9.3 and 95 μg l–1, with the highest mean concentration found for the 4LR treatment. There was a difference in electrical conductivity between the 4LR treatment and all other treatments, with the highest level associated with the 4LR treatment. Moreover, differences were also found between the 1LR and 2LR treatments, respectively, and the 0LR treatment, and between the 2LR and the 1Needle_20 treatments. Here the highest levels were associated with the 1LR and 2LR treatments. There was an interaction between treatment and time for all variables except Zn (Table 3). All variables showed an effect of time at both Asa and Turbo.
At Asa, the soil-water NO3--N concentration was negatively correlated with soil-water pH for all LR treatments; the Pearson correlation coefficient varied between –0.25 and –0.48 (p < 0.05). At Turbo, negative correlations between NO3--N and pH were detected for all treatments except the 1Needle_20 treatment (p = 0.08); the Pearson correlation coefficient varied between –0.32 and –0.80, showing the highest negative correlation for the 4LR treatment. Furthermore, the soil-water NO3--N concentration was positively correlated with the soil-water Al concentration for all treatments at both sites; the Pearson correlation coefficient varied between 0.81 and 0.91 at Asa and between 0.35 and 0.88 at Turbo. Negative correlations between the Al concentration and pH were found for all treatments and both sites; the Pearson correlation coefficient varied between –0.20 and –0.44 at Asa and between –0.62 and –0.79 at Turbo.
3.2 Soil chemistry
Seven years after the application of logging residues, the dry matter (d.m.) content of the superficial layer still mirrored the amounts of logging residues applied (cf. Fig. 4). At Turbo, the weight of the superficial layer in the 2LR and 4LR treatments was about twice the corresponding values at Asa: 7.8 kg d.m. m–2 and 16 kg d.m. m–2 respectively at Turbo versus 4.4 kg d.m. m–2 and 7.6 kg d.m. m–2 respectively at Asa. The C store in the 2LR and 4LR treatments was significantly different compared with the store in all other treatments (Fig. 4). The N contents of the superficial layer showed a similar pattern at Turbo, but at Asa only the 4LR treatment differed from the other treatments (Fig. 4). The C concentration in the superficial layer was, on average, 48% at Asa and 49% at Turbo. The corresponding N concentrations were 1.2% at Asa and 1.0% at Turbo.
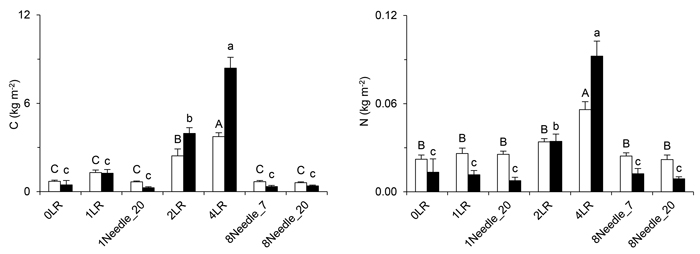
Fig. 4. The stores of C (left) and N (right) in the superficial layer of the studied treatments seven years after application of the logging residues. The superficial layer included remaining logging residues, ground vegetation and all other material above the mor layer. Significant effects of treatment within site are denoted by different letters. Open bars/capitals = Asa, closed bars/lower-case letters = Turbo, error bars = standard error. View larger in new window/tab.
The stores of C, N and P in the mor layer and the upper 20 cm of the mineral soil tended to be higher at Asa than at Turbo, while the stores of Mg2+ and Ca2+ appeared higher at Turbo (Fig. 5). Unlike the stores of Mg2+, there was an effect of residue treatment on the Ca2+ stores at both sites (Fig. 5). Differences in the Ca2+ store were found between the 2LR and 4LR treatments and the 0LR treatment, and at Turbo, also between the 1LR, 1Needle_20 and 8Needle_7 treatments. At Turbo, the K+ store differed between the 0LR and 2LR treatments, while no effect could be found at Asa (Fig. 5). The P store displayed the same pattern but in this case effects were found only at Asa and a difference was detected also between the 0LR and 4LR treatments (Fig. 5). There was no detectable difference in pH between residue treatments in any of the investigated layers. At Turbo, the soil pH was, on average, 4.3 in the mor layer, 4.2 in the 0–10 cm soil layer, and 4.6 in the 10–20 cm soil layer. At Asa, the corresponding pH-values were 4.2, 4.3, and 4.6, respectively.
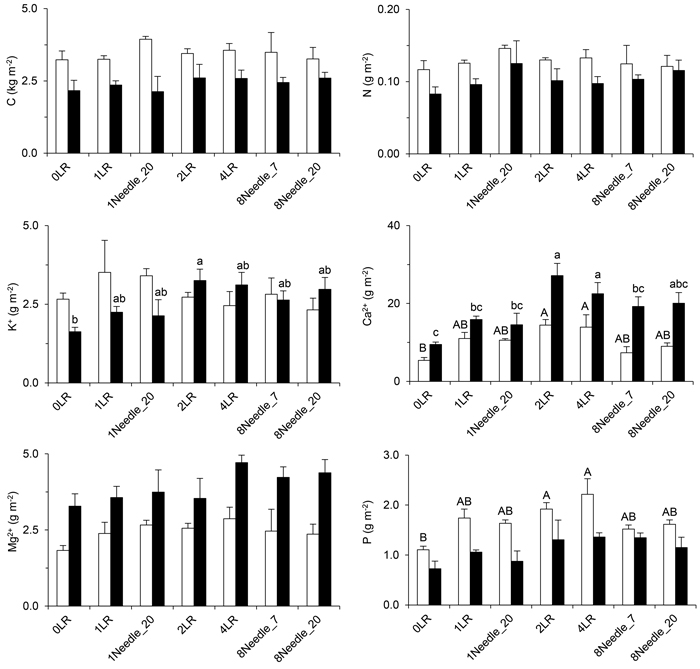
Fig. 5. The stores of total C, total N, and exchangeable K+, Mg2+, Ca2+ and P in the mor layer and 0–20 cm of the mineral soil of the studied treatments seven years after application of the logging residues. Significant effects of treatment within site are denoted by different letters. If no significant treatment effect was detected, no letters are presented. Open bars/capitals = Asa, closed bars/lower-case letters = Turbo, error bars = standard error. View larger in new window/tab.
3.3 Ground vegetation
The total cover of ground vegetation at Turbo was affected by treatment (p < 0.0001), time (p < 0.0001) and interaction between treatment and time (p = 0.0065). There was a difference in cover between both the 0LR and 1Needle_20 treatments, and the 2LR, 4LR and 8Needle_20 treatments (Fig. 6). Differences were also found between the 4LR treatment and the 1LR and the 8Needle_7 treatments respectively, and between the 2LR and 8Needle_7 treatments. At Asa, there was a difference in total cover between the 4LR treatment and all other treatments except the 1LR treatment (p = 0.058)(Fig. 6).
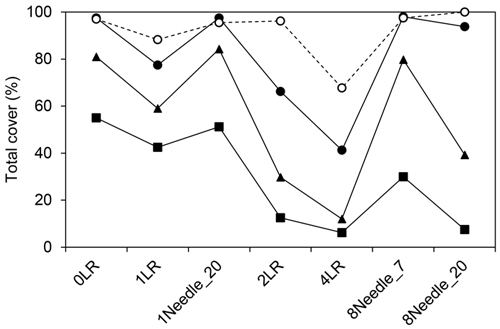
Fig. 6. Total cover of the ground vegetation (least-square means) representing the studied logging-residue treatments (on the x-axis) at Turbo on 27 Aug. 2002 (-■-), 5 Sep. 2003 (-▲-) and 6 Aug. 2006 (-●-), and at Asa on 9 Sep. 2006 (- -○- -).
3.4 Water flux
The seasonal water flux at Asa was affected by treatment (αi) in 2001, 2002 and 2003. In 2001, there was a significant difference in water flux between all treatments, except between the 2LR and 4LR treatments. In 2002, differences were detected between the 0LR treatment and the 2LR and 4LR treatments, respectively, and between the 1LR and 4LR treatments. In 2003, differences were found between the 4LR treatment and the 0LR, 1LR and 2LR treatments, respectively. Furthermore, a difference was indicated between the 1LR and 2LR treatments (p = 0.05). The water flux generally decreased with increasing amounts of logging residues. In 2001, the water flux relative to the precipitation (349 mm between May and mid-September) recorded nearby corresponded to approximately 85% in the 0LR treatment, 50% in the 1LR treatment, 33% in the 2LR and 4LR treatments and 13% in the 8Needle_20 treatment. In 2002 the corresponding figures were 66% in the 0LR treatment, 54% in the 1LR treatment, 41% in the 2LR treatment and 28% in the 4LR treatment, and in 2003, 61% in the 0LR and 1LR treatments, 45% in the 2LR treatment and 24% in the 4LR treatment. The precipitation was 574 mm in 2002 (between Feb. and the end of Oct.) and 565 mm in 2003 (between Feb. and mid-Nov.).
3.5 Soil temperature
During the period June to August 2001, the mean temperature below the mor layer was 14.4 °C in the 0LR treatment. The corresponding mean temperatures were lower in soil which was covered by logging residues; 1.5 °C lower in 1LR, 2.0 °C lower in 2LR, 2.7 °C lower in 4LR and 2.6 °C lower in 8Needle_20 compared with the 0LR treatment. A similar pattern was found for the summer mean temperatures recorded in 2002. During the period November to January 2001, the mean temperature in the 0LR treatment was 1.6 °C. In soil covered by logging residues the mean temperature was higher; 0.74 °C higher in 1LR, 1.1 °C higher in 2LR and 1.5 °C higher in 4LR compared with the 0LR treatment; these differences were smaller in 2002 (0.30 °C in 1LR and 2LR, and 0.64 °C in 4LR).
4 Discussion
The soil-water chemistry was affected by the residue treatments, but the response tended to differ between the sites. Contrary to our hypothesis, the strongest response was found at Turbo, where the N-deposition rate was roughly half that at Asa. Few and rather small effects were detected at Asa (Figs. 1–3). At Turbo, the strong effect associated with the 4LR treatment stood out in comparison with the other treatments. Also at Asa, the detected effects were associated with the 4LR treatment, but here the effect was less pronounced. At Turbo, the concentrations of NO3--N, Al and K+ in the soil water tended to increase with increasing amounts of logging residues permanently left on site as anticipated, but not at Asa (Figs. 1–2). Increased nitrification rates, and the associated production of H+ can, in combination with elevated nitrate leaching, affect the concentration and leaching of other ions such as Al and Cd (Berggren 1992; Bergkvist 2001). After final felling on N-limited forest sites, a strong negative correlation between NO3- and pH in soil water could indicate that much of the NO3- has been formed by nitrification (cf. Ring 2004; Ring et al. 2013). In the present study, negative correlations between NO3- and pH were detected at both sites, suggesting that some of the NO3- in the soil water originated from nitrification. The correlations tended to be stronger at Turbo, which could suggest that nitrification played a bigger part at this site than at Asa. Both the NO3- concentration and pH were affected by treatment at Turbo according to Model 1, while at Asa only the NO3- concentration showed an effect of treatment (Table 2). Since there is no N chemistry data for the water collected below the logging residues or assessments of microbial activity, we cannot determine the exact origin of the NO3- found in the soil water. In a study from Finland, piles of logging residue were found to be a minor source of inorganic N, but a significant source of organic N (Wall 2008).
The high NO3- concentrations found in the 4LR treatment at Turbo seems to have been caused by a high rate of nitrification, given the strong correlation between NO3- and pH, and possibly a lower rate of revegetation (Fig. 6). At Asa, the 4LR treatment did not affect the NO3- concentration as strongly as at Turbo. One contributing factor could be the indicated difference in the decomposition of the logging residues. In the treatments having the strongest effect on soil-water chemistry at Turbo, the 2LR and 4LR treatments, the weight of the superficial layer (including logging residues, ground vegetation and all other material above the mor layer) was roughly twice the weight at Asa (cf. Fig. 4), despite the similar LR amounts applied (Table 2). One explanation could be that the branches may generally have been coarser at Turbo than at Asa (cf. Hyvönen et al. 2000). The residues at Turbo came from both P. abies (approx. 81%) and Pinus sylvestris L. (19%), while the residues at Asa came from a pure stand of P. abies, which was about 30 years younger than the stand at Turbo (70 and 100 years old, respectively). The indicated difference in the decomposition of the logging residues between sites could have affected percolation, decomposition of organic matter in the soil, nitrification, the vegetation uptake rate, and consequently the soil-water chemistry.
In the 4LR treatment at Turbo, the highest Al concentrations were observed in the third season after treatment, while the K+ concentration rose with time, reaching extremely high concentrations in the fifth season (Fig. 2). The soil store of K+ in the 2LR treatment at Turbo was different from the store in the 0LR treatment, while no significant difference could be detected for the 4LR treatment (Fig. 5). Rapid leaching of K+ from logging residues or needles has been observed following harvesting (Johansson 1994; Wall 2008) and in runoff from harvested catchments (Adamson and Hornung 1990; Neal et al. 1994; Löfgren et al. 2009). A low water flow through the logging residues in the 4LR treatment in combination with high concentrations of NO3- may have contributed to the steadily increasing soil-water concentration of K+ at Turbo (Fig. 2), given the effects on the water flux recorded at Asa (see 3.4).
The studied treatments did not significantly affect the soil pH and the soil stores of C, N, and exchangeable Mg2+ at Asa and Turbo. The effects on the stores of exchangeable K+, Ca2+ and P appeared to differ between the sites (Fig. 5). In the present study, the estimated nutrient contents of the logging residues were of significant magnitude in comparison with the corresponding exchangeable stores in the upper soil. Yet there was no general increase in the soil stores of exchangeable K+, Mg2+, Ca2+ and P with increasing residue amount as hypothesized. Furthermore, the soil stores of Ca2+ increased in the 2LR and 4LR treatments compared with the 0LR treatment, while no overall effect of treatment could be detected for the Ca2+ concentration in the soil water during preceding years (Table 2). Zetterberg et al. (2013) detected lower Ca2+ concentrations in the soil water collected in whole-tree harvested plots than in stem-only harvested plots 27–30 years after harvesting. The soil stores of Mg2+ were not significantly affected by treatment (Fig. 5), while effects on the Mg2+ concentration in the soil water were detected (Fig. 2). Thus, there were no simple relationships between the soil stores of exchangeable K+, Mg2+ and Ca2+ and the corresponding concentrations in the soil water.
In the first two to three seasons, the water flux through the logging residues decreased with increasing residue amount as hypothesized. Similar results have previously been reported (Jansson 1987; Rosén and Lundmark-Thelin 1987; Wall 2008). As long as the logging residues retain their structure and the vegetation is sparse, the presence of residues probably increases evapotranspiration by increasing the interception capacity and surface roughness, thus, reducing the water influx to the soil. The soil temperature data indicated that the logging residues insulated the soil, resulting in lower soil temperatures during the warm season and higher temperatures during the cold season. The insulating effect of logging residues has also been observed in other studies (Proe et al. 2001; Harrington et al. 2013). At Asa, the insulating effect appeared to increase with increasing amounts of logging residues up to 4LR.
The leaching below the major part of the rooting zone is determined by the vertical water flux and the concentration in the soil water. The water influx to the soil indicated that the vertical water flux below the rooting zone would decrease with increasing amounts of logging residues. However, the evapotranspiration from ground vegetation may have decreased with increasing residue amounts (Fig. 6), thus, possibly evening out differences in water flux between residue treatments to an unknown degree (cf. Harrington et al. 2013). Provided that there was a difference in the vertical water flux below the rooting zone, this would have affected the leaching rates at Asa and Turbo. For instance, the leaching rates for variables showing rising concentrations with increasing residue amounts would be mitigated by lower water fluxes. However, a rise in concentration could also be caused by lower water fluxes, since lower water fluxes are likely to decrease soil-moisture contents.
This study showed that the amounts of logging residues left on the ground may affect the soil and the soil-water chemistry, the total ground vegetation cover and the water flux through the residues. However, the response in soil-water chemistry was more pronounced at one of our study sites, the Turbo site. Although the N deposition at Asa was roughly twice the rate at Turbo, the N deposition was low at both sites from an international perspective (Gundersen et al. 2006). Laurén et al. (2008) concluded that harvesting logging residues in areas with low N deposition seemed ineffective in reducing N export in comparison with stem-only harvesting. We conclude that the reported effects of the LR treatments on soil-solution chemistry largely appear to be driven by changes in N cycling and hydrology. The leaching from the logging residues was not measured, but it seems possible that the K+ found in very high concentrations in the 4LR treatment at Turbo had leached from the logging residues (cf. Wall 2008) and then become concentrated due to low water flows through the logging residues. The indicated difference in the decomposition of the logging residues between sites could have affected percolation, decomposition of organic matter in the soil, nitrification, the vegetation uptake rate, and consequently the soil-water chemistry. However, since all these processes are interconnected the exact mechanisms remain unknown. Although strong effects on the soil-solution chemistry were detected in the 2LR and 4LR treatments at the Turbo site, the effect on the leaching from an entire regeneration area is likely to be relatively small given the percentage of the area hosting these logging residue amounts, i.e. about 20% after stem-only harvesting and 9% after fuel-adapted felling (Jacobson and Filipsson 2013).
Acknowledgements
We would like to thank the land owners, Bergvik Skog and Sveaskog, for hosting the field experiments; Hagos Lundström, Sten Nordlund, Jörgen Filipson, Ann-Britt Karlsson, Henrik Persson and Olle Rosenberg for sampling and other field work; Ola Langvall, SLU, for providing weather data; and Gunnar Jansson for statistical advice. The statistical analyses were performed using SAS software. Copyright, SAS Institute Inc. SAS and all other SAS Institute Inc. product or service names are registered trademarks or trademarks of SAS Institute Inc., Cary, NC, USA. The study was funded by the Swedish Energy Agency (projects 12699-1 and 30636-1), Future Forests - a multi-disciplinary research program supported by the Foundation for Strategic Environmental Research, the Swedish Forestry, SLU, Umeå University, and Skogforsk, and Skogforsk´s framework program.
References
Adamson J.K., Hornung M. (1990). The effect of clearfelling a Sitka spruce (Picea sitchensis) plantation on solute concentrations in drainage water. Journal of Hydrology 116: 287–297. http://dx.doi.org/10.1016/0022-1694(90)90128-K.
Alexandersson H., Eggertsson Karlström C. (2001). Temperaturen och nederbörden i Sverige 1961–1990. Referensnormaler – utgåva 2. SMHI Meteorologi 99. Swedish Meteorological and Hydrological Institute.
Baskerville G.L. (1972). Use of logarithmic regression in the estimation of plant biomass. Canadian Journal of Forest Research 2: 49–53. http://dx.doi.org/10.1139/x72-009.
Berggren D. (1992). Speciation and mobilization of aluminium and cadmium in podzols and cambisols of S. Sweden. Water, Air, and Soil Pollution 62: 125–156. http://dx.doi.org/10.1007/BF00478457.
Bergkvist B. (2001). Changing of lead and cadmium pools of Swedish forest soils. Water, Air and Soil Pollution: Focus 1: 371–383. http://dx.doi.org/10.1023/A%3A1017522119797.
Devine W.D., Footen P.W., Strahm B.D., Harrison R.B., Terry T.A., Harrington T.B. (2012). Nitrogen leaching following whole-tree and bole-only harvests on two contrasting Pacific Northwest sites. Forest Ecology and Management 267: 7–17. http://dx.doi.org/10.1016/j.foreco.2011.11.043.
Emmett B.A., Anderson J.M., Hornung M. (1991). The controls on dissolved nitrogen losses following two intensities of harvesting in a Sitka spruce forest (N. Wales). Forest Ecology and Management 41: 65–80. http://dx.doi.org/10.1016/0378-1127(91)90119-G.
Fahey T.J., Hill M.O., Stevens P.A., Hornung M., Rowland P. (1991). Nutrient accumulation in vegetation following conventional and whole-tree harvest of sitka spruce plantations in north Wales. Forestry 64: 271–288. http://dx.doi.org/10.1093/forestry/64.3.271.
Finnish Forest Research Institute (2014). Finnish statistical yearbook of forestry 2013. http://www.metla.fi/julkaisut/metsatilastollinenvsk/index-en.htm.
Gundersen P., Schmidt I.K., Raulund-Rasmussen K. (2006). Leaching of nitrate from temperate forests - effects of air pollution and forest management. Environmental Reviews 14: 1–57. http://dx.doi.org/10.1139/a05-015.
Harrington T.B., Slesak R.A., Schoenholtz S.H. (2013). Variation in logging debris cover influences competitor abundance, resource availability, and early growth of planted Douglas-fir. Forest Ecology and Management 296: 41–52. http://dx.doi.org/10.1016/j.foreco.2013.01.033.
Hedwall P.-O., Grip H., Linder S., Lövdahl L., Nilsson U., Bergh J. (2013). Effects of clear-cutting and slash removal on soil water chemistry and forest-floor vegetation in a nutrient optimised Norway spruce stand. Silva Fennica 47(2) article 933. 16 p. http://dx.doi.org/10.14214/sf.933.
Hyvönen R., Olsson B.A., Lundkvist H., Staaf H. (2000). Decomposition and nutrient release from Picea abies (L.) Karst. and Pinus sylvestris L. logging residues. Forest Ecology and Management 126: 97–112. http://dx.doi.org/10.1016/S0378-1127(99)00092-4.
Jacobson S., Filipsson J. (2013). Spatial distribution of logging residues after final felling - comparison between forest fuel adapted final felling and conventional final felling methods. The Forestry Research Institute of Sweden. Report No. 797. 19 p.
Jacobson S., Mattsson S. (1998). Snurran – an Excel program for calculating site nutrient levels in logging residue. The Forestry Research Institute of Sweden. Report No.1. 4 p. [In Swedish with English summary].
Jansson P.-E. (1987). Simulated soil temperature and moisture at a clearcutting in central Sweden. Scandinavian Journal of Forest Research 2: 127–140. http://dx.doi.org/10.1080/02827588709382452.
Johansson M.-B. (1994). The influence of soil scarification on the turn-over rate of slash needles and nutrient release. Scandinavian Journal of Forest Research 9: 170–179. http://dx.doi.org/10.1080/02827589409382828.
Kaarakka L., Tamminen P., Saarsalmi A., Kukkola M., Helmisaari H.-S., Burton A.J. (2014). Effects of repeated whole-tree harvesting on soil properties and tree growth in a Norway spruce (Picea abies (L.) Karst.) stand. Forest Ecology and Management 313: 180–187. http://dx.doi.org/10.1016/j.foreco.2013.11.009.
Kreutzweiser D.P., Hazlett P.W., Gunn J.M. (2008). Logging impacts on the biogeochemistry of boreal forest soils and nutrient export to aquatic systems: a review. Environmental Reviews 16: 157–179. http://dx.doi.org/10.1139/a08-006.
Kriebitzsch W.U. (1978). Stickstoffnachlieferung in sauren Waldböden Nordwestdeutschlands. Scripta Geobotanica 14: 1–66.
Laurén A., Sikanen L., Asikainen A., Koivusalo H., Palviainen M., Kokkonen T., Kellomäki S., Finér L. (2008). Impacts of logging residue and stump removal on nitrogen export to a stream: a modelling approach. Scandinavian Journal of Forest Research 23: 227–235. http://dx.doi.org/10.1080/02827580802116184.
Löfgren S., Ring E., von Brömssen C., Sørensen R., Högbom L. (2009). Short-term effects of clear-cutting on the water chemistry in two boreal streams in northern Sweden: a paired catchment study. Ambio 38: 347–356. http://dx.doi.org/10.1579/0044-7447-38.7.347.
Lundborg A. (1997). Reducing the nitrogen load: whole-tree harvesting. Ambio 26: 387–393.
Marklund L.-G. (1988). Biomass functions for pine, spruce and birch in Sweden. Department of Forest Survey, Swedish University of Agricultural Sciences, Umeå. Report No. 45. 73 p. ISBN 91-576-3524-2. [In Swedish with English summary].
Neal C., Neal M., Ryland G.P., Jeffery H.A., Harrow M., Hill S., Smith C.J. (1994). Chemical variations in near surface drainage water for an acidic spruce forested UK upland area subjected to timber harvesting: inferences on cation exchange processes in the soil. The Science of the Total Environment 154: 47–61. http://dx.doi.org/10.1016/0048-9697(94)90613-0.
Nykvist N., Rosén K. (1985). Effect of clear-felling and slash removal on the acidity of northern coniferous soils. Forest Ecology and Management 11: 157–169. http://dx.doi.org/10.1016/0378-1127(85)90024-6.
Palviainen M., Finér L. (2011). Estimation of nutrient removals in stem-only and whole-tree harvesting of Scots pine, Norway spruce, and birch stands with generalized nutrient equations. European Journal of Forest Research 131: 945–964. http://dx.doi.org/10.1007/s10342-011-0567-4.
Pettersson M., Nordfjell T. (2007). Fuel quality changes during seasonal storage of compacted logging residues and young trees. Biomass and Bioenergy 31: 782–792. http://dx.doi.org/10.1016/j.biombioe.2007.01.009.
Proe M.F., Griffiths J.H., McKay H.M. (2001). Effect of whole-tree harvesting on microclimate during establishment of second rotation forestry. Agricultural and Forest Meteorology 110: 141–154. http://dx.doi.org/10.1016/S0168-1923(01)00285-4.
Ring E. (2004). Experimental N fertilization of Scots pine: effects on soil-solution chemistry 8 years after final felling. Forest Ecology and Management 188: 91–99.
Ring E., Högbom L., Nohrstedt H.-Ö. (2001). Effects of brash removal after clear felling on soil and soil-solution chemistry and field-layer biomass in an experimental nitrogen gradient. TheScientificWorldJournal 1(S2): 457–466. http://dx.doi.org/10.1100/tsw.2001.93.
Ring E., Högbom L., Andersson S., Weslien J. (2013). Soil and soil-solution chemistry after burning a clear-felled area in boreal Sweden. Scandinavian Journal of Forest Research 28: 735–745.
Roberts S.D., Harrington C.A., Terry T.A. (2005). Harvest residue and competing vegetation affect soil moisture, soil temperature, N availability, and Douglas-fir seedling growth. Forest Ecology and Management 205: 333–350. http://dx.doi.org/10.1016/j.foreco.2004.10.036.
Rosén K., Lundmark-Thelin A. (1987). Increased nitrogen leaching under piles of slash - a consequence of modern forest harvesting techniques. Scandinavian Journal of Forest Research 2: 21–29. http://dx.doi.org/10.1080/02827588709382443.
Schütt M., Borken W., Spott O., Stange C.F., Matzner E. (2014a). Temperature sensitivity of C and N mineralization in temperate forest soils at low temperatures. Soil Biology and Biochemistry 69: 320–327. http://dx.doi.org/10.1016/j.soilbio.2013.11.014.
Schütt M., Borken W., Spott O., Stange C.F., Matzner E. (2014b). Corrigendum “Temperature sensitivity of C and N mineralization in temperate forest soils at low temperatures”. Soil Biology and Biochemistry 77: 315. http://dx.doi.org/10.1016/j.soilbio.2014.06.001.
Slesak R.A., Schoenholtz S.H., Harrington T.B., Strahm B.D. (2009). Dissolved carbon and nitrogen leaching following variable logging-debris retention and competing-vegetation control in Douglas-fir plantations of western Oregon and Washington. Canadian Journal of Forest Research 39: 1484–1497. http://dx.doi.org/10.1139/x09-067.
Staaf H., Olsson B.A. (1994). Effects of slash removal and stump harvesting on soil water chemistry in a clearcutting in SW Sweden. Scandinavian Journal of Forest Research 9: 305–310. http://dx.doi.org/10.1080/02827589409382844.
Stevens P.A., Hornung M. (1990). Effect of harvest intensity and ground flora establishment on inorganic-N leaching from a Sitka spruce plantation in north Wales, UK. Biogeochemistry 10: 53–65. http://dx.doi.org/10.1007/BF00000892.
Swedish Forest Agency (2013). Swedish Statistical Yearbook of Forestry 2013. Jönköping. 376 p.
Thiffault E., Hannam K.D., Paré D., Titus B.D., Hazlett P.W., Maynard D.G., Brais S. (2011). Effects of forest biomass harvesting on soil productivity in boreal and temperate forests – a review. Environmental Reviews 19: 278–309. http://dx.doi.org/10.1139/a11-009.
Wall A. (2008). Effect of removal of logging residue on nutrient leaching and nutrient pools in the soil after clearcutting in a Norway spruce stand. Forest Ecology and Management 256: 1372–1383. http://dx.doi.org/10.1016/j.foreco.2008.06.044.
Weetman G.F., Webber B. (1972). The influence of wood harvesting on the nutrient status of two spruce stands. Canadian Journal of Forest Research 2: 351–369. http://dx.doi.org/10.1139/x72-054.
Zetterberg T., Olsson B.A., Löfgren S., von Brömssen C., Brandtberg P.-O. (2013). The effect of harvest intensity on long-term calcium dynamics in soil and soil solution at three coniferous sites in Sweden. Forest Ecology and Management 302: 280–294. http://dx.doi.org/10.1016/j.foreco.2013.03.030.
Total of 44 references
