Thomas Kronholm  ,
Erik Anerud,
Dan Bergström
,
Erik Anerud,
Dan Bergström
Swedish energy plants’ practices and development needs for storage, handling, monitoring and inventory of biofuels
Kronholm T., Anerud E., Bergström D. (2026). Swedish energy plants’ practices and development needs for storage, handling, monitoring and inventory of biofuels. Silva Fennica vol. 60 no. 2 article id 25047. https://doi.org/10.14214/sf.25047
Highlights
- Minimizing storage time is the most common measure taken to avoid storage losses
- Few cover fuel stacks despite it being considered effective in reducing storage losses
- Monitoring fuel quantity and fire risks during storage is often done through subjective methods
- The greatest development needs are perceived to be in techniques and methods for inventorying stocks and fuel qualities.
Abstract
Better understanding of the energy plants´ biofuel management and storage strategies, and technologies used for monitoring and forecasting fuel requirements and fuel quality at the energy plants, would facilitate possibilities to direct research and development efforts to promote increase of their efficiency and sustainability in the Swedish energy system. The objectives were therefore to 1) survey Swedish energy plants’ use of current practices for handling, storage, monitoring and inventory of solid biofuels at their feed-in terminals and industry fuel yards and 2) analyse how their current storage management actions taken match with their perceived effectiveness of actions and development needs and theory. The survey shows for example that most fuel transport occurs via truck, and supply contracts commonly span one to two years. While 43% of companies perform their own quality measurements upon delivery, a substantial 37% of respondents were unable to estimate their average annual storage losses. Subjective estimation is the most prevalent method for determining fuel quantity and fire risk during storage. Minimizing storage time was identified as the most effective measure to reduce storage losses. However, we found major gaps between theory and practice. Many energy plants demonstrate a foundational understanding of fuel logistics, but there are significant opportunities for enhancing efficiency and sustainability, by for example: implementing more robust systems for tracking and quantifying storage losses; exploring and integrating advanced technologies for inventory management. Thus, a more data-driven and technologically integrated approach to forest fuel management is crucial for Swedish energy plants to further enhance their resource efficiency, reduce climate impact, and ensure a predictable and cost-effective supply of bioenergy.
Keywords
biomass;
forest fuels;
bioenergy;
chips;
CHP;
fuel yard;
heating plant
-
Kronholm,
Department of Forest Bioeconomy and Technology, Swedish University of Agricultural Sciences, SE-90183 Umeå, Sweden
 https://orcid.org/0000-0002-7066-0667
E-mail
thomas.kronholm@slu.se
https://orcid.org/0000-0002-7066-0667
E-mail
thomas.kronholm@slu.se
-
Anerud,
Department of Forest Bioeconomy and Technology, Swedish University of Agricultural Sciences, SE-90183 Umeå, Sweden
https://orcid.org/0000-0002-4751-2439
E-mail
erik.anerud1@gmail.com
-
Bergström,
Department of Forest Bioeconomy and Technology, Swedish University of Agricultural Sciences, SE-90183 Umeå, Sweden
https://orcid.org/0000-0002-5729-683X
E-mail
dan.bergstrom@slu.se
Received 9 September 2025 Accepted 9 April 2026 Published 27 April 2026
Views 4298
Available at https://doi.org/10.14214/sf.25047 | Download PDF

Supplementary Files
1 Introduction
In Sweden, the total energy supply was 507 terawatt hours (TWh) in 2023, of which biofuels stood for 150 TWh and of the biofuels, non-refined wood fuels stood for 55 TWh (Swedish Energy Agency 2025). The non-refined wood fuels mainly constitute of municipal waste, industrial waste and black liquor (64%), secondly of primary forest fuels (21%), such as logging residues (tops and branches) and fuelwood (discharged roundwood and small-diameter trees) from harvesting operations. The rest constitutes of secondary forest industry fuels, such as bark (10%), shavings and sawdust (3%) and briquettes and pellets (3%). These residue fuels are produced throughout the year and are, together with recycled wood, the main feedstock for heating plants and heat and power plants (CHP) (from here on together named as energy plants) in Sweden. The fuel load at energy plants follows the domestic heat demand with peaks in the wintertime, which creates an unbalance between supply and demand of biofuels. Biofuels therefore need to be seasonally stored at e.g. forest roadside landing, saw-mill yard, a terminal or at the energy plant (production site).
In general, storage of biomass is a trade-off between moisture content reduction by natural drying and dry matter losses (DML) due to degradation, where the DML, especially if the biomass is comminuted, are heavily affected by the biomass particle size, concentration of sugars and nitrogen, temperature and moisture content (Krigstin and Wetzel 2016). DML between 2–4% per month of storage have been reported for chipped logging residues (Afzal et al. 2010; Anerud et al. 2018). However, by implementing measures such as limiting the storage pile height (Jirjis 2005; Alakoski et al. 2016), not mixing different fuel qualities in the same pile (Jirjis and Lehtikangas 1992), covering piles with a permeable tarp (Wetzel et al. 2017; Anerud et al. 2018; Kuptz et al. 2020) and screening off fine particles from chips prior to storage (Anerud et al. 2022), DML of biofuels at storage can be significantly reduced. The logging residues, which due to needles and twigs have high nutrient content, are therefore commonly piled and covered at the forest roadside landing and seasonally stored to reduce moisture content prior to being chipped, transported and further stored at a terminal or the energy production site (Routa et al. 2013). Thus, storage strategies that result in increased storability are a central part of the system’s profitability and climate benefit. However, achieving a cost-effective and sustainable system requires a resource-efficient and more predictable production and supply chain, where flows and quality can be customized based on needs and at the same time managed more efficiently to increase the utilization rate of storage space. As shown by Niinistö et al. (2025), energy wood suppliers in Finland currently utilize less than half of the available storage capacity at terminals.
The energy plant’s ability and capacity to produce and store the biofuel at the industry site dictate the design of the up-stream forest fuel production system and supply strategies (Eriksson 2016). For example, some heating plants allocated in populated areas and with minimum site area size heavily rely on just-in-time deliveries. These heating plants must have frequent deliveries of chipped fuels due to limited storage capacity and restrictions in fuel production operations on site, which cause noise and dust pollutions. On the other hand, large CHPs, allocated outside populated areas, may be able to receive many types of qualities, e.g. unprocessed logging residues and recycled wood, fuel wood and chipped biofuels, due to ability to produce the fuel on site and high storage capacities (Awais et al. 2021). In terms of secure bioenergy supply, the ability to maintain several months of buffer storage makes them less sensitive to up-stream interruptions in the fuel supply compared to those that rely on just-in-time deliveries.
Due to the spatial distribution and low density of forest fuels, effective transportation to energy plants is crucial for high cost-efficiency and low CO2 emissions (Wolfsmayr and Rauch 2014). This implies a trade-off between chipping at the forest roadside landing, to increase density before transportation, versus more efficient chipping at an industry site, or at a terminal located in between (Awais et al. 2021). The use of terminals increases, however, forest fuel supply costs, when compared to direct supply, by 1.4% (Väätäinen et al. 2017) to 5–11% (Fernandez-Lacruz et al. 2019), but increases the security of supply to energy plants (Väätäinen et al. 2017; Fernandez-Lacruz et al. 2019). Kühmaier et al. (2016) compared different terminal layouts for forest fuel storage and fuel production (chipping and screening) and found, from an economic point of view, that the main influencing factors are investments in the infrastructure, labour, opportunity costs and DML. Kons et al. (2014) surveyed the characteristics of Swedish forest biomass terminals that supply the energy plants with fuels, and showed that terminals of <2 ha, <5 ha, and <10 ha accounted for 35%, 64%, and 78%, respectively, of Sweden’s total terminal area. Comminution was performed at 90% of the terminals. Fuelwood accounted for 63% of the total biomass followed by chipped logging residues, loose logging residues and bark, in decreasing order. Stock levels were commonly inventoried once a month or 3–4 times per year and stock monitoring by visual inspection was used at 60% of all <2 ha terminals and at 59% of those in the 2 ≤ 5 ha class. Wheel loaders were used at 78–92% of the terminals and were the most common piece of equipment used.
Better understanding of the energy plants’ biofuel management and storage strategies, and technologies used for monitoring and forecasting fuel requirements and fuel quality at the energy plants, would facilitate possibilities to direct research and development efforts to promote increase of their efficiency and sustainability in the Swedish energy system. Specifically, knowledge of energy plants fuel demand and deliveries, storage practices and infrastructure, and practices used for stock inventory, would be valuable in order to reliably model e.g. DML during storage at energy plants. However, in the reported literature, the focus has been on upstream logistics, and little effort has been taken to survey biofuel management practices at energy plant production sites and their feed-in terminals. Such knowledge would also make it possible to model the whole supply chain which in turn renders overall optimization research and development.
The objectives were therefore to 1) survey Swedish energy plants’ use of current practices for handling, storage, monitoring and inventory of solid biofuels at their feed-in terminals and industry fuel yards and 2) analyse how their current storage management actions taken match with their perceived effectiveness of actions and development needs and theory.
2 Materials and methods
This study is based on a survey targeted to commercial energy producers in Sweden. No sensitive personal data would be collected or processed in this study, meaning that no formal ethics review of the study was required under Swedish regulations.
2.1 Sample
The sample was selected with the help of the member register of Energiföretagen Sverige (Swedenergy), “a non-profit industry and special interest organisation for companies that supply, distribute, sell, and store energy – mainly electricity, heating, and cooling” (Energiföretagen 2023). The member register (last updated September 21, 2023) was retrieved from Swedenergy’s website. The register contained more than 400 entities, but not all were deemed relevant for this study. For example, several of the companies were subsidiaries that only managed sales or power grids. Such companies were removed from the list. In cases where it was not immediately possible to determine the company’s relevance, more information was sought by visiting the company’s website. If it did not appear that the company was a producer of heat or electricity from biofuels, it was removed from the list. After going through this list, the sample was supplemented with some companies that were identified using a list of CHP producers with electricity certificates, which was publicly available on the Swedish Energy Agency’s website. In the end, we had a sample consisting of 157 companies. Our assessment is that this is the majority of the commercial actors in Sweden. We chose not to include small economic associations (cooperatives) and private individuals because these smaller establishments were not deemed relevant from an industrial perspective.
2.2 Data collection
A questionnaire was designed for data collection (Supplementary file S1). It consisted of 25 questions divided into three sections. The first section contained questions about the company’s production capacity, the type of combustion technology they used, and the type of fuel they used. Respondents were asked to provide information about up to six production facilities, and in cases where they had more, it applied to the six largest facilities. The second section contained questions about fuel deliveries, storage practices and infrastructure at production sites and terminals. Finally, the third section contained questions about technologies, methods and systems used for inventory control and monitoring. Many of the questions had given answer options, either on a scale or as multiple choice questions. For other questions, the respondent was asked to fill in percentages, volumes, quantities, areas and the like.
The questionnaire was distributed by mail at the beginning of June 2024. The recipients were informed that participation was voluntary, and they were also given information on how the collected data would be handled. Furthermore, since the letter was addressed to the company, it was not known who the first recipient would be. In the cover letter, the person who opened the letter was therefore instructed to forward it to the person within the company who had the best knowledge of the survey’s question areas. Examples of the type of position that could be relevant were provided to facilitate this action. However, there is an uncertainty as to whether the letter always reached the right person. In addition, a few letters could not be delivered to the specified address.
A total of 31 responses were received. In one case, the same respondent answered for establishments that were formally operated by several separate subsidiaries (all of which had received separate questionnaires). Taking this into account, the response rate was about 20%.
2.3 Analysis
Collected data were compiled and analyzed using the statistical program SPSS (version 29). Since the number of companies participating in the study was small, the possibilities to make group comparisons between different types of companies were limited. Therefore, only descriptive results are reported for some questions, especially those with many alternative answers or few respondents. However, where applicable, responses were compared in relation to the size of the companies or production facilities (measured as the company’s total production or the facility’s total purchased amount of solid fuels) and in which part of the country they were located. For this, Pearson correlation, chi-square tests, t-tests and analysis of variance (ANOVA) were used. The significance level was set at 5%. To get more cases in each group and thus facilitate the analyses, certain response categories were merged into one group before the analysis. For example, the two northernmost regions were merged into one, which was later compared against the southern region. Companies that had facilities in both parts of the country were categorized based on where they had the largest share of their operations.
Using theory and survey results of actions taken and perceived effectiveness of actions of storage management, and perceived development needs of storage management, inventory control and monitoring, we used a matrix-based method executed in four steps to identify any discrepancies and focus efforts on bridging the gap between what is possible (theory; what do scientific models, sustainability principles, and academic research suggest for optimal biofuel management), what is done (current actions taken; what are industries actually doing), and what is wanted (perceived development need; what do the industry think they need to develop). The matrix-based gap-analysis was carried out as follows.
Step 1: We developed the matrix using data on a) to what extent the industry takes various measures to minimize storage losses (indicated on a scale of one to seven) and b) perceived development needs (on a scale from one to five) regarding storage methods, techniques and methods for inventorying stocks, techniques for detecting fire risk etc. Then we marked out combinations (cells) that logically should be correlated. The logic used was that “if performing actions, one is aware of the benefits and therefore interested in research and development”. The counter logic could as well be that “if performing actions, one does not need to make changes (develop)” and even possibly “if not performing actions, one is not aware of consequences and possibly not in research and development need”. However, as we survey an important and wide-spread industry segment, we expect that the first logic phrasing is more likely to be present. Further, we can also expect that “if one is taking actions, one is aware of other actions that can lead to similar results”. For example, if taking actions on “widening of fire breaks” one should then be aware that “stacking against concrete walls” and “minimizing stack height” are actions that promote less fire risk, which could turn up as positive correlations in the matrix.
Step 2: Pearson’s correlation analysis was performed, and the values were entered into the matrix, where both significant and non-significant correlation coefficients of ±0.2 or greater were highlighted.
Step 3: Comparisons were made between respondents’ rankings of actions taken to minimize storage losses and respondents’ rankings of perceived effectiveness of actions to minimize storage losses, and deviations from expectations of correlations were identified. These deviations were indicated on a scale from Small to Extra Large.
Step 4: Based on the results of steps 1–3, gaps between theory, actions taken and perceived effectiveness of actions, deviations from expectations of correlations and development needs were elaborated, were:
• High Gaps indicate major gaps between theory and practice,
• Medium Gaps indicate that current practices struggle to meet both theory and perceived effectiveness of actions or perceived need of development, and
• Alignment indicates areas where theory, current practice and perceived needs of development or perceived effectiveness of actions, align well.
3 Results
3.1 Characteristics of respondents
3.1.1 Capacity
The 31 responding companies had a total of 98 production facilities, of which 96 were included in the material analyzed (i.e. one company had eight facilities, but data was only collected for the six largest). There was an even spread of respondents in terms of the number of facilities, with approximately 20% having one, two, three, four and five or more facilities, respectively. Of the facilities, 64% were in the southern part of Sweden (Götaland), 24% in the central part (Svealand) and 13% in the northern parts of the country (Norrland). Of all production facilities, 74% had no installed capacity for power production, only for heat. Of those that had installed capacity for power production, fifteen had a capacity of less than 10 megawatts (MW), while ten had an installed capacity of at least 10 MW. The installed capacity for heat ranged between 0.2 and 205 MW and for power between 0and 74 MW. The average installed capacity was 24.2 MW and 3.5 MW, respectively. The annual heat production ranged between 0and 540 gigawatt hours (GWh), with an average of 70.1 GWh, and the average power production was 13.1 GWh, ranging between 0and 195 GWh.
3.1.2 Fuel mix
The amount of solid wood fuels purchased ranged from 1 to 800 GWh, with the average amount being 90.9 GWh and the median 31.5 GWh. Looking at all companies, just under half of the purchased solid fuels came from primary forest fuels, a third from secondary forest fuels and the rest from recycled wood and other fuels (Table 1). Among other fuels, pellets and wood powder were mentioned. To study differences between larger and smaller facilities, they were divided into three groups based on their total purchased quantity of solid fuels. There was a significant difference between the group with the largest purchasers and the others regarding the proportion of recycled wood (p < 0.001). A comparison was also made between facilities in the south and those further north, and there was a significant difference for the fuel category “other” where facilities in the south used recycled wood to a higher extent (p = 0.029). It also appeared that in the south, the proportion of primary forest fuels was lower and the proportion of secondary fuels higher than in the north, but these differences were not statistically significant.
| Table 1. Average share (%) of fuel from primary and secondary forest fuels, recycled wood, agricultural fuels and other fuels according to the facilities’ total purchased quantity of solid fuels (Fuel quantity) and geographies. Where there was a significant difference between the groups (p < 0.05), this is indicated by paired letters. South = Götaland, Other = Svealand + Norrland. | |||||||
| Category | Grouping | N | Primary forest fuels (%) | Secondary forest fuels (%) | Recycled wood (%) | Agricultural fuels (%) | Other fuels (%) |
| Fuel quantity | <15 GWh | 32 | 39.2 | 38.3 | 0.0a | 0.0 | 22.5 |
| 15–50 GWh | 24 | 52.2 | 40.6 | 2.1b | 0.3 | 4.9 | |
| >50 GWh | 31 | 49.2 | 19.9 | 20.5a,b | 0.2 | 9.8 | |
| Average | 46.4 | 32.4 | 7.9 | 0.1 | 13.1 | ||
| Geographic location | South | 60 | 41.5 | 35.5 | 5.6 | 0.0 | 17.2c |
| Other | 27 | 57.2 | 25.4 | 12.9 | 0.4 | 4.0c | |
| Average | 46.4 | 32.4 | 7.9 | 0.1 | 13.1 | ||
3.1.3 Combustion technology
The most common combustion technology was the fixed grate bed, which was installed at 49% of the facilities, followed by moving grate (18%) and bubbling fluidized bed (16%). Eleven energy plants (12%) had other combustion technologies installed, such as shaking grates, step grates and burners/oil burners. In addition, six facilities had several different combustion technologies installed. Bubbling fluidized beds were mainly found in larger production facilities (those who purchased more than 50 GWh of solid fuel per year). Medium-sized facilities (15–50 GWh of solid fuel per year) were overrepresented when it came to fixed grate bed, while the smallest (<15 GWh of solid fuel per year) were overrepresented for moving grates.
3.2 Fuel deliveries, storage and infrastructure
3.2.1 Deliveries and storage times
More than half of the respondents stated that comminuted fuel that is delivered or produced during the first quarter of the year is burned within 2 weeks. Moreover, in about 90% of the cases it is burned within 5 weeks (Table 2). On average, the respondents received/produced 38% of the fuel during the first quarter. Storage duration increases during the second quarter and is longest for fuel delivered during the third quarter, when about 86% of the respondents stored the comminuted fuel for at least 5 weeks. However, this is the time of year that companies receive a smaller proportion of the total fuel during a normal year, on average 17% and 12%, respectively. Storage duration decreases during the fourth quarter when three quarters of the respondents stated that fuel delivered in this period is stored for 4 weeks or less. The proportion of fuel normally delivered during this period amounts to a third of annual deliveries.
| Table 2. Proportion (%) of respondents per delivery period and storage time of the fuel. | ||||
| Storage time (weeks) | Time for delivery/production of comminuted fuels | |||
| January–March (n = 28) | April–June (n = 29) | July–September (n = 29) | October–December (n = 28) | |
| <2 | 57.1 | 13.8 | 3.4 | 32.1 |
| 2–4 | 32.1 | 37.9 | 10.3 | 46.4 |
| 5–12 | 7.1 | 20.7 | 62.1 | 17.9 |
| >12 | 3.6 | 27.6 | 24.1 | 3.6 |
3.2.2 Storage
Fifteen respondents (50%) stated that they intermediately store primary forest fuels at their own terminal (or on rented space at someone else’s terminal) before it is delivered to the combustion facility. Three of them temporarily stored all primary fuel, while the twelve others reported shares between 5 and 85%. The average reported proportion for these fifteen respondents was 54%. Thirteen respondents (45%) stated that they intermediately store secondary forest fuels at the terminal. The stated proportion varied between 1 and 50%, with an average proportion of 21%. Thus, across all companies, the average stated proportion that is intermediately stored was 27% for primary fuels and 9% for secondary forest fuels. Moreover, eight respondents stated that their primary forest fuels are at some point stored in non-comminuted form at an intermediate storage terminal, and of these, four stated that the proportion was 100%. The average proportion for the eight companies was 70%, and the average for all companies was 20%.
Ten respondents stated that their primary forest fuels are at some point stored in non-comminuted form at the production site. Of these, one company stores non-comminuted fuel both at the terminal and at the production site, which means that there were a total of seventeen companies that store primary forest fuels in non-comminuted form. The company that did this both at the terminal and at the production site did so to a very low extent, however, since the proportion of primary forest fuels stored was 3 and 2%, respectively. Of the ten, three stated that 100% of the primary forest fuels are at some point stored in non-comminuted form at the production site. The average proportion for the ten was 43%, and the average for all companies was 15%.
There were no significant differences linked to geography or the company’s size of production when it came to terminal usage. However, there was a tendency (p = 0.068) that the companies that stored non-comminuted fuels were larger than companies that did not store non-comminuted fuel, either at a terminal or at the production facility.
3.2.3 Storage area and capacity
Nine companies reported having a storage area at an intermediate storage terminal and the average size of these was 26 350 m2. If we disregard the company that alone accounted for about half of the total storage area, the average was 14 831 m2. The size of the storage areas at the terminal varied from 1800 m2 to 118 500 m2.
Twenty-four companies reported that they had storage space at the production facility. The size of this varied between 240 and 180 000 m2, with an average of 20 793 m2. If we disregard the company with a significantly larger storage than the others (not the same company that had the largest area at the terminal), the average storage space was 13 871 m2.
Twenty-three companies stated their maximum permitted storage capacity for comminuted fuels at the production facility. This ranged from 80 to 200 000 m3, with an average of 26 653 m3. Five of these companies also stated the maximum storage capacity at the terminal, which ranged from 10 000 to 70 000 m3, with an average of 35 400 m3.
There was a fairly high correlation between the company’s size of production and the size of the storage space at the facilities (r = 0.46, p = 0.14), and an even larger correlation between production and the permitted storage capacity for comminuted fuels (r = 0.63, p = 0.001).
3.3 Technology, methods and systems for inventory control and monitoring
3.3.1 Transport
Thirteen companies had provided information on the transport of primary forest fuels from the supplier to the intermediate storage. In all cases except one, these transports were carried out exclusively by truck. In the last case, 94% of the annual delivery volume was carried out by truck and the remaining 6% was delivered to the intermediate storage by boat. When it came to deliveries from the intermediate storage to the production facility, 100% of the transports were carried out by truck. Here, fourteen companies provided information. Transport of primary forest fuels directly from the supplier to the energy plant was carried out almost exclusively by truck. Among the thirty companies that answered this question, there was only one case where 3% of the volume came by boat.
3.3.2 Supply
The largest proportion of fuel (45%) was reported to come from supply contracts with durations of 1–2 years, followed by supply contracts with durations of <1 year (38%) and then contracts with durations of 3–5 years (17%). No one received fuel via contracts with a duration of >5 years. Also, in terms of the number of companies applying certain contract durations, 1–2 years was the most common, with twelve companies exclusively obtaining their fuel via such contracts. This can be compared with eight companies only obtaining their fuel via contracts with terms of <1 year, and three companies obtaining 100% from contracts with a term of 3–5 years. This means that a quarter (26%) of the companies obtained fuel via several different contract categories. It can also be mentioned that 23 companies did not receive fuel at all via 3–5 year contracts, 18 companies received nothing via the shortest contracts, and 13 received nothing via 1–2 year contracts. Compared to other companies, there was no significant difference between those who only had 1–2-year contracts or only shorter contracts regarding geography or size of production.
3.3.3 Monitoring and control of inventories
When purchasing biofuels, the most common method for determining fuel quantity and quality was own measurement at the terminal or industry directly upon delivery, which 43% of respondents stated as most consistent with their approach. Measurement by the seller before delivery was the second most common method (25%), followed by third-party measurement at the terminal/industry (14%) and other methods (14%) such as the buyer making some measurements and the seller making others. Third-party measurement before delivery was applied in only one case.
A majority (60%) of the respondents kept track of their inventory balances through self-designed digital systems, while a smaller proportion (10%) used self-designed paper systems. A couple of companies (7%) had purchased digital systems and three (10%) had other types of systems. For example, Excel documents containing data on weighed in and consumed fuel through production statistics were mentioned, as well as stocktaking of Biometria during the four-month period. Another company explained that counting is done manually by summing up incoming and outgoing fuel and considering any drying. Drone images and an echo sounder were used for measurements and estimates of volumes, as well as visual assessment. In the third case, this was also done through an assessment based on the amount of fuel weighed in. Finally, four companies (13%) stated that they had no system for controlling inventory balances.
Respondents were asked to state how large the annual storage loss is on average in relation to the amount of energy purchased. Just under half of respondents (44%) estimated that the storage losses for all fuels were <5%, while 19% estimated it to be 5–10%. However, a relatively large proportion of respondents (37%) had no opinion on how large the storage losses were. This was even clearer when respondents were asked to give their opinion on primary and secondary forest fuels separately, where fewer gave an answer and among those who responded the proportion who had no opinion was 45%.
Many companies systematically sample and analyze moisture content (71%) and ash content (58%) in connection with the delivery of comminuted fuels (Table 3). Just under half (45%) also systematically measured the heating value in connection with delivery, while only a few companies measured the chip particle size in this systematic way. Sampling during storage or close to combustion was uncommon.
| Table 3. Proportion of respondents (%) who perform various types of quality determinations of comminuted fuels upon delivery, during storage or when about to be combusted. (n = 31). | |||||
| Category | Moisture content | Ash content | Particle size distribution | Energy content | |
| Systematic sampling and analysis in the lab according to accepted methods is done… | …at delivery | 71.0 | 25.8 | 12.9 | 45.2 |
| …during storage | 0.0 | 6.5 | 6.5 | 6.5 | |
| …close to combustion | 3.2 | 9.7 | 0.0 | 9.7 | |
| …not at all | 25.8 | 58.1 | 83.9 | 38.7 | |
| Arbitrary sampling and analysis in the lab according to accepted methods is done… | … at delivery | 9.7 | 12.9 | 6.5 | 19.4 |
| … during storage | 0.0 | 3.2 | 3.2 | 0.0 | |
| … close to combustion | 6.5 | 6.5 | 3.2 | 6.5 | |
| … not at all | 87.1 | 77.4 | 93.5 | 74.2 | |
| Arbitrary sampling and subjective assessment are made… | … at delivery | 16.1 | 0.0 | 19.4 | 3.2 |
| … during storage | 0.0 | 0.0 | 0.0 | 0.0 | |
| … close to combustion | 3.2 | 3.2 | 3.2 | 0.0 | |
| … not at all | 80.6 | 96.8 | 77.4 | 96.8 | |
In general, a subjective estimate, i.e. no measurement but more of a guess, was the most common method for determining fuel quantity and fire risk during storage (Table 4). Remote sensing with drones was applied by one third of the companies for measuring the stacked volume of comminuted fuels, but not at all for non-comminuted fuels. One tenth used the same measurement method to assess the fire risk in stacks of comminuted fuels. Manual measurement with analogue measurement systems at the stack (e.g. measuring rods and tape measures) occurred more often than manual measurement with digital remote sensing measurement systems (e.g. thermal imaging camera). To assess the temperature and fire risk in stacks of non-comminuted fuels, no company used any technical aids; those that made this type of assessment (23%) did so through a subjective estimate.
| Table 4. Proportion of respondents (%) who used the specified measurement methods to determine fuel quantity and fire risk during storage. (n = 30). | ||||
| Measurement method | Stacked volume | Temperature in the stack/fire risk | ||
| Comminuted fuels | Non-comminuted fuels | Comminuted fuels | Non-comminuted fuels | |
| Remote sensing with stationary sensors mounted on infrastructure | 3.3 | 0.0 | 10.0 | 0.0 |
| Remote sensing with sensors on drones | 33.3 | 10.0 | 3.3 | 0.0 |
| Manual measurement with analog measuring systems at stack | 23.3 | 16.7 | 23.3 | 0.0 |
| Manual measurement with digital non-contact systems at stack | 10.0 | 3.3 | 13.3 | 0.0 |
| Subjective estimation | 33.3 | 20.0 | 26.7 | 23.3 |
| None | 13.3 | 56.7 | 36.7 | 76.7 |
3.3.4 Stack characteristics
Stacks of comminuted material at the production sites were most often between 6 and 20 meters wide (evenly distributed between 6–12 and 13–20 meters), 5–6 meters high (more often lower than higher) and up to 40 meters long (Table 5). In comparison, stacks of non-comminuted material at the production sites were more often lower and narrower than stacks of comminuted material. However, there was no clear difference in length. Regarding the shape of the stack top, most stacks of comminuted material were peaky at the top. Non-comminuted stacks were more often plane, but it should be noted that the number of respondents was lower for non-comminuted stacks, indicating that it occurs to a lesser extent at the production sites.
| Table 5. Percentage (%) of respondents whose stacks were within the specified size range regarding width, height and length (expressed in meters), and the shape of the top when storing comminuted and non-comminuted fuels at the production site and at the terminal. | |||||
| Properties | Comminuted fuels | Non-comminuted fuels | |||
| Production site (n = 25) | Terminal (n = 10) | Production site (n = 9) | Terminal (n = 8) | ||
| Width at the base (m) | ≤5 | 0.0 | 10.0 | 55.6 | 50.0 |
| 6–12 | 44.0 | 30.0 | 0.0 | 37.5 | |
| 13–20 | 40.0 | 40.0 | 22.2 | 0.0 | |
| >20 | 16.0 | 20.0 | 22.2 | 12.5 | |
| Height (m) | <5 | 32.0 | 40.0 | 44.4 | 37.5 |
| 5–6 | 52.0 | 40.0 | 33.3 | 62.5 | |
| 7–10 | 12.0 | 20.0 | 11.1 | 0.0 | |
| >10 | 4.0 | 0.0 | 11.1 | 0.0 | |
| Length (m) | <20 | 28.0 | 20.0 | 22.2 | 25.0 |
| 20–40 | 32.0 | 20.0 | 22.2 | 25.0 | |
| 41–60 | 16.0 | 20.0 | 22.2 | 0.0 | |
| >60 | 24.0 | 40.0 | 33.3 | 50.0 | |
| Shape of the top | Plane | 33.3 | 33.3 | 66.7 | 85.7 |
| Peaky | 66.7 | 66.7 | 33.3 | 14.3 | |
A similar pattern to the above can be seen for stacks located at terminals, where the non-comminuted ones often had a narrower base than stacks with comminuted material. Compared to the stacks at the production sites, a higher proportion of the stacks were longer. In half of the cases, they were over 60 meters when it came to non-comminuted material. No companies reported stacking comminuted fuel against walls at interim storage terminals. At the production sites, one in three companies reported stacking a certain proportion of the fuel against walls. Of the ten companies, three companies stacked no more than 10% of the fuel against walls, four stacked 11–30%, one 31–50% and two stacked more than 70% against walls.
3.3.5 Performance of work tasks
The work that most companies performed with own personnel and own machines was handling chipped or crushed material with wheel loaders (Table 6). Other work tasks that were often performed in-house, in cases where the activity was performed, was building stacks, demolishing stacks and moving material with conveyor belts. Activities that were primarily performed by contractors were chipping and crushing.
| Table 6. Division of labour and use of machines for different types of activities, expressed as a percentage (%) of respondents for each activity. | ||||||
| Operations | N | Mainly done by | Not carried out | |||
| Own personnel | Hired personnel | Contractors | ||||
| Own machines | Rented machines | Own machines | ||||
| Chipping | 30 | 0.0 | 0.0 | 6.7 | 70.0 | 23.3 |
| Crushing | 30 | 0.0 | 0.0 | 0.0 | 66.7 | 33.3 |
| Removal of coarse chipped/crushed fractions | 29 | 17.2 | 0.0 | 0.0 | 13.8 | 69.0 |
| Removal of chipped/crushed fine fractions | 29 | 0.0 | 3.4 | 0.0 | 13.8 | 82.8 |
| Removal of non-combustible material | 29 | 3.4 | 0.0 | 0.0 | 6.9 | 89.7 |
| Removal of metals in chipped/crushed material | 29 | 20.7 | 0.0 | 0.0 | 17.2 | 62.1 |
| Handling of chipped/crushed material with wheel loader | 29 | 51.7 | 0.0 | 10.3 | 27.6 | 10.3 |
| Handling of chipped/crushed material with a high loader | 28 | 7.1 | 0.0 | 0.0 | 21.4 | 71.4 |
| Construction of wood chip piles with a wheel loader equipped with a putter/plow blade that pushes the wood chips up | 28 | 37.9 | 3.4 | 6.9 | 20.7 | 31.0 |
| Moving chipped/crushed material with conveyor belt | 30 | 33.3 | 0.0 | 0.0 | 0.0 | 66.7 |
| Moving chipped/crushed material with a cart | 28 | 0.0 | 0.0 | 3.6 | 3.6 | 92.9 |
| Demolition of stack, e.g. in case of fire | 26 | 30.8 | 3.9 | 7.7 | 19.2 | 38.5 |
3.4 Alignment of actions taken, perceived impact/development needs and theory
3.4.1 Actions to reduce storage losses
Respondents were asked to state on a scale of one to seven to what extent they carry out various actions that can reduce storage losses (Fig. 1). Minimizing storage time was the action carried out to the highest extent (average 4.2), followed by minimizing storage volume (3.1) and minimizing stack height (2.7). The other measures listed had average values between 1.0 and 1.6, meaning that they were almost never carried out, although there were a few companies that covered their stacks or to some extent stacked against concrete walls (Table 7). There was no correlation between the company’s size of production and the actions taken, nor was there any geographical difference. The company that covered its stacks stated that a maximum of 20% of the stacks were covered with fiber cloth and a maximum of 20% were covered with plastic sheets. The storage duration time with the stacks covered was 1–3 months.
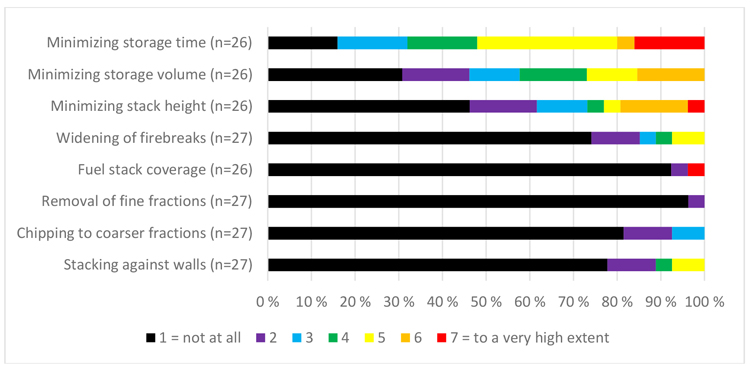
Fig. 1. Distribution of respondents according to the extent to which they take various measures to minimize storage losses, indicated on a scale of one to seven.
Furthermore, the respondents were asked to give their opinion on how effective the various actions were by ranking them from most effective to least effective (Table 8). Seventeen respondents ranked all alternatives and among these, a majority (65%) of the respondents considered minimizing storage time to be the most effective action. Minimizing storage volume was considered the second most effective, followed by covering the stacks with canvas. Widening firebreaks and stacking against walls were considered the least effective, which no respondent had ranked higher than fourth place among the eight alternatives.
3.4.2 Perceived development needs
Overall, the companies saw a relatively small development need to streamline their own operations in the areas they were asked to decide on (Fig. 2). On a scale of one (no need) to five (very high need), the average assessment for the different development areas was between 2.3 and 2.7 (Table 7). The greatest need, although the differences were small, was assessed to be in techniques and methods for inventorying stocks and fuel quality, followed by techniques for detecting fire risk. The lowest development need was assessed to be in storage methods to reduce energy losses and decision support for production control and fuel quality. There was no correlation between company size and their perception of development needs, nor was there any geographical difference.
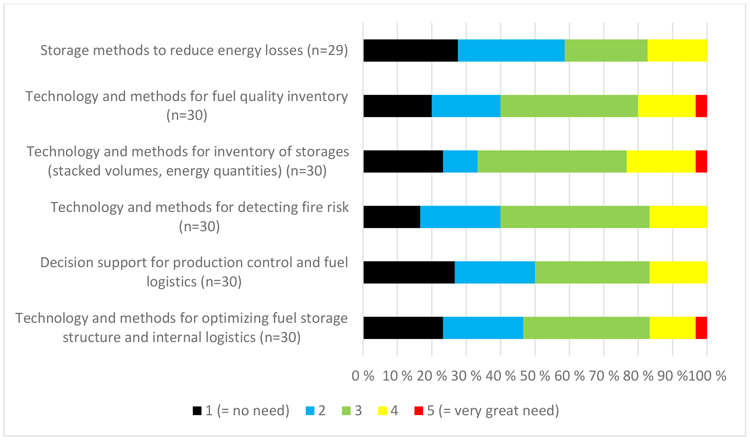
Fig. 2. Distribution of respondents based on how great development need they perceived existed, on a scale from one to five.
3.4.3 Matrix-based four-step gap-analysis
We found significant intra-correlations between Minimizing storage time, Minimizing storage volume and Minimizing stack height (Table 7), which are inter-related actions to e.g. mitigate DML. Similar results were also found for actions to mitigate fire spread, where a significant correlation was found between Widening of fire breaks and Minimizing stack heights, and a weak and non-significant correlation between Widening of stacks and Stacking against concrete walls. As expected, we also found a correlation, even though weak and not significant, between Chipping to coarser fractions and Removal of fine fractions, which both are related actions to both promote higher fuel quality and increased storability. There was also a weak and not significant correlation between the actions Minimizing storage volume and Fuel stack coverage, as expected, since coverage promotes non-rewetting of the stacks and dependent on sheet type used, even promotes lowering of moisture content, which in turn means that you get higher energy density in stacks, and thus need to store less volumes.
There were significant intra-correlations between all perceived development need categories, except one, that still shows correlation but non-significant (Table 7). These results could indicate that if research and development needs are wanted, all categories of measures are interesting. The relatively high correlation between Decision support for production control and fuel logistics and Technology and methods for inventory of storages and Technology and methods for optimizing fuel storage structure and internal logistics indicates a high need for decision support for the designing of terminals/fuel yards (allocation of stacks, paths etc.), and management systems for control of stocks and operations.
The inter-correlations between actions taken and perceived development need show both expected and non-expected trends (Table 7). To summarize, the actions Minimizing storage time and Minimizing storage volume show overall correlations to perceived development need categories, close to as expected, even though mainly weak and non-significant.
Actions Minimizing stack height and Widening of fire breaks show less correlations to perceived development need, compared to expected (Table 7). Interestingly, some correlations were negative, for example between Minimizing stack height and Technology and methods for optimizing fuel storage structure and internal logistics and between Widening of fire breaks and Technology and methods for detecting fire risk, which could indicate that “if already taking actions, no need of further development”.
For the actions taken, representing actions that require changes in management practices and operations, i.e. covering of stacks, screening of fine fractions, chipping to coarser fractions and investing in concrete wall systems, overall, no correlations were found where expected (Table 7).
| Table 7. Intra- and inter correlation matrix of actions taken (no. 1–8, answering level 1–7, were 1 indicate no actions made and 7 actions made to very high extent) and perceived development need (no. 9–14, answering level 1–5, were 1 indicate no need and 5 very high need). Marked cells indicate expected correlations. Yellow cells indicate correlations ≥ ±0.2. Orange cells indicate significant correlations were, **indicate correlation at the 0.01 level (2-tailed) and * at the 0.05 level (2-tailed). | ||||||||||||||||||
| No. | Actions taken (1–9) and percieved development need (9–14) | Mean | SD | N | 1 | 2 | 3 | 4 | 5 | 6 | 7 | 8 | 9 | 10 | 11 | 12 | 13 | 14 |
| 1 | Minimizing storage time | 4.2 | 1.9 | 25 | 1 | |||||||||||||
| 2 | Min. storage volume | 3.1 | 1.9 | 26 | 0.61** | 1 | ||||||||||||
| 3 | Min. stack height | 2.7 | 2.1 | 26 | 0.44* | 0.55** | 1 | |||||||||||
| 4 | Widening of firebreaks | 1.6 | 1.2 | 27 | 0.16 | 0.15 | 0.44* | 1 | ||||||||||
| 5 | Fuel stack coverage | 1.3 | 1.2 | 26 | 0.08 | 0.22 | –0.07 | 0.07 | 1 | |||||||||
| 6 | Removal of fine fractions | 1.0 | 0.2 | 27 | –0.03 | 0.10 | –0.07 | 0.07 | 0.13 | 1 | ||||||||
| 7 | Chipping to coarser fractions | 1.3 | 0.6 | 27 | –0.02 | 0.09 | 0.18 | –0.17 | –0.05 | 0.25 | 1 | |||||||
| 8 | Stacking against concrete walls | 1.5 | 1.2 | 27 | 0.17 | –0.04 | 0.38 | 0.23 | –0.08 | 0.08 | –0.03 | 1 | ||||||
| 9 | Storage methods to reduce energy losses | 2.3 | 1.1 | 29 | 0.16 | 0.36 | –0.04 | –0.03 | –0.03 | 0.15 | 0.09 | 0.09 | 1 | |||||
| 10 | Technology och methods for fuel quality inventory | 2.6 | 1.1 | 30 | 0.50* | 0.26 | 0.09 | 0.03 | 0.07 | 0.06 | 0.09 | 0.12 | 0.42* | 1 | ||||
| 11 | Technology and methods for inventory of storages (stacked volumes, energy quantities) | 2.7 | 1.1 | 30 | 0.23 | 0.31 | 0.03 | 0.10 | 0.03 | 0.04 | 0.14 | 0.03 | 0.39* | 0.65** | 1 | |||
| 12 | Technology and methods for detecting fire risk | 2.6 | 1.0 | 30 | 0.18 | 0.06 | 0.04 | –0.20 | –0.14 | 0.08 | 0.11 | 0.17 | 0.56** | 0.54** | 0.63** | 1 | ||
| 13 | Decision support for production control and fuel logistics | 2.4 | 1.1 | 30 | 0.20 | 0.20 | –0.14 | 0.14 | –0.08 | 0.10 | 0.05 | –0.07 | 0.35 | 0.60** | 0.72** | 0.50** | 1 | |
| 14 | Technology and methods for optimizing fuel storage structure and internal logistics | 2.5 | 1.1 | 30 | 0.30 | 0.21 | –0.31 | –0.12 | –0.09 | 0.09 | 0.02 | –0.15 | 0.43* | 0.55** | 0.70** | 0.52** | 0.79** | 1 |
Comparisons of the rank of which actions to minimize storage losses are made and the respondents’ perceived rank of these actions’ effectiveness show only consistency for the actions Minimizing storage time and Minimizing storage volume, which have highest ranking (Table 8). Interestingly, the perceived effectiveness of the action Fuel stack coverage ends up as nr 3 in the ranking while only ending up as rank 6 in actions taken. This could indicate awareness of the impact of action but lack of e.g. competence and/or resources to take actions. Further on, even though the action taken Widening of fire breaks is ranked 4, the perceived effectiveness is only ranked 8. This might indicate that there might be some uncertainties about its effectiveness/relevance.
When also adding the deviations from expectations of the perceived development needs to found correlations, using a scale from Small deviations to Extra Large, and using the final step of the gap-analysis, we find that actions Minimizing storage time and Minimizing storage volume show Alignment, indicating that theory, current practice and perceived needs of development and perceived effectiveness of actions, align well (Table 8).
The actions Minimizing stack height and Widening of fire breaks show a Medium Gap, indicating that current practices struggle to meet both theory and perceived effectiveness of actions and perceived need of development (Table 8).
The actions Fuel stack coverage, Removal of fine fractions, Chipping to coarse fractions and Stacking against concrete walls all show High Gaps, indicate major gaps between theory and practice (Table 8).
| Table 8. Gap analysis combining respondents ranking of actions taken to minimize storage losses and respondents ranking of perceived effectiveness of actions, deviations from expectations of correlations and theory. High Gaps indicate major gaps between theory and practice, Medium Gaps indicate that current practices struggle to meet both theory and perceived effectiveness of actions or perceived need of development, and Alignment indicate areas where theory, current practice and perceived needs of development or perceived effectiveness of actions, align well. | ||||||
| Actions taken | Rank | Percieved development needs | Gap | |||
| Actions taken | Perceived effectiveness of actions | Deviation from expectation | High | Medium | Align | |
| Minimizing storage time | 1 | 1 | Small | x | ||
| Minimizing storage volume | 2 | 2 | Medium | x | ||
| Minimizing stack height | 3 | 4 | Large | x | ||
| Widening of firebreaks | 4 | 8 | Large | x | ||
| Fuel stack coverage | 6 | 3 | XLarge | x | ||
| Removal of fine fractions | 8 | 6 | XLarge | x | ||
| Chipping to coarser fractions | 7 | 5 | XLarge | x | ||
| Stacking against concrete walls | 5 | 7 | XLarge | x | ||
4 Discussion
Sweden heavily relies on bioenergy, with forest-based biofuels contributing significantly to its total energy supply. These biofuels are crucial for energy plants, forming a foundational element of Sweden’s renewable energy infrastructure. The seasonal nature of heat demand, peaking in winter, necessitates efficient storage strategies to bridge the gap between continuous fuel production and fluctuating consumption. This study provides valuable insights into the current practices and development needs within Swedish energy plants regarding the storage, handling, monitoring, and inventory of forest-based biofuels.
The survey reveals a mixed picture regarding inventory control and quality monitoring. While the majority (60%) utilize self-designed digital systems for inventory, a significant proportion (37% for all fuels, 45% for primary/secondary forest fuels) have no opinion on the extent of storage losses. This lack of quantitative understanding of DML represents a major blind spot. Without accurate data on losses, it is challenging for energy plants to justify investments in improved storage practices or to fully assess the true cost-effectiveness of their fuel supply chain. This is a critical area for development, as reliable DML modeling is essential for optimizing the system’s profitability and climate benefit.
Furthermore, while systematic sampling for moisture content (71%) and ash content (58%) upon delivery is common, measurement of energy value (45%) and particle size (few companies) is less prevalent. Crucially, systematic quality determinations during storage or close to combustion are uncommon. This suggests that while initial fuel quality is assessed, the degradation of quality over time in storage is largely unmonitored. Given that DML is heavily affected by factors like moisture and temperature during storage (Krigstin and Wetzel 2016), this lack of continuous monitoring presents a significant risk to fuel quality and combustion efficiency. The reliance on subjective estimation for fuel quantity and fire risk during storage further underscores the need for more robust, data-driven approaches. The limited use of remote sensing technologies like drones for volume measurement, despite their potential, indicates an opportunity for technological adoption.
The survey highlights a diverse landscape of fuel management practices across Swedish energy plants. The finding that 2–4% DML per month can occur in chipped logging residues (Afzal et al. 2010; Anerud et al. 2018) emphasizes the economic and environmental imperative for optimizing storage. While some measures like limiting pile height, not mixing fuel qualities, covering piles, and screening fines are recognized as effective for DML reduction, their implementation appears to be inconsistent across the surveyed energy plants. The low adoption of covering stacks (average 1.0–1.6 on a 7-point scale) suggests a gap between acknowledged best practices and their practical application. This may be due to perceived costs, labor intensity, or a lack of demonstrable benefits within current operational frameworks.
The characteristics of fuel stacks at both production sites and terminals provide valuable data for optimizing storage design. The prevalence of peaky stack tops for comminuted material suggests a standard practice, but further research could evaluate the impact of stack shape on permeability, moisture content, and DML. The difference in stack dimensions between comminuted and non-comminuted fuels, and between production sites and terminals, highlights the need for tailored storage guidelines based on fuel type and storage location.
The division of labor, with chipping and crushing primarily handled by contractors and internal personnel focusing on handling material with wheel loaders, points to an established operational model. This suggests that innovations in chipping and crushing technologies or the logistics of these operations might best be targeted at the contractor level.
The survey’s direct inquiry into perceived needs of development is crucial for directing future research and investment. The strong consensus that “minimizing storage time” is the most effective action to reduce storage losses (65% of respondents) is logical, as it directly reduces the period for degradation. Similarly, “minimizing storage volume” was ranked second. However, the low current implementation of actions/measures like covering stacks, despite being ranked third most effective, suggests a disconnect. The gap-analysis (Table 8) confirms this disconnect and also adds additional insights. Future research could focus on demonstrating the tangible economic benefits of such action/measures, perhaps through case studies or pilot projects, to encourage wider adoption.
Members of the Swedenergy account for approximately 98% of district heating deliveries in Sweden and in 2024 members used ca 26 TWh of solid wood fuels for heat generation, of which 74% were of non-refined wood fuels (e.g. logging residues, fuelwood, bark, sawdust), 16% recycled wood and 10% refined wood fuels (e.g. pellets, briquettes, powder) (Energiföretagen 2026). The results of this survey are based on responses from 31 commercial energy producers in Sweden, and although the number of respondents is small, they constitute approximately 20% of the surveyed population. There was a good spread in size among the respondents, and the geographical distribution of the respondents reflected the distribution among the members of Swedenergy relatively well. Our assessment is therefore that the study provides a good overall picture of the current situation for biofuel management among energy producers in Sweden. However, the low number of respondents, combined with the fact that many survey questions were designed with several categorical answer options, posed a challenge for the analysis, which is why deeper analyses of the relationship between company characteristics and approaches to storage and handling of materials in many cases were not feasible. This constitutes a limitation of the study in terms of understanding which factors influence the companies’ choices and drivers and obstacles to more efficient handling of biofuels at terminals and storage sites at the facilities. More studies are therefore needed to delve deeper into the underlying reasons why companies act in a certain way, for example when it comes to minimizing storage losses.
5 Conclusions
This survey provides a comprehensive snapshot of forest fuel management practices in Swedish energy plants. While many plants demonstrate a foundational understanding of fuel logistics, there are significant opportunities for enhancing efficiency and sustainability. Key areas for development include:
Improved DML monitoring and quantification: Implementing more robust systems for tracking and quantifying storage losses is paramount. This includes adopting systematic quality control throughout the storage period, not just at delivery.
Technology adoption: Exploring and integrating advanced technologies for inventory management (e.g., remote sensing with drones for volume and temperature) can provide more accurate and timely data for decision-making.
Bridging the gap between theory and practice: Further research and outreach are needed to demonstrate the economic and environmental benefits of proven DML reduction strategies (e.g., covering stacks, screening off fines) to encourage wider adoption. For example, assuming that the Swedenergy members comminuted non-refined wood fuels (19.24 TWh) are stored on average 1 month and that storage DML are reduced by 2%-unit (e.g. from 4% to 2%) due to implementation of better storage practices, annual energy savings of ca 384 GWh could be reached, which corresponds to 115.2 MSEK using a fuel prize at industry gate of 300 SEK MWh–1.
Tailored storage solutions: Recognizing the diverse needs of different plant sizes and fuel types, developing and promoting tailored storage guidelines and technologies can optimize fuel quality and minimize losses across the sector.
Ultimately, a more data-driven and technologically integrated approach to forest fuel management will be crucial for Swedish energy plants to further enhance their resource efficiency, reduce climate impact, and ensure a predictable and cost-effective supply of bioenergy.
Acknowledgements
This study was part of the project “Efficient biofuel production and logistics at terminals and industry”, funded by the Swedish Energy Agency through the Bio+ research and innovation program.
Authors’ contributions:
Conceptualization – TK, EA, DB; Methodology and data collection – TK, EA, DB; Formal analysis – TK, DB; Writing – original draft preparation – TK, DB; Writing – review & editing; TK, EA, DB. All authors have read and agreed to the published version of the manuscript.
Declaration of openness of research materials, data, and code
Access to data can be obtained by contacting the corresponding author. Data is not published openly because individual companies can, in some cases, be identified from the information provided.
Conflicts of interest
The authors declare no conflicts of interest.
References
Afzal MT, Bedane AH, Sokhansaj S, Mahmood W (2010) Storage of comminuted and uncomminuted forest biomass and its effect on fuel. Bioresources 5: 55–69. https://doi.org/10.15376/biores.5.1.55-69.
Alakoski E, Jämsén M, Agar D, Tampio E, Wihersaari M (2016) From wood pellets to wood chips, risks of degradation and emissions from the storage of woody biomass – a short review. Renew Sustain Energy Rev 54: 376–383. https://doi.org/10.1016/j.rser.2015.10.021.
Anerud E, Jirjis R, Larsson G, Eliasson L (2018) Fuel quality of stored wood chips – influence of semi-permeable covering material. Appl Energy 231: 628–634. https://doi.org/10.1016/j.apenergy.2018.09.157.
Anerud E, Bergström D, Routa J, Eliasson L (2022) Sieving and covering of wood chips improves storability. Energies 15, article id 2953. https://doi.org/10.3390/en15082953.
Awais F, Flodén J, Svanberg M (2021) Logistic characteristics and requirements of Swedish wood biofuel heating plants. Renew Sustain Energy Rev 138, article id 10650. https://doi.org/10.1016/j.rser.2020.110650.
Energiföretagen (2023) Welcome to Swedenergy – Energiföretagen Sverige. https://www.energiforetagen.se/in-english/. Accessed 1 September 2025.
Energiföretagen (2026) Fjärrvärmestatistik. [District heating statistics]. https://www.energiforetagen.se/statistik/fjarrvarmestatistik/. Accessed 7 January 2026.
Eriksson A (2016) Improving the efficiency of forest fuel production chains. Acta Universitatis Agriculturae Sueciae 101. Swedish University of Agricultural Sciences. https://res.slu.se/id/publ/77454.
Fernandez-Lacruz R, Eriksson A, Bergström D (2020) Simulation-based cost analysis of industrial supply of chips from logging residues and small-diameter trees. Forests 11, article id 1. https://doi.org/10.3390/f11010001.
Jirjis R (2005) Effects of particle size and pile height on storage and fuel quality of comminuted Salix viminalis. Biomass Bioenergy 28: 193–201. https://doi.org/10.1016/j.biombioe.2004.08.014.
Jirjis R, Lehtikangas P (1992) Long term storage of mixed bark-shavings fuel. Rapport 230. Swedish University of Agricultural Sciences.
Kons K, Bergström D, Eriksson U, Athanassiadis D, Nordfjell T (2014) Characteristics of Swedish forest biomass terminals for energy. Int J For Eng 25: 238–246. https://doi.org/10.1080/14942119.2014.980494.
Krigstin S, Wetzel S (2016) A review of mechanisms responsible for changes to stored woody biomass fuels. Fuel 175: 75–86. https://doi.org/10.1016/j.fuel.2016.02.014.
Kühmaier M, Erber G, Kanzian C, Holzleitner F, Stampfer K (2016) Comparison of costs of different terminal layouts for fuel wood storage. Renew Energy 87: 544–551. https://doi.org/10.1016/j.renene.2015.10.048.
Kuptz D, Lesche S, Mendel T, Mack R, Rist E, Schön C, Hartmann H (2020) Fuel properties, dry matter losses and combustion behavior of wood chips stored at aerobic and anaerobic conditions. Biomass Bioenergy 142, article id 105745. https://doi.org/10.1016/j.biombioe.2020.105745.
Niinistö T, Anttila P, Kaseva J, Sikanen L Kärhä K, Routa J (2025) Energy wood flows and the operational environment of supply chains in finland: insights from a supplier survey. Silva Fenn 59, article id 25011. https://doi.org/10.14214/sf.25011.
Routa J, Asikainen A, Björheden R, Laitila J, Röser D (2013) Forest energy procurement: state of the art in Finland and Sweden. WIREs Energy and Environment 2: 602–613. https://doi.org/10.1002/wene.24.
Swedish Energy Agency (2025) Swedish Energy Agency Statistics database. https://pxexternal.energimyndigheten.se/pxweb/en/Energimyndighetens_statistikdatabas/. Accessed 22 June 2025.
Väätäinen K, Prinz R, Malinen J, Laitila J, Sikanen L (2017) Alternative operation models for using a feed‐in terminal as a part of the forest chip supply system for a CHP plant. GCB Bioenergy 9: 1657–1673. https://doi.org/10.1111/gcbb.12463.
Wetzel S, Volpe S, Damianopoulos J, Krigstin S (2017) Can biomass quality be preserved through tarping comminuted roadside biomass piles? Forests 8, article id 305. https://doi.org/10.3390/f8090305.
Wolfsmayr U, Rauch P (2014) The primary forest fuel supply chain: a literature review. Biomass Bioenergy 60: 203–221. https://doi.org/10.1016/j.biombioe.2013.10.025.
Total of 21 references.
