Dalytė Matulevičiūtė  ,
Jurga Motiejunaite,
Domas Uogintas,
Ričardas Taraškevičius,
Mindaugas Dagys,
Valerijus Rašomavičius
,
Jurga Motiejunaite,
Domas Uogintas,
Ričardas Taraškevičius,
Mindaugas Dagys,
Valerijus Rašomavičius
Decline of a protected coastal pine forest under impact of a colony of great cormorants and the rate of vegetation change under ornithogenic influence
Matulevičiūtė D., Motiejunaite J., Uogintas D., Taraškevičius R., Dagys M., Rašomavičius V. (2018). Decline of a protected coastal pine forest under impact of a colony of great cormorants and the rate of vegetation change under ornithogenic influence. Silva Fennica vol. 52 no. 2 article id 7699. https://doi.org/10.14214/sf.7699
Highlights
- We studied vegetation and its changes in a pine forest affected by a colony of great cormorants
- Vegetation in the colony varied according to the period of bird influence and the stand elevation above sea level
- Considerable vegetation changes occur in several years after bird colony establishment
- Pine forest ecosystem cease to exist following a decade of bird activity.
Abstract
We investigated the impact of a colony of great cormorants on the vegetation of the old growth Pinus sylvestris L. forest on the Curonian Spit peninsula, Lithuania. We studied the characteristics and rates of plant cover changes under varying length and intensity of bird influence. Plant species numbers, as well as the coverage of plants with different ecological requirements, varied according to the period of bird influence, but the resulting vegetation also depended upon the stand elevation above sea level. In our study, the initial increase in plant species richness at the start of bird nesting was not obvious and was of a transient character, due to the weak invasion of non-forest species and the rapid decline of forest plants. The colony area showed obvious and rapid vegetation changes during the investigation period. According to the calculated colony expansion rates, after 6–7 years of impact from birds the tree layer decreased by about four fold; the shrub layer decreased by about two fold; the field layer decreased by about 15 fold; and the dwarf shrub and bottom layers disappeared. The coverage by oligotrophic species decreased by more than four fold, while the coverage by eutrophic species increased by more than 60 fold. After 9–10 years of ornithogenic impact, all the trees were dead, and the protected coniferous forest ecosystem, with its characteristic plant species, had ceased to exist as such.
Keywords
coniferous forests;
piscivorous birds;
Baltic Sea;
habitats
-
Matulevičiūtė,
Institute of Botany, Nature Research Centre, Žaliųjų ežerų Str. 49, LT-08406 Vilnius, Lithuania
 http://orcid.org/0000-0001-7550-1860
E-mail
dalyte.matuleviciute@botanika.lt
http://orcid.org/0000-0001-7550-1860
E-mail
dalyte.matuleviciute@botanika.lt
-
Motiejunaite,
Institute of Botany, Nature Research Centre, Žaliųjų ežerų Str. 49, LT-08406 Vilnius, Lithuania
http://orcid.org/0000-0002-6949-1990
E-mail
jurga.motiejunaite@botanika.lt
-
Uogintas,
Institute of Botany, Nature Research Centre, Žaliųjų ežerų Str. 49, LT-08406 Vilnius, Lithuania
http://orcid.org/0000-0002-3937-1218
E-mail
domas.uogintas@botanika.lt
-
Taraškevičius,
Geology and Geography Institute, Nature Research Centre, Akademijos Str. 2, LT-08412 Vilnius, Lithuania
http://orcid.org/0000-0002-5110-6142
E-mail
taraskevicius@geo.lt
-
Dagys,
Institute of Ecology, Nature Research Centre, Akademijos Str. 2, LT-08412 Vilnius, Lithuania
http://orcid.org/0000-0001-9342-3464
E-mail
dagys@ekoi.lt
-
Rašomavičius,
Institute of Botany, Nature Research Centre, Žaliųjų ežerų Str. 49, LT-08406 Vilnius, Lithuania
http://orcid.org/0000-0003-1314-4356
E-mail
valerijus.rasomavicius@botanika.lt
Received 14 April 2017 Accepted 23 March 2018 Published 28 March 2018
Views 137903
Available at https://doi.org/10.14214/sf.7699 | Download PDF

Supplementary Files
1 Introduction
Piscivorous birds are engineer organisms (following Jones et al. 1994) that are capable of transforming terrestrial ecosystems, both through their chemical impact (that is, the introduction of large amounts of nutrients) and their mechanical impact (Ellis 2005 and the literature cited therein). Cormorants, based on the characteristics listed by Hutchinson (1950), belong to the group of birds that have the largest effects on their nesting areas: they breed in large colonies, their nesting is dense, and they deposit large amounts of guano (Kameda et al. 2000). Additionally, the population of the great cormorant, especially its continental subspecies (Phalacrocorax carbo sinensis Staunton, 1796) has increased exponentially across Europe (Delany and Scott 2006). The population has also expanded markedly eastwards and northwards, and is now found in all countries of the Baltic Sea region (Hagemeijer and Blair 1997). On the Curonian Spit in Lithuania, the first cormorant nests appeared in 1989 (Žydelis et al. 2002). By the end of our investigation (in the year 2014), the great cormorants and a small, stable colony of grey herons (Ardea cinerea) occupied approximately 3100 nests within an area of 6.82 ha.
There is a significant amount of evidence that an increase in the population of cormorants causes degradation of the habitats they invade, first through the destruction of the original vegetation and by changing soil properties (Ishida 1996; Anderson and Polis 1999; Hobara et al. 2005; Baumberger et al. 2012; Craig et al. 2012). Simultaneously, other biotic components of the invaded ecosystem undergo dramatic changes. These changes include shifts in the communities of lichens, myxomycetes, small mammals, arthropods, soil bacteria and archaea (Kolb et al. 2012; Adamonytė et al. 2013; Źółkóś et al. 2013; Balčiauskienė et al. 2014; Motiejūnaitė et al. 2014; Domínguez et al. 2017), as well as decreases in fungal growth and litter decomposition by fungi (Osono et al. 2002, 2006) and the fungi/bacteria PLFA ratio in soil (Wright et al. 2010). The detrimental effect of cormorant colonies on vegetation is evident from decreases in species richness and abundance, as well as changes in species composition (Ishida 1996; Craig et al. 2012; Kolb et al. 2012), population dynamics (Calviño-Cancela 2002), and vegetation productivity (Anderson and Polis 1999). Though a large part of the research has been carried out in non-wooded maritime and oceanic islands (as reviewed by Ellis, 2005), there is also an increasing amount of data on seabird impact on forests (Dal et al. 1991; Maesako 1991; Mun 1997; Ishida 1996; Laiviņš and Čekstere 2008; Źółkóś and Meissner 2008; Klimaszyk et al. 2015). Their impact on forests has also attracted increasing amounts of attention from the general public.
The deleterious effect on forest vegetation is primarily induced by changes in soil properties, such as the nutrient balance, especially in terms of the amounts of nitrogen (N) and phosphorus (P), calcium (Ca) and potassium (K), as well as the soil salinity and acidity (Ellis et al. 2006; Breuning-Madsen et al. 2010; García et al. 2011). However, there is an opinion that some negative effects may be produced by mechanical damage to tree branches that occurs during nest construction and roosting and by faeces covering the surface of the leaves, thus inhibiting photosynthesis and respiration and causing chemical injury (Ishida 1996; Garcia et al. 2011). Some negative effects on plants are also produced by ammonium, both gaseous (Vines and Wedding 1960) and as NH4+ ions in soil (Britto and Kronzucker 2002), both of which derive from the uric acid present in bird faeces and which, in natural environments, breaks down to ammonia (Bachrach 1957). These processes result in an environment with a high pH, which is especially deleterious coupled with the surplus ammonium.
The large and rapidly expanding colony of great cormorants in Juodkrantė (Curonian Spit) has earned much public attention: it is an attractive site for tourists, but it is also a source of concern for foresters and environmentalists because of the colony’s impact on forest stands with high conservational value. This concern stimulated a research project aimed at investigating changes in the biotic and abiotic components of a forest ecosystem affected by a cormorant colony. The objectives of the research presented in this paper were to: 1) characterize the vegetation changes in a protected centenary coniferous forest affected by a cormorant colony; and 2) to determine the rate of plant cover changes under temporally and spatially varying ornithogenic influence.
2 Materials and methods
2.1 Study area
The study was carried out in the northern part of the Curonian Spit peninsula in western Lithuania (55°31´N, 21°06´E). The Spit is an elongated stretch of sand dunes extending over 98 km that is surrounded by brackish water bodies, specifically the Baltic Sea to the west and the Curonian Lagoon to the east. The width of the peninsula varies from 400 m at its narrowest point (at Lesnoi (Sarkau) in the Russian part of the Spit) to 3.8 km at its widest point (at Bulvikis cape in the Lithuanian part of the Spit). The highest altitude is 60 m. The formation of the Spit started in the Middle Holocene, when a hilly ridge composed of till loam emerged from sea as several islands. Later, due to aeolian processes and sea level oscillations, the depressions between the islands filled with sand. The final structure of the present peninsula developed approximately 3500 BC (Kabailienė et al. 2009). The climate is intermediate between marine and continental; the mean annual precipitation is ≈ 700 mm, and the mean annual air temperatures range from 17.8 °C in August to –1.7 °C in January and February (Bukantis 2013). Seventy percent of the Spit’s land area is covered by forests, primarily conifers (80%). Small areas of old growth Pinus sylvestris L. and mixed pine-hardwood forest can be found, but only on the parabolic dunes at Juodkrantė settlement (Morkūnaitė et al. 2011).
The study was performed in 2010–2014 in the great cormorant colony located on the upper part of the dune ridge (alt. up to 34 m), on east-facing (leeward) dune slope terrace and in dune hollow (alt. 0–12 m). The dune ridge and terrace are characterized by dry conditions and dry arenosol soils, whereas the dune hollow soils are wetter and become swampy at the lowest elevations (Gudelis 1998; Peyrat 2007). The upper part of the cormorant colony was originally occupied by c. 110-year-old pine forest, whereas the slope terrace was occupied by c. 230-year-old pine forest (Empetro nigri-Pinetum (Libb. & Siss. 1939 n.n.) Wojt. 1964) growing on nutrient-poor sandy soil. The dune hollows were formerly occupied by 230-year-old pine and spruce forest developed on temporarily wet mesotrophic soils (Jončys and Paulaitis 1987). Today, most of the conifers are dead or dying, both on the dune slopes and in the hollow.
Seven study zones were selected. Forest type and age, as well as slope exposure and the different time spans of bird colony activity, were considered in establishing these zones.
Zone A includes the oldest part of the colony, and is located in the dune hollow (0–2 m a.s.l.). This area was formerly a pine and spruce forest developed on mesotrophic, temporarily wet soil; the coniferous trees are now dead, although a few young Picea abies (L.) H. Karst., Quercus robur L. and Betula pubescens Ehrh. are still alive but in stunted condition. A large part of the area is overgrown with tall herbs and Sambucus spp. shrubs; standing and fallen, barkless dead pine trunks are numerous. Cormorant nests are absent or very few (Fig. 1), but the birds constantly fly over it to feed from the Curonian Lagoon.
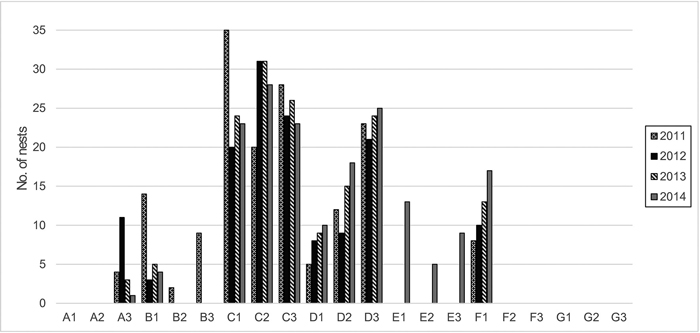
Fig. 1. Number of cormorant nests and their dynamics within the plots and a 12-m radius around them (years 2011–2014).
Zone B includes the oldest part of the colony, and is located on the leeward dune terraces (20–23 m a.s.l.). This area contains no living trees but displays numerous dead pine trees, both fallen and standing. The litter is composed of fine twigs, larger and smaller pine bark pieces, fish scales and bones. Cormorant nests are absent or few, but the birds constantly fly over it.
Zone C contains the most active part of the colony and is located in the former oligotrophic pine forest with the highest concentration of nests (Fig. 1). Here, the pine trees are dead or dying. This zone is on the upper leeward terrace of the dune ridge (27–29 m a.s.l.). Because of the dying trees, it is more open to direct sunlight than the unaffected forest.
Zone D is at the edge of the colony and contains the most recent nests that gradually increased in numbers during the investigation period (Fig. 1). It includes an oligotrophic pine forest on the upper leeward terrace of the dune ridge (22–32 m a.s.l.). The trees are alive, but their vitality is reduced, and the crowns are thinner.
Zone E initially contained relatively undamaged oligotrophic pine forest with solitary mesotrophic plants. It is located on the upper part of the dune ridge (28–34 m a.s.l.) and was outside of the colony at the start of the study. Until the year 2012, this area was only somewhat influenced by cormorants that occasionally flew over it to feed from the Baltic Sea. It was later influenced by nearby nests, and the first nests appeared in this zone in the year 2014 (Fig. 1).
Zone F contains relatively undamaged mesotrophic mixed forest in a dune hollow (11–15 m a.s.l.) outside of the colony. The trees are predominantly P. sylvestris and P. abies, with some admixture of B. pubescens and Q. robur. Initially, this zone was practically unaffected by birds, except for occasional flyovers or roosting, until the year 2011, when the colony started to expand into it (Fig. 1).
Zone G consists of relatively undamaged oligotrophic pine forest on the upper part of the dune ridge (29–36 m a.s.l.) with solitary mesotrophic and meso- to eutrophic plants and is outside of the colony. This zone was selected in the year 2012, when the colony expanded into the formerly unaffected forest (zone E). Zone G may be somewhat influenced by birds that occasionally fly over it to feed from the Baltic Sea, but remained devoid of nests until the end of the investigation (Fig. 1).
The Curonian Spit is a recreational area that experiences anthropogenic impact and its forests are fragmented. Therefore, it was impossible to find entirely natural stands of sufficient area and comparable composition, age and exposure as the stands occupied by the cormorant colony. The zones designated as controls started to be subjected to occasional passages of the cormorants at the beginning and to colony expansion at the end of the study (Fig. 1). At the beginning of the study (in the year 2010), the control zones E and F still bore vegetation typical of stands devoid of ornithogenic impact. Therefore, we used them as reference zones for analysis of the relationships between vegetation and soil chemistry. For the analysis of vegetation dynamics, however, we employed only the zones on dune terraces and the ridge to exclude subsidiary factors such as differences in the initial soil characteristics and humidity.
2.2 Field and laboratory work
The vegetation was investigated during the first ten days of September each year between 2010 and 2014 by the relevé method (Braun-Blanquet 1964). Three permanent replica plots (100 m2 each) were established in each of the seven zones. The plots in zones A and F were investigated in 2010; the plots in zones B–E were investigated between 2010 and 2014 (except for plot B3, which was not examined in 2014 after damage caused by forest management); zone G was investigated between 2012 and 2014, after the edge of the colony moved toward the former reference zone E in the spring of 2012.
The vertical structure of the vegetation was investigated by evaluating the coverage of the tree, shrub, field, and bottom layers. The coverage of each species was evaluated as a percentage. The values were rounded to two decimal points in cases with ˂1% coverage, to one decimal point in cases with 1–10% coverage, and to whole numbers in cases with >10% coverage. The number of dead and fallen trees was counted in each plot. Specimens of bryophytes and vascular plants of taxonomically complicated groups were collected for identification in the laboratory. Ellenbergʹs N values (Ellenberg et al. 2001) for vascular plants and characteristics of ecological amplitude for bryophytes (Dierßen 2001) were used for assessment of plant responses to soil fertility. All relevé data are stored in the Lithuanian Vegetation Database. The vascular plant nomenclature used here follows Euro+Med (2006) and ITIS (2016), whereas the bryophyte nomenclature follows Hill et al. (2006) and Söderström et al. (2016).
Cormorant nests were recorded and the numbers calculated from 2011 till 2014 by marking the trees on which nests were present, as well as the trees on which new nests had appeared, every year. Exact locations of these trees were recorded with a Trimble GeoExplorer 2008 GeoXM handheld unit, the density of nests in a 100 m2 area where each tree was situated was calculated, analysed and mapped with the ArcGIS ArcPad 10 and ArcGIS ArcMap software. The number of cormorant nests in and around (a 12-m radius) the study plots was estimated using the nest number and density data.
For the analysis, topsoil was sampled in year 2010 from zones A–F. Five subsamples of soil were taken at five points (four corners and one central point) in each plot by a round soil corer (15 × 4.5 cm), 25 subsamples per every plot. From every subsample, 5 cm of topsoil was separated and pooled into one sample per plot (15 samples per all plots and all zones). To determine the chemical soil parameters, the pH of the soil (topsoil) and the concentrations of P, K, Mg, Ca, Al, Na and Cl were measured, as well as total N and total C. The contents of P, K, Mg, Ca, Al, Na and Cl were analysed by EDXRF method. For this procedure, the samples were air-dried, mixed and sieved through a 2-mm sieve. Two independent subsamples were chosen from the sieved sediment. From each subsample, 5 g were ground for 10 min at 27 Hz using an MM 400 mill with zirconium oxide grinding jars and grinding balls. Ground material (4 g) was mixed with 0.9 g of Licowax binder and homogenized for 20 hours. For analysis, two pressed pellets with a diameter of 32 mm were prepared from each subsample mixture and used for X-ray analysis, which was performed with a SPECTRO XEPOS using the Turboquant method for pressed pellets and calibration procedures developed by the manufacturers (using “X-LabPro 4.5” software). Within the International Soil-Analytical Exchange (ISE) programme (organized by Wageningen University; the exchange years were 2009–2014), the ISE samples were prepared pari passu and used for preparing recalibration curves.
Total nitrogen (N) was measured following the Kjeldahl method at Labtarna Chemical Laboratory in Vilnius. The samples were prepared following the standard method ISO 6498:1998, the total nitrogen content was determined following the standard method LST EN ISO 5983-1:2005. A Tecator 2200 Kjeltec Auto Distillator and a Schott TitroLine 96 titrator were employed for distillation and titration of the sample solutions, respectively. Total carbon (C) was determined after dry combustion following the standard method ISO 10694.1995; pH was measured following the standard method ISO 10390:2005).
2.3 Data analysis
Detrended Correspondence Analysis (DCA) (Hill and Gauch 1980) and log transformed species data were used to visualize patterns of relationships between temporal vegetation changes and ornithogenic impact. Environmental variables were used as supplementary variables to interpret gradients in plant species compositions. These variables were fitted using multiple regression, and the significance of each variable was tested using the permutation test. Two matrices were used. The species matrix contained information on 18 plots × abundance data for 69 species (in the species data, where the same species occurred in several vegetation layers, it was counted as different for every layer). The environmental variables matrix contained information on 18 plots × 10 environmental variables (pH, C, N, Al, Na, K, Ca, Mg, and Cl). Only statistically significant variables were employed for the graphic visualization. The permutation test was employed to assess statistical significance (number of permutations: 999) for p < 0.05. Variables were considered not significant if p > 0.05. To define the most characteristic species for the studied zones, a matrix of 18 plots × 69 species was employed. The analyses were perfomed using Canoco software, version 5.04 (license number c509261) (Ter Braak and Šmilauer 2012). Only the species with the largest weights (8–100%) were employed for the graphic visualization. To define temporal changes in the study plots, a matrix containing information on 67 plots × abundance data for 63 species was used. Temporal changes were visualized as arrows from the first description (2010 for plots in zones B–E and 2012 for plots in zone G) to the last description (2014, except for B3, which was 2013; see in Study site description). The analysis was performed using R software (R Core Team 2015) and the Vegan package (Oksanen et al. 2015).
3 Results
3.1 Environmental characteristics
Examination of topsoil acidity in the plots showed that the highest pH values were in the bird-influenced zones in the elevated part of the investigated area. Acid soils are typical for pine-dominated forests, and they remained so in all investigated zones. However, in zone B, the pH values were clearly higher.
Analysis of the studied chemical elements in the topsoils showed gradients in the colony and reference zones. The highest content of total C was found in zone A, and the highest concentration of total N was recorded in zone F, but the highest values of the C/N ratio were found in zones A and B (which had experienced ornithogenic influence over the longest time period). The peak levels of P, Ca and Cl were found in zone A, where soils of the former mixed stands were originally richer and were supplemented both by long-term bird influence and by runoff from the more elevated parts of the colony. Conversely, the levels of K, Mg, Al and Na were highest in the reference zone E. The studied chemical characteristics of the study site soils are summarized in Table 1.
| Table 1. Chemical characteristics (Cc) of topsoil (A0-5) in zones A–F (data for the year 2010). Mean values and standard deviations are presented. Elemental concentrations are in g/kg. The study zones as follows: A = the oldest part of the colony in the dune hollow; B = the oldest part of the colony on the dune terraces; C = the most active part of the colony with the highest concentration of nests on the upper terrace of the dune ridge; D = the edge of the colony on the upper terrace of the dune ridge; E = relatively undamaged forest on the upper part of the dune ridge; F = relatively undamaged forest in a dune hollow. | ||||||
| Cc | Study zones | |||||
| A | B | C | D | E | F | |
| pH | 3.36±0.28 | 4.13±0.20 | 3.47±0.09 | 3.41±0.02 | 3.36±0.17 | 2.86±0.07 |
| C | 75.4±56.4 | 33.0±11.5 | 29.9±7.2 | 27.7±8.20 | 24.2±6.8 | 61.2±19.1 |
| N | 2.87±1.56 | 1.57±0.73 | 1.60±0.27 | 1.66±0.27 | 1.47±0.40 | 3.25±0.68 |
| P | 0.93±0.61 | 0.40±0.03 | 0.35 ±0.03 | 0.29 ±0.01 | 0.28 ±0.02 | 0.44 ±0.10 |
| Ca | 1.28±1.28 | 0.56±0.09 | 0.454±0.09 | 0.55±0.09 | 0.62±0.14 | 0.68±0.36 |
| K | 6.70±0.08 | 7.86±0.49 | 7.78±0.30 | 8.22±0.18 | 8.79±0.62 | 7.96±0.45 |
| Mg | 0.26±0.05 | 0.27±0.05 | 0.23 ±0.04 | 0.27 ±0.14 | 0.37 ±0.27 | 0.34 ±0.18 |
| Al | 8.18±0.75 | 8.12±0.59 | 8.23±0.52 | 8.75±0.44 | 9.63±0.82 | 8.90±0.74 |
| Na | 2.00±0.46 | 2.71±0.19 | 2.80±0.33 | 3.34±0.30 | 3.76±0.68 | 2.14±0.25 |
| Cl | 0.32±0.17 | 0.16±0.13 | 0.09 ±0.03 | 0.10 ±0.04 | 0.15 ±0.06 | 0.23 ±0.27 |
3.2 General characteristics of the vegetation
During the investigation, in all plots, we identified a total of 75 plant species including 61 species of vascular plants and 14 species of bryophytes (Supplementary file S1). The vegetation of the dune hollow and dune terraces in both bird-influenced and unaffected parts of the forest differed in terms of the participation of species with varying ecological requirements. Areas of unaffected forest in dune hollow (zone F) bore a higher percentage of oligo- to mesotrophic and a lower percentage of oligotrophic plants compared to the unaffected dune terrace (zone E). Meanwhile, in the oldest parts of the colony, the dune terrace (zone B) bore a higher proportion of eutrophic and mesotrophic plants and a lower percentage of oligo- to mesotrophic and oligotrophic plants compared to the dune hollow (zone A). Zone B was also distinguished by the absence of indifferent species. The vegetation on the dune ridge and terraces (zones B–E and G) depended on the length of ornithogenic impact: in the zone that had received bird influence over the longest period (B), the percentage and coverage of eutrophic plant species was the highest, and those of oligotrophic species were the lowest, when compared to the zones that had received bird influence over a shorter period and the pristine forest.
In terms of the coverage by the vegetation layers, the most obvious differences in the tree and bottom layers were found between the two zones in the dune hollow, A and F. The tree layer in zone F was thick, while in zone A, all the old trees were dead, and the young trees were absent or occurred only as solitary stunted individuals. The bottom layer in zone A was very sparse or absent, while its coverage was rather high in zone F, though it varied greatly among the individual plots. The vegetation of the dune ridge and terraces demonstrated coverage differences among the zones in all layers in 2010, which reflected a chronosequence of the impact from the birds. Though the tree layer coverage was rather similar outside the colony (zone E) and at its edge (zone D), it was markedly lower in the more affected parts of the site due to bird-induced damage and the death of the trees. The thickest shrub coverage was at the edge of the colony (zone D), where Juniperus communis L., Sorbus aucuparia L. and young Pinus sylvestris were supplemented with emerging eutrophic Sambucus nigra L. and S. racemosa L. The coverage of the field layer was highly degraded in this zone due to the extinction of the dwarf shrubs (Vaccinium spp.), which were replaced by eutrophic- to mesotrophic, eutrophic and nitrophilous herbaceous plants in zones C and B (Chelidonium majus L., Geranium robertianum L., Stellaria media (L.) Cirillo). The coverage of the bottom layer was the strongest indicator of ornithogenic influence; it suffered considerable depauperization at the colony edge and remained totally absent in the zones with the most intensive and the longest bird influence. The area of open forest floor was minimal outside the colony (zone E), but conspicuously increased in the zone with highest nest density (zone C). In an abandoned part of the colony (zone B), the area of the open forest floor decreased again with the establishment of eutrophic and nitrophilous herbaceous plants.
Detrended correspondence analysis (DCA) was performed using the vegetation data, and the topsoil chemistry (Table 1) was used as supplementary variables (Fig. 2). The first axis (length of 4.9, λ1 = 0.69) explained 21.8% of the variation in vegetation within the study zones and was negatively correlated with the concentration of P (r = –0.45) in topsoil and the pH of the topsoil (r = –0.63). Axis 1 was also positively correlated with the concentrations of Na (r = 0.27) and K (r = 0.66). This axis reflected the gradient of ornithogenic influence. The second axis (length of 2.9, λ2 = 0.39) explained 12.3% of the variation and showed negative correlations with the concentrations of K (r = –0.58) and Na (r = –0.78) in topsoil and the pH of topsoil (–0.49), but was positively correlated with the concentration of P (r = 0.48). This axis was mainly associated with the position of the studied plots with respect to their elevation above sea level. The study plots in the dune hollows (zones A and F) clustered apart from the other zones at the divergent ends of Axis 1. This observation can be explained by differences in humidity conditions, initial soil characteristics and runoff, which is natural in the case of zone F, enhanced by the impact of the birds in zone A, and reflected by the high Cl concentrations in both zones (Table 1). The differences among plots in the clusters among the zones B, C and D apparently reflected the varying intensity of ornithogenic impact.
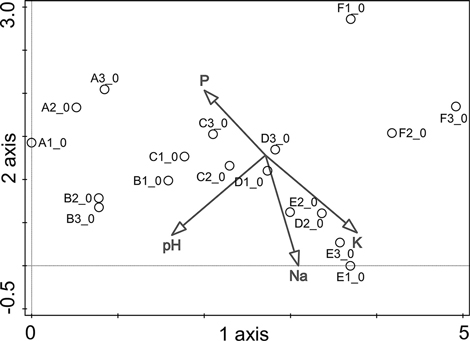
Fig. 2. Study plot distribution in DCA ordination with respect to topsoil chemistry (only statistically significant environmental variables are shown). Plots refer to the study zones A, B, C, D, E, and F. A zero in the plot number indicates the initial year of the study, 2010. P = phosphorus concentration; K = potassium concentration; Na = sodium concentration; pH = acidity of the topsoil.
To show the plant distribution in the studied zones and along the gradient of ornithogenic impact, species information was added to the DCA visualization (Fig. 3). In the graph, unaffected pine stands on the dune ridge (zone E) are represented by oligotrophic Linnaea borealis L. in the herb layer, oligotrophic Vaccinium myrtillus L. and oligo- to mesotrophic Avenella flexuosa (L.) Drejer in the field layer, and young pine trees and Juniperus communis in the shrub layer. A high presence of P. abies, P. sylvestris and Q. robur in the understorey, as well as Frangula alnus Mill. in the shrub layer, represent unaffected mixed stands in the dune hollow. The strong presence of bryophytes is characteristic of both types of unaffected stands. An increase in the proportion of S. aucuparia in the shrub layer on the dune ridge indicates the earliest stage of ornithogenic influence (zone D), which is not yet reflected in changes in the coverage of P. sylvestris in the canopy layer. The zone of short-term intensive (that is, with the highest concentration of nests) ornithogenic impact (zone C) is represented by the presence of eutrophic S. media and eutrophic- to mesotrophic G. robertianum in the field layer. Notably, however, oligotrophic Carex arenaria L. persists in both zones of short-term bird influence (zones D and C) with relatively high coverage. Eutrophic to mesotrophic Calamagrostis epigejos (L.) Roth and Poa pratensis L. in the field layer represent long-term ornithogenic impact on drier dune terraces. Meanwhile, the presence of oligo- to mesotrophic Pteridium aquilinum (L.) Kuhn and meso- to eutrophic Galeopsis tetrahit L. in the field layer represent such impact on the moister dune hollow. Sambucus spp. in the shrub layer, as well as eutrophic ruderal C. majus, represent long-term bird influence, regardless of zone elevation.
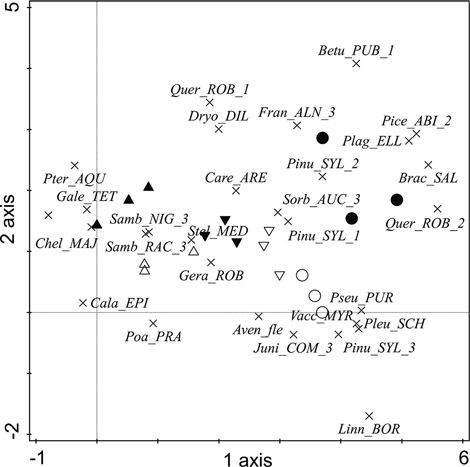
Fig. 3. The distribution of plants (the 28 species with the largest weights (8–100%) are shown) in the DCA ordination in the studied ornithogenic influence zones in the year 2010. Plot symbols are as follows: ▲ = zone A, △ = zone B, ▼ = zone C, ▽ = zone D, ○ = zone E, ● = zone F. Plant species: Aven_FLE = Avenella flexuosa, Betu_PUB = Betula pubescens, Brac_SAL = Brachythecium salebrosum, Cala_EPI = Calamagrostis epigejos, Care_ARE = Carex arenaria, Chel_MAJ = Chelidonium majus, Dryo_DIL = Dryopteris dilatata, Fran_ALN = Frangula alnus, Gale_TET = Galeopsis tetrahit, Gera_ROB = Geranium robertianum, Juni_COM = Juniperus communis, Linn_BOR = Linnea borealis, Pice_ABI = Picea abies, Pinu_SYL = Pinus sylvestris, Plag_ELL = Plagiomnium ellipticum, Pleu_SCH = Pleurozium schreberi, Poa_PRA = Poa pratensis, Pseu_PUR = Pseudoscleropodium purum, Pter_AQU = Pteridium aquilinum, Quer_ROB = Quercus robur, Samb_NIG = Sambucus nigra, Samb_RAC = Sambucus racemosa, Sorb_AUC = Sorbus aucuparia, Stel_MED = Stellaria media, Vacc_MYR = Vaccinium myrtillus. Numbers accompanying the tree and shrub species refer to the layer in which the species was recorded: 1 – canopy, 2 – understorey, 3 – shrub layer.
3.3 Temporal dynamics of the vegetation
With gradual expansion of the cormorant colony, changes in the density of nests, the accumulation of nutrient input via guano and the opening of tree crowns, clear changes in vegetation were observed. By comparing the structure of the plant communities (the species, their numbers and their coverage), we evaluated the rates and character of these changes. By surveying the dynamics of different zones, we also characterized the chronosequence of these changes under the increasing and persistent influence from birds.
As the vegetation and soil chemistry of the plots in the dune hollow (A and F) were too different from those on the dune terrace and ridge (Figs. 2 and 3), only the plots of zones B, C, D, and E and the new reference plots in zone G were further surveyed to define temporal vegetation changes. For this, DCA was performed using plot sampling data from different years and plant species abundance data (Fig. 4). The first axis (length of 3.8, λ1 = 0.59) explained 25% of the variance and reflected the ornithogenic impact. The second axis (length of 1.7, λ2 = 0.17) explained 7% of the variance and was apparently related to the individual differences among the plots, including uneven expansion of the bird colony, especially in zones E and D.
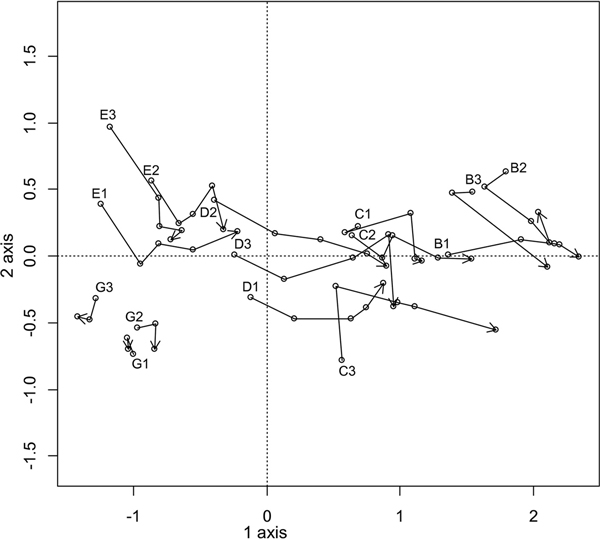
Fig. 4. Dynamics of vegetation in plots B–E and G during the period between 2010 and 2014 (the plots in zone G were established in 2012). Letters indicate the zone, whereas numbers indicate the plot number. Points marked with plot numbers represent the initial year of the survey, whereas plots marked with an arrow represent the final year of the survey.
Most of the studied zones showed obvious and rapid vegetation changes during the investigation period, except for those in zone G, which remained comparatively stable (Fig. 4). Zone E (the reference zone in 2010) shifted into the former position of zone D by the year 2014, following the expansion of the cormorant colony (Fig. 1). The vegetation in zones D and C shifted into the patterns displayed by zones C and B, respectively. Notably, in zone B, which was under the influence of the colony for the longest time, the vegetation also changed, but the trends were not clear. The most obvious shifts in species numbers and coverage occurred in zones C and D. Dramatic decreases in species numbers, as well as the coverage of the tree, shrub and field layers, were observed in both zones, and the remnants of the bottom layer had already disappeared from zone D by the second year of the survey.
Zones C–E showed clear shifts towards eutrophic communities. The percentage of oligotrophic species prevailed in zones E and G at the beginning of the survey (years 2010 for zone E and 2012 for zone G), but in the year 2014, they remained prevalent only in zone G, whereas in zone E, the number of eutrophic species achieved the highest percentage. The zones with greater ornithogenic influence (B, C, and D) bore considerably higher percentages of eutrophic species; their coverage was high and tended to increase during the whole survey period. Though eutrophic communities persisted and obvious changes were noted in zone B, as well, the shift was rather towards increases in the coverage of shrubs and herbaceous plants, with the species numbers remaining relatively stable and low. Shrub coverage in zone B consisted solely of S. nigra and S. racemosa, and the participation of the latter tended to increase. The coverage of eutrophic herbaceous species, such as C. majus, Ochlopoa annua (L.) H. Scholz, Solanum dulcamara L., increased together with the rise of eutrophic plant species richness, due to the appearance of Chenopodium album L. and Urtica dioica L. In the plots in zone B, a few individuals of the oligotrophic species C. arenaria and the oligo-mesotrophic species Avenella flexuosa still persisted in 2010, however, they disappeared almost totally in later years, leaving only a few surviving plants of A. flexuosa. The increase and instability of the coverage of the field layer in zone B (Table 2) was caused by the abundant occurrence of annual to perennial plants, mainly O. annua and S. media. The pattern of vegetation in the plots of zone C in the years 2013–2014 followed that seen in the plots in zone B in the year 2010 despite the still-remaining tree cover, which decreased almost tenfold in comparison with the year 2010 (Table 2). Since the year 2013, the plots in zone D have become very similar to the plots in zone C plots in the years 2010–2011. That is, the tree crowns gradually thinned, Sambucus spp. became dominant in the shrub layer, and indifferent shrubs, such as J. communis, F. alnus, S. aucuparia became sparse and of reduced vitality. Moreover, almost all the oligotrophic and mesotrophic plant species disappeared, and the total species number decreased. In the year 2014, of the oligotrophic species, only sparse C. arenaria and individuals of A. flexuosa with reduced vitality were observed in zone D, as was observed in the plots in zone C in the years 2012–2013.
| Table 2. Coverage (%) of vegetation layers in study zones. Mean values and standard deviations are presented. The study zones as follows: A = the oldest part of the colony in the dune hollow; B = the oldest part of the colony on the dune terraces; C = the most active part of the colony with the highest concentration of nests on the upper terrace of the dune ridge; D = the edge of the colony on the upper terrace of the dune ridge; E = initially relatively undamaged forest on the upper part of the dune ridge; F = relatively undamaged forest in a dune hollow; G = relatively undamaged pine forest on the upper part of the dune ridge. * In 2010 and 2011 the vegetation of G zone vas not investigated; zones A and F were investigated only in 2010. | |||||
| Zones | Study years | ||||
| 2010 | 2011 | 2012 | 2013 | 2014 | |
| Tree layer | |||||
| A | 2.00 ± 2.65 | * | * | * | * |
| B | 0.00 ± 0.00 | 0.00 ± 0.00 | 0.00 ± 0.00 | 0.00 ± 0.00 | 0.00 ± 0.00 |
| C | 38.33 ± 2.89 | 25.00 ± 15.00 | 11.67 ± 5.77 | 5.67 ± 4.04 | 2.67 ± 2.52 |
| D | 66.67 ± 15.28 | 48.33 ± 12.58 | 31.67 ± 7.64 | 31.67 ± 20.21 | 14.33 ± 13.58 |
| E | 60.67 ± 9.81 | 59.00 ± 6.93 | 53.67 ± 11.93 | 48.33 ± 14.43 | 48.33 ± 17.56 |
| F | 80.00 ± 8.66 | ||||
| G | * | * | 46.00 ± 3.61 | 46.00 ± 3.61 | 46.00 ± 3.61 |
| Shrub layer | |||||
| A | 13.33 ± 7.64 | * | * | * | * |
| B | 4.67 ± 4.62 | 10.00 ± 5.00 | 17.67 ± 5.86 | 18.00 ± 12.02 | 40.00 ± 42.43 |
| C | 10.33 ± 10.97 | 7.33 ± 6.66 | 12.83 ± 10.54 | 13.17 ± 8.13 | 5.83 ± 5.53 |
| D | 20.33 ± 17.04 | 10.50 ± 9.96 | 7.33 ± 2.31 | 12.33 ± 2.08 | 5.33 ± 2.02 |
| E | 11.67 ± 2.89 | 6.67 ± 4.62 | 6.83 ± 2.84 | 10.17 ± 7.65 | 14.70 ± 8.98 |
| F | 14.33 ± 13.65 | ||||
| G | * | * | 4.50 ± 1.32 | 5.33 ± 1.76 | 5.67 ± 1.53 |
| Field layer | |||||
| A | 73.33 ± 11.55 | * | * | * | * |
| B | 10.00 ± 4.00 | 8.67 ± 6.03 | 64.67 ± 23.18 | 46.50 ± 21.92 | 67.50 ± 10.61 |
| C | 14.00 ± 10.15 | 4.67 ± 3.21 | 10.50 ± 3.77 | 5.33 ± 4.48 | 3.40 ± 2.95 |
| D | 40.00 ± 13.23 | 17.33 ± 16.65 | 18.67 ± 7.09 | 7.07 ± 2.70 | 5.57 ± 3.89 |
| E | 88.33 ± 5.77 | 94.33 ± 4.04 | 94.00 ± 1.73 | 82.67 ± 6.43 | 55.83 ± 34.41 |
| F | 46.67 ± 30.55 | ||||
| G | * | * | 76.67 ± 5.77 | 79.33 ± 11.59 | 56.67 ± 17.56 |
| Bottom layer | |||||
| A | 0.17 ± 0.29 | * | * | * | * |
| B | 0.00 ± 0.00 | 0.00 ± 0.00 | 0.00 ± 0.00 | 0.00 ± 0.00 | 0.00 ± 0.00 |
| C | 0.00 ± 0.00 | 0.00 ± 0.00 | 0.00 ± 0.00 | 0.00 ± 0.00 | 0.00 ± 0.00 |
| D | 10.00 ± 10.00 | 0.00 ± 0.00 | 0.00 ± 0.00 | 0.00 ± 0.00 | 0.00 ± 0.00 |
| E | 56.67 ± 25.17 | 5.67 ± 4.04 | 8.17 ± 3.33 | 6.00 ± 5.29 | 9.70 ± 13.39 |
| F | 37.67 ± 39.07 | ||||
| G | * | * | 73.33 ± 15.28 | 13.50 ± 4.27 | 38.50 ± 27.55 |
| Open forest floor | |||||
| A | 20.00 ± 13.23 | * | * | * | * |
| B | 29.67 ± 4.51 | 44.00 ± 36.10 | 9.67 ± 13.32 | 30.00 ± 21.21 | 5.00 ± 0.00 |
| C | 83.00 ± 12.12 | 88.50 ± 12.02 | 75.67 ± 17.93 | 93.67 ± 5.13 | 90.33 ± 5.51 |
| D | 50.00 ± 17.32 | 82.33 ± 9.29 | 72.67 ± 11.02 | 89.67 ± 4.51 | 90.33 ± 6.43 |
| E | 2.00 ± 1.73 | 3.00 ± 1.73 | 0.83 ± 1.44 | 9.33 ± 7.67 | 34.33 ± 36.90 |
| F | 20.67 ± 34.08 | * | * | * | * |
| G | * | * | 3.33 ± 4.04 | 8.67 ± 6.35 | 20.33 ± 15.04 |
With the appearance of the first nests and during the following one to two years, shrub coverage increased (zones D and E) because of the newly emerging S. aucuparia and the appearance of the first individuals of Sambucus spp. Later, shrub coverage started to decrease (Table 2), due to the total decline of Juniperus and Pinus seedlings, followed by the decline of S. aucuparia. Later, the shrub coverage stabilized at rather low percentages and consisted solely of Sambucus spp. Only when the trees were dead and fallen, and the nests became sparse (zone B) did the shrub coverage start to increase again, though it still consisted solely of Sambucus spp. The coverage of the field layer consistently decreased with the onslaught of the ornithogenic influence until all the trees were dead, even though new eutrophic species appeared and their coverage increased.
The observed dynamics of vegetation changes allow us to estimate that, in the case of cormorant colonies in oligotrophic pine forests, obvious changes (including large decreases in the bottom and field layers, as well as increases in the shrub layer and the percentage of eutrophic species), are obvious within 2–3 years after the appearance of the first nests (Table 2, zone E). After five years of intensive impact from birds (6–7 years from initial impact, according to the trends observed in zones E and D), the coverage of the tree layer decreased by about four fold, the shrub layer decreased by about two fold, and the field layer decreased by about 15 fold (Table 2, zone D), with extinction of dwarf shrubs and the bottom layer. The changes in layer coverage were related to species composition: the coverage of oligotrophic species decreased by more than four fold (from 29.27 ± 6.45 to 6.17 ± 5.14 percent), while the coverage of eutrophic species increased by more than 60 fold (from 0.27 ± 0.47 to 18.16 ± 8.32 percent). After 9–10 years of impact from cormorants (according to the trends observed in the zones D, C and B), all the trees were dead, and the coniferous forest ecosystem had ceased to exist as such.
4 Discussion
Disturbances caused by the expansion of populations of some piscivorous birds and their invasion into forest ecosystems attract the attention of environmental managers and can even result in conservation conflicts (García et al. 2011; Domínguez et al. 2017). This problem is especially acute in protected areas and in natural sites where valuable remnants of native forests suffer severe damage from the impact of bird colonies (Ishida 1996; Herbert et al. 2005; García et al. 2011,). Ornithogenic disturbances may vary in different climates and forest types. However, there are several points in common for at least some stand types and climates. 1) Trees with nests or that are extensively used as roosts eventually decline or die, irrespective of tree species (Oyamada 1986 as cited by Ishida 1996), though the survival rate depends on species traits. In particular, conifers are more susceptible (Ishida 1996; Laiviņš and Čekstere 2008). 2) In general, plant species richness become lower (Ishida 1996; Mun 1997; Źółkóś and Markowski 2006; Klimaszyk et al. 2015). 3) Mosses and dwarf shrubs disappear (Źółkóś and Markowski 2006; Źółkóś and Meissner 2008). 4) Nitrophilous “ruderal” species start to become prevalent, replacing indigenous oligotrophic and mesotrophic plants (Mun 1997; Źółkóś and Markowski 2006; Laiviņš and Čekstere 2008; Źółkóś and Meissner 2008; Breuning-Madsen et al. 2010; Baumberger et al. 2012; Bloch-Orlowska and Źółkóś 2013). All these phenomena were observed in our study as well. However, we found several differences when comparing our results with those obtained in the geographically closest areas. In Poland, in a colony of grey herons occupying an acidophilous beech forest, the post-colonization area continued to be occupied by a stable tall shrub community of Sambucus nigra with intermixed Sorbus aucuparia and Frangula alnus (Źółkóś and Markowski 2006). In our study site, vegetation in the area abandoned by birds depended upon its elevation. The dune hollow (zone A) was occupied by a rather thin Sambucus spp. community with tall herbaceous plants intermixed with open glades containing occasional Betula pubescens and Quercus robur trees and was similar to the communities in Latvia described by Laiviņš and Čekstere (2008). Meanwhile, the dune terrace (zone B) developed into a dense shrub community consisting almost entirely of Sambucus spp. Some authors (Ellis 2005; Bloch-Orlowska and Źółkóś 2013) noted the appearance of halophytic plant species in the areas affected by bird colonies, due to the high concentrations of salts in soils that result from the decomposition of bird guano. We did not observe halophytes in our investigation sites.
It is difficult to compare the types and rates of changes during the early stages of ornithogenic impact between different countries and sites, because there are no exact published data in European research. The only phenomenon that could be derived from the references was an initial increase in plant species richness at the start of bird nesting in all studied forest types (Źółkóś and Markowski 2006; Źółkóś and Meissner 2008; Breuning-Madsen et al. 2010). This was observed in our study as well, specifically in zone E and the years 2012–2013. However, this increase was not very apparent and was only temporary, in contrast to the results obtained by Źółkóś and Meissner (2008) and Breuning-Madsen et al. (2010). The main reason for this discrepancy was, apparently, the difference in the initial forest conditions. In Poland, the studied pine stand was afforested formerly arable land and had a heterogeneous forest floor that included both forest and non-forest plants with a low occurrence of bryophytes. In Denmark, the studied site was a mixed broadleaved stand. In both these cases, however, a large decrease in indigenous forest species numbers was noted in the stands affected by birds, regardless of the length of impact (three years in Poland and 12 years in Denmark). In our study, the invasion of non-forest plants was less obvious during the initial stage of impact from the birds, and the subsequent decline in forest plants was very fast. These observations explain the transience of the increase in plant species richness in the colony on the Curonian Spit.
With the marked and rapid decline of the indigenous woodland plant communities, important questions remain for environmental managers. (i) How persistent are ornithogenic changes in forest ecosystems? (ii) How long it will take for stands to rebound, if it is possible at all, if the bird colony diminishes or stabilizes? Dal et al. (1991) predicted that the disturbances induced by cormorants will persist for many decades in Vorsø (Denmark), and this prediction was confirmed by a subsequent study (Breuning-Madsen et al. 2010). Ishida (1996) and Źółkóś and Markowski (2006) stated that, when trees are lost and a shrub community is established, there is little possibility of recovery of the original vegetation in the short term, because a few fast-growing species (like Sambucus spp.) utilize the additional nitrogen to out-compete less tolerant species, resulting in ecologically impoverished habitats (Dalton and Brand-Hardy 2003). Moreover, even much lower inputs of nutrients than these from a bird colony may have effects that last for decades in nutrient-limited ecosystems (Strengbom and Nordin 2008). A major disturbance may even be required to re-set the system (Bowman and Steltzer 1998). Irreversible changes and the low resilience of vegetation, together with the persistence of the effects of nutrient inputs, are especially deleterious in conservation areas that aim to protect native ecosystems and species that are adapted to small or moderate amounts of nutrients.
The cormorant colony of the Curonian Spit peninsula has established itself within the territory of Juodkrantė Landscape Reserve, which was primarily set up to preserve the only surviving fragment of old growth P. sylvestris forests on parabolic dunes, together with their typical plant species, such as Linnaea borealis L., Empetrum nigrum L. and Maianthemum bifolium (L.) F.W. Schmidt as well as the habitats of several red-listed animal species. The forest contains habitat types that are included in Annex I of the EC Habitats Directive (Council Directive 92/43/EEC on the Conservation of natural habitats and of wild fauna and flora) (2180 Wooded dunes of the Atlantic, Continental and Boreal region) (Rašomavičius 2001). The total area of Juodkrantė Landscape Reserve is 260 ha, and the area of habitat 2180 on the Curonian Spit peninsula is 430.4 ha (Lietuvos respublikos... 2009). Meanwhile, the area occupied by the cormorants is 26 ha (data for the year 2014), which makes up one-tenth of the Reserve’s total area and over 6% of the area of habitat 2180 on the Curonian Spit. As our data show, the characteristic plants of the protected habitat began to disappear after 2–3 years of impact from birds, and the forest declines soon after. These processes lead to complete destruction of the protected habitat, therefore raising the question of the continued existence of the whole protected territory. As the data of other researchers show, even short-term nutrient inputs have long-lasting impact, and there are no environmentally safe or efficient methods to remediate the soil (Garcia et al. 2011). Thus, the only measure is to prevent expansion of the existing cormorant colonies and establishment of the new ones.
Acknowledgements
The research was funded by grants no. LEK-23/2010 and no. LEK-03/2012 from the Research Council of Lithuania.
References
Adamonytė G., Iršėnaitė R., Motiejūnaitė J., Matulevičiūtė D., Taraškevičius R. (2013). Myxomycetes in a forest affected by great cormorant colony: a case study in Western Lithuania. Fungal Diversity 59(1): 131–146. https://doi.org/10.1007/s13225-012-0203-8.
Anderson W.B., Polis G.A. (1999). Nutrient fluxes from water to land: seabirds affect plant nutrient status on Gulf of California islands. Oecologia 118(3): 324–332. https://doi.org/10.1007/s004420050733.
Bachrach U. (1957). The aerobic breakdown of uric acid by certain pseudomonads. Journal of General Microbiology 17: 1–11. https://doi.org/10.1099/00221287-17-1-1.
Balčiauskienė L., Jasiulionis M., Balčiauskas L. (2014). Loss of diversity in a small mammal community in a habitat influenced by a colony of great cormorants. Acta Zoologica Bulgarica 66: 229–234.
Baumberger T., Affre L., Torre F., Vidal E., Dumas P.-J., Tatoni T. (2012). Plant community changes as ecological indicator of seabird colonies’ impacts on Mediterranean islands. Ecological Indicators 15(1): 76–84. https://doi.org/10.1016/j.ecolind.2011.09.009.
Bloch-Orlowska J., Źółkóś K. (2013). Flora roślin naczyniowych rezerwatu przyrody “Kąty Rybackie” (Mierzeja Wiślana, pólnocna Polska). [Vascular plant flora of the ‘Kąty Rybackie’ nature reserve (the Mierzeja Wiślana region, northern Poland)]. Acta Botanica Cassubica 12: 81–94.
Bowman W.D., Steltzer H. (1998). Positive feedbacks to anthropogenic nitrogen deposition in Rocky Mountain Alpine tundra. Ambio 27: 514–517.
Braun-Blanquet J. (1964) Pflanzensoziologie. Grundzüge der Vegetationskunde. [Phytosoci-iology. Principles of vegetation research]. Springer, Wien–New York. 865 p. https://doi.org/10.1007/978-3-7091-8110-2.
Breuning-Madsen H., Ehlers-Koch C., Gregersen J., Lund Løjtnant C. (2010). Influence of perennial colonies of piscivorous birds on soil nutrient contents in a temperate humid climate. Geografisk Tidsskrift-Danish Journal of Geography 110(1): 25–35. https://doi.org/10.1080/00167223.2010.10669494.
Britto D.T., Kronzucker H.J. (2002). NH4+ toxicity in higher plants: a critical review. Journal of Plant Physiology 159(6): 567–584. https://doi.org/10.1078/0176-1617-0774.
Bukantis A. (2013). Klimatas [Climate]. In: Eidukevičienė M. (ed.). Lietuvos gamtinė geografija. Klaipėdos universiteto leidykla, Klaipėda. p. 53–87.
Calviño-Cancela M. (2002). Spatial patterns of seed dispersal and seedling recruitment in Corema album (Empetraceae): the importance of unspecialized dispersers for regeneration. Journal of Ecology 90(5): 775–784. https://doi.org/10.1046/j.1365-2745.2002.00711.x.
Craig E.C., Elbin S.B., Danoff-Burg J.A., Palmer M.I. (2012). Impacts of double crested cormorants (Phalacrocorax auritus) and other colonial waterbirds on plant and arthropod communities on islands in an urban estuary. Waterbirds 35 (sp1): 4–12. https://doi.org/10.1675/063.035.sp102.
Dal T., Fabricius P., Nielsen J. (1991). The forest of Vorsø, Denmark: succession towards a natural, deciduous boreal forest influenced by breeding cormorants. Nordic Journal of Botany 11(6): 641–649. https://doi.org/10.1111/j.1756-1051.1991.tb01277.x.
Dalton H., Brand-Hardy R. (2003). Nitrogen: the essential public enemy. Journal of Applied Ecology 40(5): 771–781. https://doi.org/10.1046/j.1365-2664.2003.00849.x.
Delany S., Scott D. (eds.) (2006). Waterbird population estimates. Fourth edition. Wetlands international, Wageningen. 239 p.
Dierßen K. (2001). Distribution, ecological amplitude and phytosociological characterization of European bryophytes. Bryophytorum Bibliotheca 56. Cramer, Berlin–Stuttgart. 289 p.
Domínguez M.T., Gutiérrez E., González-Domínguez B., Román M., Ávila A.M., Ramo C., Gonzalez J.M., García L.V. (2017). Impacts of protected colonial birds on soil microbial communities: when protection leads to degradation. Soil Biology and Biochemistry 105: 59–70. https://doi.org/10.1016/j.soilbio.2016.11.007.
Ellenberg H., Weber H.E., Düll R., Wirth V., Werner W., Paulißen D. (2001). Zeigerwerte von Pflanzen in Mitteleuropa. [Indicator values of plants in Central Europe]. Scripta Geobotanica 18. Lehrstuhl f. Geobotanik d. Universität Göttingen. 262 p.
Ellis J.C. (2005). Marine birds on land: a review of plant biomass, species richness, and community composition in seabird colonies. Plant Ecology 181(2): 227–241. https://doi.org/10.1007/s11258-005-7147-y.
Ellis J.C., Fariña J.M., Witman J.D. (2006). Nutrient transfer from sea to land: the case of gulls and cormorants in the Gulf of Maine. Joournal of Animal Ecology 75(2): 565–574. https://doi.org/10.1111/j.1365-2656.2006.01077.x.
Euro+Med (2006). Euro+Med PlantBase the information resource for Euro-Mediterranean plant diversity. http://ww2.bgbm.org/EuroPlusMed/. [Cited 30 March 2017].
García L.V., Ramo C., Aponte C., Moreno A., Domínguez M.T., Gómez-Aparicio L., Redondo R., Marañón T. (2011). Protected wading bird species threaten relict centenarian cork oaks in a Mediterranean Biosphere Reserve: a conservation management conflict. Biological Conservation 144(2): 764–771. https://doi.org/10.1016/j.biocon.2010.11.007.
Gudelis V. (1998.) Lietuvos įjūris ir pajūris. [Sea coast of Lithuania]. Lietuvos mokslas, Vilnius. 442 p.
Hagemeijer W., Blair M. (1997). The EBCC atlas of European breeding birds: their distribution and abundance. T & A D Poyser, London. 903 p.
Herbert C.E., Duffe J., Weseloh D.V.C., Senese E.M.T., Haffner G.D. (2005). Unique island habitats may be threatened by double-crested cormorants. Journal of Wildlife Management 69(1): 68–76. https://doi.org/10.2193/0022-541X(2005)069<0068:UIHMBT>2.0.CO;2.
Hill M.O., Gauch Jr. H.G. (1980). Detrended Correspondence Analysis: an improved ordination technique. Vegetatio 42(1–3): 47–58. https://doi.org/10.1007/BF00048870.
Hill M.O., Bell N., Bruggeman-Nannenga M.A., Brugués M., Cano M.J., Enroth J., Flatberg K.I., Frahm J.P., Gallego M.T., Garilleti R., Guerra J., Hedenäs L., Holoyak D.T., Hyvönen J., Ignatov M.S., Lara F., Mazimpaka V., Muñoz J., Söderström L. (2006). Bryological monograph. An annotated checklist of the mosses of Europe and Macaronesia. Journal of Bryology 28(3): 198–267. https://doi.org/10.1179/174328206X119998.
Hobara S., Koba K., Osono T., Tokuchi N., Ishida A., Kameda K. (2005). Nitrogen and phosphorus enrichment and balance in forests colonized by cormorants: implications of the influence of soil adsorption. Plant and Soil 268(1): 89–101. https://doi.org/10.1007/s11104-004-0231-6.
Hutchinson G.E. (1950). Survey of existing knowledge of biogeochemistry: 3. The biogeochemistry of vertebrate excretion. Bulletin of the American Museum of Natural History 96. 554 p.
Ishida A. (1996). Effects of the common cormorant, Phalacrocorax carbo, on evergreen forests in two nest sites at Lake Biwa, Japan. Ecological Research 11(2): 193–200. https://doi.org/10.1007/BF02347685.
ITIS (2016). Integrated Taxonomic Information System. https://www.itis.gov/citation.html. [Cited 30 March 2017].
Jončys F., Paulaitis A. (1987). Valstybinio Kuršių nerijos miško parko Juodkrantės girininkijos taksoraštis. Miškotvarka 1987 m. [Taxation report of Juodkrantė forest district, State Forest Park of Curonian Spit. Forest Management 1987]. Miškotvarkos institutas, Kaunas. 172 p.
Jones C.G., Lawton J.H., Shachak M. (1994). Organisms as ecosystem engineers. Oikos 69(3): 373–386. https://doi.org/10.2307/3545850.
Kabailienė M., Vaikutienė G., Damušytė A., Rudnickaitė E. (2009). Post–Glacial stratigraphy and palaeoenvironment of the northern part of the Curonian Spit, Western Lithuania. Quaternary International 207(1–2): 69–79. https://doi.org/10.1016/j.quaint.2008.12.007.
Kameda K., Koba K., Yoshimizu C., Fujiwara S., Hobara S., Koyama L., Tokuchi N., Takayanagi A. (2000). Nutrient flux from aquatic to terrestrial ecosystem mediated by the Great Cormorant. Sylvia 36 (Suppl.): 54–55.
Klimaszyk P., Brzeg A., Rzymski P., Piotrowicz R. (2015). Black spots for aquatic and terrestrial ecosystems: impact of perennial cormorant colony on the environment. Science of the Total Environment 517: 222–231. https://doi.org/10.1016/j.scitotenv.2015.02.067.
Kolb G.S., Jerling L., Essenberg C., Palmborg C., Hambäck P.A. (2012). The impact of nesting cormorants on plant and arthropod diversity. Ecography 35(8): 726–740. https://doi.org/10.1111/j.1600-0587.2011.06808.x.
Laiviņš M., Čekstere G. (2008). Kolonijās ligzdojošo zivju gārņu (Ardea cinerea) un jūras kraukļu (Phalacrocorax carbo) ietekme uz Latvijas ezera salu augu valsti un augsnēm. [The impact of grey heron Ardea cinerea and great cormorant Phalacrocorax carbo, nesting in colonies, on the plant communities and soils of Latvia’s lake islands]. Mežzinatne 18(51): 74–84.
Lietuvos respublikos aplinkos ministro įsakymas. 2009 m. balandžio 22 d. Nr. D1-210. Dėl vietovių, atitinkančių gamtinių buveinių apsaugai svarbių teritorijų atrankos kriterijus sąrašo, skirto pateikti Europos komisijai, patvirtinimo. [Decree of Minister of Environment of Lithuanian Republic. On localities fulfilling the requirements for habitat conservation…]. https://e-seimas.lrs.lt/portal/legalAct/lt/TAD/TAIS.343175. [Cited 30 March 2017].
Maesako Y. (1991). Effect of streaked shearwater (Calonectris leucomelas) on species composition of Persea thunbergii forest on Kanmurijima Island, Kyoto Prefecture, Japan. Ecological Research 6(3): 371−378. https://doi.org/10.1007/BF02347135.
Morkūnaitė R., Baužienė I., Česnulevičius A. (2011). Parabolic dunes and soils of the Curonian Spit, south–eastern Baltic Sea coast. Baltica 24: 95–106.
Motiejūnaitė J., Iršėnaitė R., Adamonytė G., Dagys M., Taraškevičius R., Matulevičiūtė D., Koreivienė J. (2014). Pine forest lichens under an eutrophication generated by a great cormorant colony. Lichenologist 46(2): 213–228. https://doi.org/10.1017/S0024282913000820.
Mun H.T. (1997). Effects of colony nesting of Ardea cinerea and Egretta alba modesta on soil properties and herb layer composition in Pinus densiflora forest. Plant and Soil 197(1): 55–59. https://doi.org/10.1023/A:1004292103610.
Oksanen J., Blanchet F.G., Kindt R., Legendre P., Minchin P.R., O’Hara R.B., Simpson G.L., Solymos P., Henry M., Stevens H., Wagner H. (2015). Vegan: community ecology package. R package version 2.3-2.
Osono T., Hobara S., Fujiwara S., Koba K., Kameda K. (2002). Abundance, diversity, and species composition of fungal communities in a temperate forest affected by excreta of the great cormorant Phalacrocorax carbo. Soil Biology and Biochemistry 34(11): 1537–1547. https://doi.org/10.1016/S0038-0717(02)00123-2.
Osono T., Hobara S., Koba K., Kameda K., Takeda H. (2006). Immobilization of avian excreta-derived nutrients and reduced lignin decomposition in needle and twig litter in a temperate coniferous forest. Soil Biology and Biochemistry 38(3): 517–525. https://doi.org/10.1016/j.soilbio.2005.05.022.
Peyrat J. (2007). Development, properties and classification of dune soils in the Curonian Spit National Park, Russian part. Geologija 59: 59–64.
R Core Team (2015). R: a language and environment for statistical computing. R Foundation for Statistical Computing, Vienna, Austria.
Rašomavičius V. (ed.) (2001). Europinės svarbos buveinės Lietuvoje. [Habitat types included into Annex I of EC Habitats Directive in Lithuania]. Daigai, Vilnius. 138 p.
Söderström L., Hagborg A., von Konrat M., Bartholomew-Began S., Bell D., Briscoe L., Brown E., Cargill D.C., Costa D.P., Crandall-Stotler B.J., Cooper E.D., Dauphin G., Engel J.J., Feldberg K., Glenny D., Gradstein S.R., He X., Heinrichs J., Hentschel J., Ilkiu-Borges A.L., Katagiri T., Konstantinova N.A., Larraín J., Long D.G., Nebel M., Pócs T., Puche F., Reiner-Drehwald E., Renner M.A.M., Sass-Gyarmati A., Schäfer-Verwimp A., Moragues J.G.S., Stotler R.E., Sukkharak P., Thiers B.M., Uribe J., Váňa J., Villarreal J.C., Wigginton M., Zhang L., Zhu R.-L. (2016). World checklist of hornworts and liverworts. PhytoKeys 59: 1–828. https://doi.org/10.3897/phytokeys.59.6261.
Strengbom J., Nordin A. (2008). Commercial forest fertilization causes long-term residual effects in ground vegetation of boreal forests. Forest Ecology and Management 256(12): 2175–2181. https://doi.org/10.1016/j.foreco.2008.08.009.
Ter Braak C.J.F., Šmilauer P. (2012). Canoco reference manual and user’s guide: software for ordination, version 5.0. Microcomputer Power. Ithaca, USA.
Vines H.M., Wedding R.T. (1960). Some effects of ammonia on plant metabolism and a possible mechanism for ammonia toxicity. Plant Physiology 35(6): 820–825. https://doi.org/10.1104/pp.35.6.820.
Wright D.G., van der Wal R., Wanless S., Bardgett R.D. (2010). The influence of seabird nutrient enrichment and grazing on the structure and function of island soil food webs. Soil Biology and Biochemistry 42(4): 592–600. https://doi.org/10.1016/j.soilbio.2009.12.008.
Źółkóś K., Kukwa M., Afranowicz-Cieślak R. (2013). Changes in the epiphytic lichen biota in the Scots pine (Pinus sylvestris) stands affected by a colony of grey heron (Ardea cinerea): a case study from northern Poland. Lichenologist 45(6): 815–823. https://doi.org/10.1017/S0024282913000558.
Źółkóś K., Markowski R. (2006). Pressure of the grey heron breeding colony (Ardea cinerea) on the phytocoenosis of lowland acidophilous beech forest in the ‘Czapliniec w Wierzysku’ reserve (Kaszubskie Lake District). Biodiversity: Research and Conservation 3–4: 337–339.
Źółkóś K., Meissner W. (2008). The effect of grey heron (Ardea cinerea L.) colony on the surrounding vegetation and the biometrical features of three undergrowth species. Polish Journal of Ecology 58: 65−74.
Žydelis R., Gražulevičius G., Zarankaitė J., Mečionis R., Mačiulis M. (2002). Expansion of the Cormorant (Phalacrocorax carbo sinensis) population in western Lithuania. Acta Zoologica Lituanica 12(3): 283–287. https://doi.org/10.1080/13921657.2002.10512515.
Total of 59 references.
