Back Tomas Ersson  ,
Linus Jundén,
Urban Bergsten,
Martin Servin
,
Linus Jundén,
Urban Bergsten,
Martin Servin
Simulated productivity of one- and two-armed tree planting machines
Ersson B. T., Jundén L., Bergsten U., Servin M. (2013). Simulated productivity of one- and two-armed tree planting machines. Silva Fennica vol. 47 no. 2 article id 958. https://doi.org/10.14214/sf.958
Highlights
- Using discrete-event simulation and detailed terrain and machine models, the productivities of excavator-based one- and two-armed tree planting machines were simulated
- The machines’ arms were equipped with one-and two-headed planting devices
- Two planting heads per arm rather than two arms per base machine is better for increasing the productivity of intermittently advancing planting machines on Nordic clearcuts.
Abstract
To increase mechanized planting, planting machine productivity must increase in order to improve cost-efficiency. To determine if excavators with two crane arms could potentially help to increase planting machine productivity under Nordic clearcut conditions, we modelled one-armed and semi-automated two-armed excavators with one- and two-headed planting devices. Using a recently developed tool for discrete-event simulation, these machine models then mounded and planted seedlings on terrain models with moraine soil having various frequencies of obstacles (stumps, roots and stones). Compared to if the two heads were mounted pairwise on only one arm, the results showed that productivity did not increase if two planting heads were attached individually to two separate crane arms. But productivity did increase if the planting machine had four planting heads mounted pairwise on two separate arms. However, despite assuming automated mounding and crane motion between planting spots, the two-armed, four-headed model never achieved high enough productivity levels to make it more cost-efficient than one-armed machines. The simulations illustrate that our terrain models generate realistic root architecture and boulder content distributions in moraine soil, while our machine models functionally describe mechanized planting work. Based on our assumptions, we conclude that further development work on two-armed excavator-based planting machines for Nordic clearcut conditions is not warranted. Our simulations reveal that increasing the number of planting heads per crane arm rather than number of crane arms per base machine offers the greatest potential to raise the productivity of intermittently advancing planting machines.
Keywords
discrete-event simulation;
mechanized planting;
forestry;
silviculture;
automation;
terrain model;
root model
-
Ersson,
Swedish University of Agricultural Sciences, Department of Forest Biomaterials and Technology, SE-901 83 Umeå, Sweden
E-mail
back.tomas.ersson@slu.se
- Jundén, UMIT Research Lab, Umeå University, SE-901 87 Umeå, Sweden E-mail linus.junden@gmail.com
- Bergsten, Swedish University of Agricultural Sciences, Department of Forest Biomaterials and Technology, SE-901 83 Umeå, Sweden E-mail urban.bergsten@slu.se
- Servin, UMIT Research Lab, Umeå University, SE-901 87 Umeå, Sweden E-mail martin.servin@physics.umu.se
Received 22 January 2013 Accepted 15 April 2013 Published 18 July 2013
Views 240929
Available at https://doi.org/10.14214/sf.958 | Download PDF

1 Introduction
In the Nordic countries, trees are planted mechanically mostly in Finland and southern Sweden (Rantala et al. 2009; Ersson 2010). Despite comprising only 22% of Sweden’s 22.36 million ha of productive forest area available for forestry, forest land in southern Sweden is fertile and yields 31% of Sweden’s total annual volume increment (Skogsdata 2012). This high fertility results in high levels of vegetative competition (Nilsson and Örlander 1999), and in combination with high risks of Hylobius abietis predation (Örlander and Nilsson 1999), successful reforestation of typical clearcuts in southern Sweden requires good quality site preparation (Petersson et al. 2005) and planting (Örlander et al. 1991). On these clearcuts, crane-mounted one-headed planting devices that mound and plant deeply (Bracke Planter) yield better work quality than the standard reforestation method of disc trenching and operational manual tree planting (Ersson and Petersson 2011). Consequently, intermittently advancing tree planting machines with such planting devices have been reintroduced in southern Sweden during the last five years. Typical clearcuts in southern Sweden lie on moraine soils, have varying prevalences of stones and stumps, and lack most slash as branches and tops are harvested for bioenergy.
In Finland, both the Bracke Planter and a two-headed planting device (M-Planter) are used (Rantala and Laine 2010). Because two-headed planting devices scarify and plant two seedlings simultaneously, their productivities tend to be higher than that of one-headed devices which only plant one seedling per crane stop (Mattson 1997; Normark and Norr 2002; Rantala et al. 2009). The M-Planter has shown to plant seedlings with similar quality to the Bracke Planter (Härkönen 2008) but only with somewhat higher productivity (Rantala et al. 2009). Yet the productivity potential of these two simultaneously working planting heads has been difficult to realize in practice (Rantala and Laine 2010). A possible explanation for this difficulty is that the M-Planter’s productivity advantage over the Bracke Planter decreases with increasing prevalence of clearcut obstacles (Rantala et al. 2009).
Nevertheless, today’s average planting machine productivity, regardless of using one- or two-headed planting devices, is still too low for planting machines to cost-wise compete with manual tree planting in southern Sweden (Ersson 2010). To further increase productivity while maintaining good planting quality, rather than constructing planting devices with more than two heads, adding another crane arm to the base machine might be better. Today, the base machines that carry these crane-mounted planting devices are almost exclusively 13–23 tonne tracked excavators with 7–10 m maximum boom (hereafter termed crane) reach and with the capacity to carry another crane arm. Two arms would double the planting machine’s number of planting heads while minimizing inter-head disturbance during work. As previous studies of two-headed mounding (Brunberg and Fries 1985; von Hofsten and Petersson 1991) and planting (Rantala et al. 2009) devices have shown, minimizing one head’s disruptions of another head’s work is especially important for high productivity on obstacle-rich terrain. On the other hand, in theory, the more obstacles there are on a clearcut, the less the benefit of a second arm. Greater difficulties finding suitable planting spots and unforeseen disruptions should increase the time spent per successfully planted seedling on obstacle-rich terrain which increases the risk of having one arm idly waiting while the operator is busy working with the other arm. Indeed, simulation studies of two-armed forest thinning machines have shown that reducing crane idle time is key to realizing the two-armed machines’ productivity potential (Jundén et al. In Press).
Two-armed machines probably require some degree of semi-automation to enable the operator to control two cranes simultaneously while maximizing productivity. Semi-autonomous cranes are supervised by human operators but have some automated tasks in their work cycles. Shared control allows the operator to adjust or control the task without interrupting it (Hansson and Servin 2010), thereby guaranteeing that the operator can take full control of the automated tasks. Planting machine tasks relevant for automating are mounding and crane movement between spatially suitable planting spots within the working area. The actual planting task is already automated on today’s planting devices (von Hofsten 1993).
To establish whether resources should be spent on constructing two-armed base machines and developing the sensors and algorithms needed for automating mounding and broad crane movements, simulation studies are needed to cost-efficiently verify the potential productivity increase of two-armed planting machines. Simulations have supported decision making concerning forest machine development and construction since the 1960s (Newnham 1968; Sjunnesson 1970), and discrete event simulations have been particularly useful when evaluating harvesting machinery design (e.g. Talbot et al. 2003; Wang et al. 2005; Sängstuvall et al. 2012). However, as far as we know, site preparation and tree planting machinery has only been simulated once before. In that study, Andersson et al. (1977) simulated the suitability of three different planting heads during stand regeneration with continuously advancing planting machines on moraine soils.
The objective of our study was to simulate semi-automated, two-armed excavator-based planting machines and compare their potential productivities under Nordic clearcut conditions with today’s one-armed planting machines. Nordic clearcut conditions include various quantities, distributions and sizes of stones, roots and stumps, i.e. obstacles in the terrain that prevent the planting head from satisfactorily planting seedlings. Tree planting machine simulations require not only terrain but also machine and simulation models (cf. Andersson et al. 1977), and therefore we developed our own versions of these three essential types of models.
2 Materials and methods
2.1 Terrain models
In total, we modelled six clearcuts (Table 1). Terrain model 0was a deterministic terrain model completely lacking obstacles and was used as a reference to distinguish between the full potential of each machine model and the effects of obstacles. Terrain models 1–4 were clearcuts on moraine soil that have increasing frequencies of obstacles, where terrain model 4 represents clearcuts with close to maximum obstacle difficulty. Having moderate numbers of stumps and stones, terrain model 5 closely resembled typical southern Swedish clearcuts (Stendahl et al. 2009; Skogsdata 2012).
| Table 1. The terrain models’ descriptive parameters. | ||||||
| Terrain model | Description | Stumps ha–1 | Stump basal area (m2 ha–1) | Boulder quota a) (%) | Stone frequency (n m–2) | Mean stone volume (dm3) |
| 0 | No obstacles | 0 | 0 | 0 | 0 | 0 |
| 1 | Few stumps, few stones | 230 | 71.5 | 25 | 14 | 1.8 |
| 2 | Many stumps, few stones | 635 | 95.5 | 25 | 14 | 1.8 |
| 3 | Few stumps, many stones | 230 | 71.5 | 75 | 25 | 3.6 |
| 4 | Many stumps, many stones | 635 | 95.5 | 75 | 25 | 3.6 |
| 5 | Moderate stumps, moderate stones | 390 | 35.5 | 55 | 21 | 3.0 |
| a) As defined by the Swedish Terrain Classification System (Berg 1982). Also termed stoniness or rockiness. | ||||||
2.1.1 Stumps and roots
Herlitz’s (1975) type stands for clearcutting provided the parameter values (stump diameter, breast height diameter (Dbh) and tree species specification) for the stumps and the Cartesian coordinates for their spatial allocation. The type stands measure 40 × 50 m which constitutes the clearcuts’ dimensions.
To create sufficiently detailed yet computing-efficient stump models for Fennoscandian conditions, we combined the root mapping efforts of Björkhem et al. (1975) and Kalliokoski et al. (2010). Björkhem et al. (1975) studied the root distribution of 31–63 year old Picea abies (L.) Karst growing on moraine and sandy sedimentary soils in southern Sweden, and their deterministic functions allowed us to base our root models on the Dbh of individual trees in Herlitz’s (1975) type stands. Kalliokoski et al.’s (2010) dataset from 12 mature P. abies, Pinus sylvestris (L.) and Betula pendula Roth sample trees growing on moraine soils in southern Finland provided the parameters and supplementary functions for constructing stochastic, comprehensive three dimensional root models of the three most commercially important tree species in Fennoscandia.
For all three species, each modelled stump occupies a total non-plantable area encompassing the stump itself, a ring-shaped root plate and all roots over 20 mm in diameter. The diameter of each stump is given by Herlitz’s type stands. The root plate represents the zone of rapid taper (ZRT; Wilson 1975) which occurs within 0.5–2 m from the stem depending on the tree species (Eis 1974; Wu et al. 1988). Accurate modelling of ZRT is complex (cf. Wu et al. 1988); thus, to simplify our root model, we considered the entire ZRT to always be a visible (to the planting machine operator), non-plantable, minimum 50 cm-wide circular obstacle whose radius increases linearly with the stump diameter (Jundén 2011). Roots can be both visible and non-visible obstacles (Fig. 1). All main lateral root segments were assumed to be visible up until the first branching point/node (in order to reflect the tendency of main lateral roots to grow near the soil surface (Björkhem et al. 1975)), while all subsequent root segments were assumed to be below-ground and non-visible. The threshold in root size was chosen because roots less than 20 mm in diameter were assumed to neither hinder the mounding nor planting task. Further root model assumptions, functions and parameter values are presented in Appendix 1.
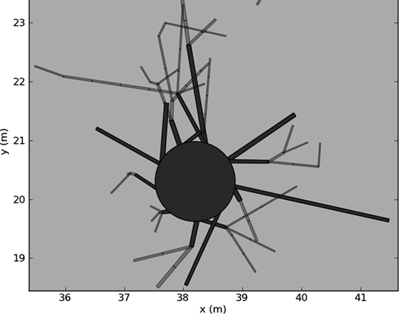
Fig. 1. A modelled stump. The large, dark circle comprises both the annular root plate and the actual stump. The visible main lateral roots originate from the root plate’s edge and are shaded darker while the non-visible secondary roots are lighter in shade.
2.1.2 Stones
In our terrain models, stones are always non-visible underground obstacles. Andersson et al. (1977) provided the initial stone parameter values for rectangular stones over 5 cm in diameter (stones under 5 cm in diameter were assumed to not hinder planting devices) based on sampling by Larsson (1976). Because we modelled stones as spheres (Eriksson and Holmgren 1996), the corresponding threshold stone diameter when calculating stone volume in our terrain models was 5.6 cm (Jundén 2011). However, because Larsson’s (1976) plots were subjectively placed on the clearcuts to avoid large boulders and rocky areas, we increased mean stone volume and decreased stone frequency by a factor of two compared to Andersson et al. (1977). This modification made our stone parameters more representative for all parts of clearcuts on moraine soils. Accordingly, the stone sizes were exponentially distributed with the distribution fixed by the difference between the terrain models’ mean stone volume (Table 1) and the threshold stone volume.
Because we modelled moraine soils, stone spatial distribution is totally random (Andersson et al. 1977). To save on computing costs, the stones’ spatial distributions within the type stands are allocated only when planting devices commence digging in the ground. Based on recommendations from planting device manufacturers and on field observations, stones were assumed to hinder the mounding and planting tasks when stone volume exceeded 8 dm3 and 1 dm3 respectively.
2.2 Machine models
2.2.1 Physical description
Two types of base machines were modelled, one-armed (1a) and two-armed (2a) tracked excavators, on which one- (1h) or two-headed (2h) planting devices were mounted (Fig. 2). We assumed both types of base machines to be 21 tonne tracked excavators and that the 2a-machines have two sets of standard outer booms and dippersticks from 14 tonne excavators mounted on the crane pillar via an attachment plate. In all models, the minimum (CRMin) and maximum (CRMax) on-ground crane reach was 4 m and 9 m respectively. The 1h- and 2h planting devices were assumed to be the Bracke Planter (with a 40 cm wide mounding blade (WMB)) and M-Planter (with two 45 cm wide mounding blades, 201 cm between planting dibbles and 247 cm total width of device (WTotal)) respectively. Further technical specifications for all four machine configurations are shown in Table 2.
| Table 2. The assumed technical specifications of the machine models. | ||||
| Description | 1a1h | 1a2h | 2a2h | 2a4h |
| Crane arms | 1 | 1 | 2 | 2 |
| Planting heads | 1 | 2 | 2 | 4 |
| Total machine mass (t) | 22.5 a) | 23 a) | 27 b) | 27.5 b) |
| Seedlings per reload | 72 c) | 162 c) | 144 | 324 |
| a) Including standard monoblock boom and dipperstick (3 tonnes), rotator (0.4 tonnes) and one planting device (Bracke Planter: 1.1 tonnes / M-Planter: 1.5 tonnes). b) Including crane pillar from two-piece boom (1.1 tonnes), two smaller sized outer booms and dippersticks (3 tonnes), attachment plate (1 tonne), one extra rotator and one extra planting device. c) According to Rantala et al. (2009). | ||||
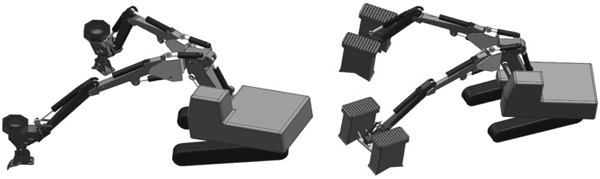
Fig. 2. Conceptual two-armed excavator with one-headed (2a2h, left) and two-headed (2a4h, right) planting devices. Seedlings are reloaded piecewise into carousels mounted on top of each planting device.
For the 2a-machines, the attachment plate allows both cranes to move vertically and laterally independent of another. For machine stability reasons, we limited the lateral range of motion to maximum 45° outwards (θMax) from parallel for each arm (Fig. 3). Conversely, the minimum angle (θMin) was set to 0° (in relation to the crane pillar). Furthermore, we assumed that rotators mounted between the planting devices and the dippersticks allow the base machine to slew and each 2a-crane to move while the other is working. This permits the planting devices to maintain a specific angle in relation to the base machine despite slewing (Jundén 2011).
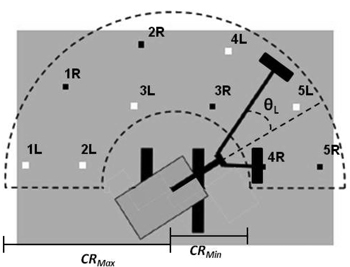
Fig. 3. The semiannular working area, work pattern, radial limits (CRMax and CRMin), and the left arm’s lateral angle (θL) of the 2a4h model. The ten small squares are the ideally spaced crane stops in numerical order for two-headed planting devices; the white and black squares for the left (L) and right arm (R) of two-armed machines respectively. The working area was assumed to be equally large for all four machine models.
2.2.2 Work tasks
When reforesting the terrain model, each machine model executed four main tasks (moving crane, choosing microsite, mounding and planting) and two secondary tasks (moving base machine and reloading seedlings; Table 3). Because today’s planting machines are intermittently advancing, the main tasks were performed recurrently at machine stationary points while the secondary tasks were performed when the stationary point was reforested (sufficient number of seedlings planted or no suitable microsites remaining) or when the planting devices needed to be refilled with seedlings.
The time consumption when moving the base machine (tBM) between stationary points (Eq. 1) was modelled as follows:

where CBM is a constant for base machine movement, SBM is the distance between stationary points (always 6 m; cf. Jundén 2011) and VBM is the base machine velocity. Due to the 2a-machines being heavier and more cumbersome, we assumed their VBM to be 25% lower and their CBM to be 50% higher than for 1a-machines (Table 4).
Per seedling, time studies have shown that less time is required to reload seedlings with 2h planting devices than 1h-devices (Rantala et al. 2009). Similarly, because the operator loads more seedlings per cab exit, we also assumed this task to be faster per seedling for 2a- than 1a- machines (Table 3).
| Table 3. Time consumption coefficients for the machine models’ work tasks. | |
| Task | Value (s) |
| Mounding, total time | 5 a) |
| Digging | 3 |
| Heaping | 2 |
| Planting, total time | 3 a) |
| Dibble down | 1 |
| Release seedling | 1 |
| Dibble up and firm soil | 1 |
| Halting mounding or planting | 1 |
| Remounding | 5 |
| Switching operator focus between planting arms | max 2 b) |
| Reloading seedlings | 223 c), 366 c), 362, 648 d) |
| a) Values are approximations sourced from manufacturers b) For 2a-machines only, see section 2.3.2 c) From Rantala et al. (2009) d) For 1a1h, 1a2h, 2a2h, 2a4h respectively | |
| Table 4. Coefficients for modelling crane pillar, outer boom and base machine movement. | ||
| Parameter | Unit | Value (s) |
| CCrane | s | 1.5 a) |
| CLat | s | 0.1 a) |
| CRad | s | 0.1 a) |
| CBM | s | 5 a) and 7.5 b) |
| VSlew | ° s–1 | 71 c) |
| VLat | ° s–1 | 15 c) |
| VRad | m s–1 | 1.6 c) |
| VBM | m s–1 | 0.3 d) and 0.23 b) |
| a) From Eliasson (1999) b) For 1a- and 2a-machines respectively c) Values sourced from manufacturers d) According to measurements from Karlsson (2007) | ||
2.3 The simulation model
The simulations were manually coded using the Python programming language while using the discrete-event simulation library SimPy for time and queue handling (Jundén 2011). The simulation tool imported data files of Herlitz’s (1975) type stands, allowed for visualization of the machines’ work (Fig. 4) and outputted parameter values, time consumption data (per planting head) and planting results (including unsuccessful attempts) as Excel files.
The clearcuts’ reforestation criteria were set to mimic typical southern Swedish conditions with 2000 seedlings per ha target stocking rate and 1.5 m minimum spacing between planted seedlings (Petersson and Lindén 2010).
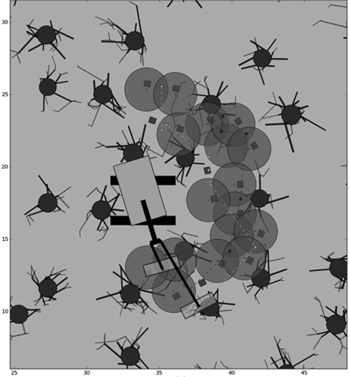
Fig. 4. Screen snapshot of the SimPy discrete-event simulation tool’s visualization feature.
2.3.1 Work pattern
Simulating was done at the level of machine stationary points but the machine movement and seedling reloading tasks were registered at the clearcut level. This means that the base machine was stationary and only the cranes moved during simulation runs. Because we assumed that the planting machine always worked in a semicircle, the total working area per machine stationary point (AWork) was given by Eq. 2:

where CRMax and CRMin are the maximum and minimum on-ground crane reach respectively. Thereafter, the number of ideal planting spots (IPS) to be uniformly positioned minimum 1 m from AWork’s borders was calculated using Eq. 3:

where TSR is the target stocking rate and NHead is the planting device’s number of heads. These ideal planting spots were used as starting points for choosing microsites (i.e. exact coordinates for mounding), and crane movement to ideal planting spots (steer planting device-processes in Fig. 5) was assumed to be automated for the 2a-machines. Because slewing was prioritized over radial (and lateral for 2a-machines) crane motion, the resulting work pattern favoured angular movement between ideal planting spots while minimizing total travel distance. Overall, the time consumed when moving a crane (tCrane) with the 2a-machine model was calculated using Eq. 4 and 5 (modification of Eliasson (1999); not modified for 1a-machines):

while
![]()
where CCrane, CLat and CRad are constants associated with crane pillar, lateral outer boom and radial outer boom movement respectively; VSlew, VRad and VLat are the slewing, radial crane and outer boom lateral velocities respectively; θCP is the crane pillar’s angular distance to reach the position (θBest) where the combined angle of the left (θL) and right arm (θR) is minimized; θOB is the outer boom’s angle between the target microsite and θBest; and r is the radial distance in m. By restricting the crane pillar to the θBest position, we assumed that machine stability and operator comfort would be maximized.
Fig. 5 illustrates the algorithm for determining the machine models’ work pattern. Each simulation started with the crane moving to the leftmost planting spot, and ended when the last ideal planting spot had been investigated. 2a-machines could only move the outer booms laterally one at a time. In all simulations, machine stationary points were randomly allocated over the clearcut.
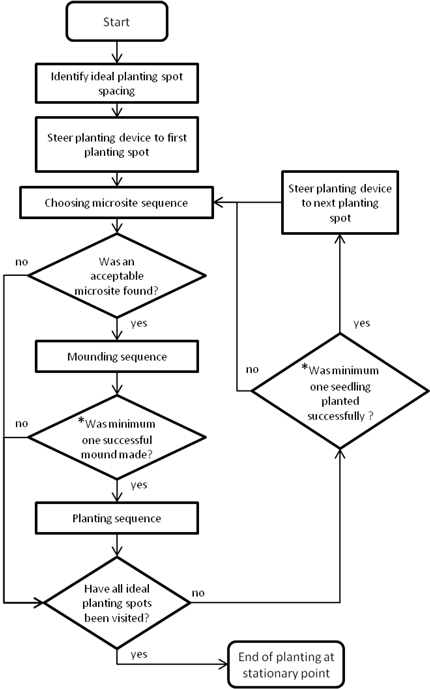
Fig. 5. Flowchart for determining the machine models’ work pattern (* only relevant for two-headed planting devices).
2.3.2 Choosing microsites
The operator was always needed for the microsite selection task. Being visible to the operator, the root plates and main lateral roots forced the operator to seek 1m × WMB and 1m × WTotal obstacle-free rectangular microsites for 1h- and 2h planting devices respectively. The operator searched in an Archimedean spiral (Jundén 2011; Fig. 6) as we assumed this imitates how human operators search for suitable microsites based on the ideal seedling spacing criterion. We assigned a time penalty for 2h planting devices to reflect operators’ greater difficulty in finding obstacle-free microsites with two-headed crane-mounted mounding devices (von Hofsten and Petersson 1991). This time penalty (CHM, in seconds), which was only assigned when a microsite was successfully identified, was calculated using Eq. 6:
![]()
where nStump is the number of stumps within working area i. Contrariwise, 2a-machines were assigned a time penalty whenever the operator switched focus between arms (Table 3). However, if the operator was idle prior to switching focus, this idle time was subtracted from the focus switching time meaning that this time penalty was sometimes nullified.
For simplification, we assumed that the CCrane constant included the time consumed when precisely positioning planting devices at the microsites’ midpoints.
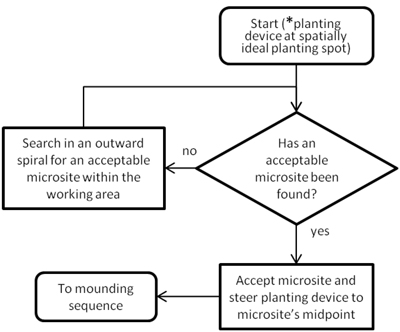
Fig. 6. Flowchart for choosing microsites with two-armed machines (* relevant for automated two-armed crane movement).
2.3.3 Mounding
During scarification, we assumed that a half-cylinder (WMB wide) of soil was removed from the ground and inverted in front of the scoop towards the machine (Fig. 7). We assumed the mounds to maintain their half-cylinder form, giving mound heights and scoop depths in accordance to those of the Bracke Planter in Luoranen et al. (2011) and mound volumes ranging from 25–38 dm3. According to Arvidsson et al. (1988), mound volume is satisfactory when exceeding 20 dm3.
Mounding had to be aborted under two circumstances: when individual stones over the immobile limit were present, or when an impeding root was more perpendicular than parallel to the mounding blade (Fig. 8). Alternatively, when impeding roots were more parallel than perpendicular, the mounding task was assumed to be successful as long as more soil was gathered via remounding (according to planting machine contractors, digging one additional time at the same microsite is sufficient to gather enough additional soil to plant successfully).
With 2h planting devices, when only one planting head was unsuccessful in mounding, then that planting head automatically raised itself above the ground surface while the successful head finished mounding. Thereafter, if remounding was allowed, the operator remounded with the unsuccessful head and both heads proceeded to planting. If, however, the unsuccessful head had to abort mounding, then that head waited until the successful head had finished the planting sequence. The mounding task was assumed automated for 2a-machines.
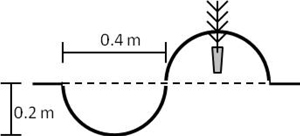
Fig. 7. Dimensions of the simulated scoops and mounds (the dashed line represents ground level). The seedlings were assumed to be cultivated in Hiko v93 trays (cf. Ersson et al. 2011) and having a standard root plug length of 9 cm.
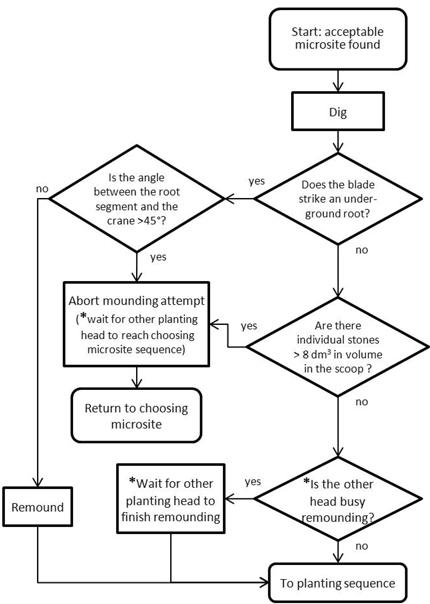
Fig. 8. Flowchart for mounding with two-headed planting devices (* only relevant for two-headed planting devices).
2.3.4 Planting
As per today’s planting devices, the planting task in our models was always automated. To simulate how aggregate numbers of stones could hamper the dibble, seedlings could not be planted in mounds whose total volume of threshold-exceeding stones surpassed 8 dm3 (Fig. 9).
Thereafter, the planting dibbles had two reattempts with successively smaller chance of failure to plant the seedling (we assumed that the hydraulic force of planting dibbles could displace all stones <1 dm3). According to manufacturer specifications, both the Bracke Planter and M-Planter’s dibbles penetrate to maximum 15 cm depth. Thus, stones in the ground underneath the mounds never hampered the planting dibbles (Fig. 7). Nevertheless, if both reattempts failed, we assumed that remounding would add enough soil to the present mound that planting ultimately succeeded. Consequently, as during mounding, individual planting heads ran the risk of queuing during planting with 2h planting devices (Fig. 9).
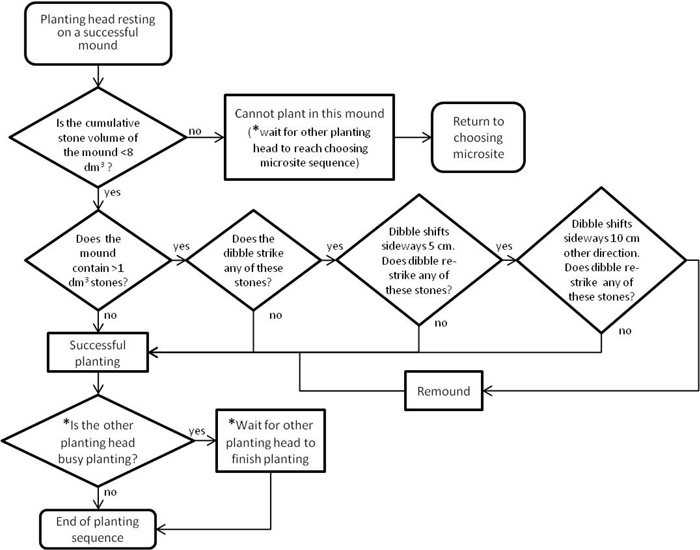
Fig. 9. Flowchart for planting with two-headed planting devices (* only relevant for two-headed planting devices).
2.4 Basic scenario and sensitivity analysis
In the basic scenario, our four machine models reforested terrain models 0–5, giving 24 treatment combinations in all. Because each simulation was limited to a single machine stationary point, we replicated all treatments (both in the basic scenario and sensitivity analysis) minimum 50 times; the exact number depending on when the planting heads had to be reloaded with seedlings. In each replication, machine stationary points were randomly allocated over the clearcut.
In the sensitivity analysis, conceivable variations to the machine and simulation models were made to explore the effect of chosen parameter values (Table 5) on the simulated planting machine productivities on terrain model 5 (moderate stump and stone frequency). Among others, we tried increasing the planting devices’ radial (and lateral in the 2a-machine models) range of motion and varying some key dimensional attributes of the planting devices. With the simulation model, we tried varying TSR to mimic how planting machine operators in reality tend to modify the stocking rate of each individual machine stationary point, and we tested the effect of less stringent minimum seedling spacing requirements.
The basic scenario assumed the 2a-machines’ crane movement to the next geometrically ideal crane stop and the mounding task to be automated. Because of the presumably high costs associated with semi-automating the cranes, we tested the effect on time consumption of making one or both of these tasks manually controlled.
| Table 5. Change in parameter values from the basic scenario. | ||||
| Parameter | Unit | Basic scenario | Sensitivity analysis | |
| Minimum | Maximum | |||
| Machine model | ||||
| Maximum crane reach (CRMax) | m | 9 | 9 | 11 |
| 2a attachment plate location (from swing point) | m | 3 | 3 | 5 |
| 2a lateral range of motion (θ) | degrees (°) | min 0, max 45 | –20 | 60 |
| Radial crane velocity (VRad) | m s–1 | 1.6 | 0.8 | 3.2 |
| Mounding blade width (WMB) | cm | 40/45a) | 40 | 60 |
| Distance between planting dibbles a) | cm | 201 | 100 | 201 |
| Simulation model | ||||
| Minimum seedling spacing | m | 1.5 | 1 | 1.5 |
| Target stocking rate (TSR) | pl ha–1 | 2000 | 1500 | 2500 |
| a) For 2h planting device. | ||||
3 Results
3.1 Basic scenario
Under the basic assumptions, TC (time consumption) per planted seedling excluding seedling reloading increased for all four machine models as the number of obstacles, and especially the boulder quota increased (terrain models 0–4, Fig. 10). 1a1h was the least sensitive to more obstacles while 2a4h was the most sensitive, TC increased by 22% and 75% respectively from terrain model 0to 4. 1a2h was the quickest machine model on terrain model 4, the most obstacle-rich clearcut. TC per planted seedling was consistently lower with 1a2h than 2a2h on all types of clearcuts. Under moderate clearcut conditions (terrain model 5), 1a2h was 19.5% faster than 2a2h but only 5.5% slower than 2a4h.
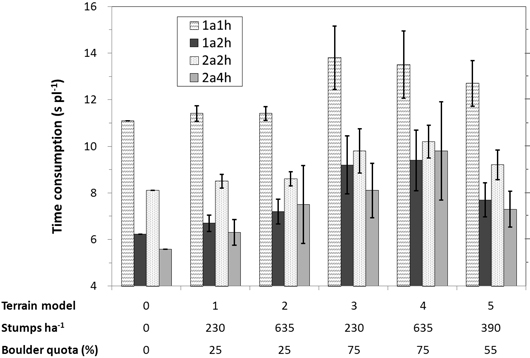
Fig. 10. The four machine models’ mean time consumption per planted seedling excluding seedling reloading on the deterministic terrain model (0) and the five terrain models with stochasticity (1–5). Vertical bars are the range.
3.2 Sensitivity analysis
As revealed by Fig. 11, longer cranes (10–11 m maximum crane reach) benefitted especially 2a4h while shifting the 2a attachment plate location outwards to 4–5 m from the swing point increased the 2a-machines’ TC by 5–25%. Surprisingly, neither allowing the arms to cross (θMin = –20°, 2a lateral range of motion) nor quicker radial crane movement made the 2a-machines markedly faster.
Adjusting the dimensional attributes of the planting devices had some of the following effects: TC decreased by 8.2% for 2a4h when planting dibble distance was only 1 m on the 2h-devices, and TC increased markedly for 1a-machines but not 2a-machines when mounding blade width on both 1h- and 2h-devices increased to 60 cm (results not shown).
Reducing the degree of crane automation increased TC for both 2a-machines (Fig. 12, left), and automated mounding was especially critical (compare ManMove, AutoMound versus ManMove, ManMound). Without automation, the proportion of TC when an arm was queuing increased, averaging circa 5% for 2a2h on terrain model 5 and increasing to circa 7%, 43% and 65% as the degree of crane automation decreased.
The sensitivity analyses also indicate the machine models’ comparative competitiveness is rather insensitive to modified silvicultural prescriptions (Fig. 12, right). Increasing or decreasing the TSR by 500 seedlings per ha had limited effect on most machine models. Nevertheless, reducing the minimum spacing between planted seedlings from 1.5 m to 1 m reduced TC for 2a4h by 11%.
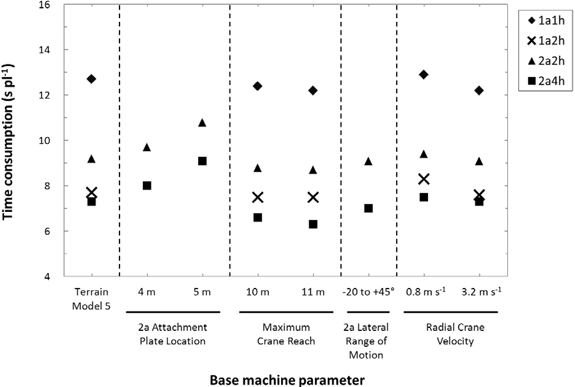
Fig. 11. The effect of selected base machine parameter values on the machine models’ simulated mean time consumption per planted seedling excluding seedling reloading when reforesting terrain model 5. The 2a attachment plate location and 2a range of motion parameters are only relevant for 2a-machines.
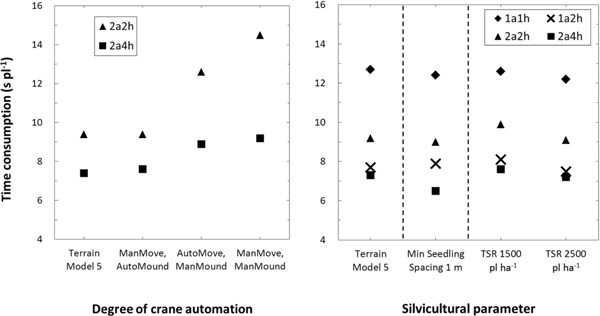
Fig. 12. The effect of simpler two-armed automation regimes (left) and different silvicultural prescriptions (right, see Table 5 for parameter clarification) on the machine models’ mean time consumption per planted seedling excluding seedling reloading when reforesting terrain model 5. Man: manually controlled; Auto: automated; Move: moving crane between planting spots; Mound: mounding; TSR: target stocking rate.
3.3 Planting machine productivity
2h-devices were comparatively faster per seedling during on-ground work (mounding and planting, Table 6). Because of its four planting heads, mounding was not 2a4h’s most time consuming task as it was for the other machine models. Nonetheless, as we assumed 2a-machines to be more awkward on forest terrain, they spent a greater proportion of time moving the base machine compared to 1a-machines.
Fig. 13 gives total TC including seedling reloading expressed as planted seedlings per effective hour (E0, time excluding all delays). As can be seen, also when adding seedling reloading, 2a2h’s productivity remained lower than 1a2h’s productivity on all terrain models. Similarly, despite having four planting heads, 2a4h only increased productivity by 87% and 71% compared to 1a1h on the obstacle-free and moderate terrain respectively.
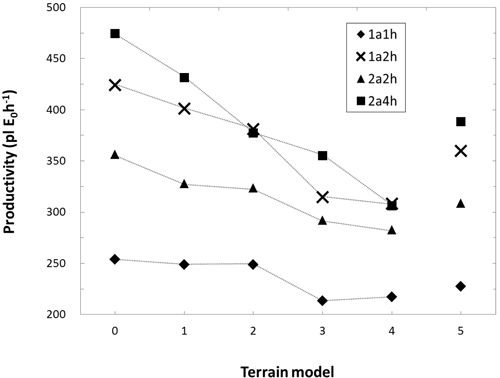
Fig. 13. Mean productivity (planted seedlings per effective hour including seedling reloading) per machine and terrain model (see Table 1 for terrain model clarification).
| Table 6. Average time consumption (TC) values and proportions per machine model and work element when reforesting terrain model 5. | |||||||||
| Work element | TC (s pl–1) | Proportion of TC (%) | |||||||
| Machine model | |||||||||
| 1a1h | 1a2h | 2a2h | 2a4h | 1a1h | 1a2h | 2a2h | 2a4h | ||
| Main task | |||||||||
| Moving crane | 2.59 | 1.83 | 2.31 | 2.15 | 16.3 | 18.3 | 19.8 | 23.2 | |
| Choosing microsite | - | 0.28 | - | 0.29 | - | 2.8 | - | 3.1 | |
| Mounding (incl. halting mounding and remounding) | 5.72 | 2.85 | 2.91 | 1.71 | 36.1 | 28.4 | 25.0 | 18.4 | |
| Planting (incl. halting planting and reattempts) | 3.28 | 1.60 | 1.62 | 0.98 | 20.7 | 16.0 | 13.9 | 10.6 | |
| Switching operator focus between planting arms | - | - | 0.74 | 0.46 | - | - | 6.3 | 5.0 | |
| Secondary task | |||||||||
| Moving base machine | 1.16 | 1.20 | 1.58 | 1.69 | 7.3 | 11.9 | 13.5 | 18.2 | |
| Reloading seedlings | 3.10 | 2.26 | 2.51 | 2.00 | 19.6 | 22.6 | 21.5 | 21.5 | |
| Total | 15.84 | 10.01 | 11.67 | 9.27 | 100 | 100 | 100 | 100 | |
4 Discussion
According to our simulations, 2a-excavators do not increase the productivity of intermittently advancing tree planting machines compared to 1a-excavators. Productivity was lower for 2a2h than 1a2h on all terrain types. Thus, for planting machines with two planting heads, it was consistently better to have them attached to one crane instead of two.
Instead, it seems that increasing the total number of planting heads is the key to raising planting machine productivity. Having four planting heads, 2a4h increased average productivity on moderate terrain by 8% compared to 1a2h. However, this productivity increase is almost certainly not enough for 2a4h to compete cost-wise with 1a2h. On average, for 2a4h to be more cost-efficient than 1a2h, the hourly cost of 2a4h cannot increase more than 8% from 1a2h’s hourly cost. According to Rantala et al. (2009), the fixed costs of one M-Planter device comprises circa 13% of 1a2h’s total hourly cost. Thus, 2a4h’s average productivity increase would not even compensate for the fixed cost of the extra M-Planter device, let alone the base machine modification costs, the added fuel consumption of the heavier base machine, the added repair and maintenance costs (Mellgren 1989), and the reduction in productivity because of more frequent relocations (Rantala et al. 2009).
Our results also show that semi-automation is a crucial prerequisite for 2a planting machines, and that automated mounding is especially important (Fig. 12, left). Despite today’s lack of operationally reliable sensors, automated crane movement (e.g. AutoMove) might be feasible in the near-future (Mettin et al. 2009) but probably not automated mounding (AutoMound). According to planting device manufacturers, creating correctly sized, good quality mounds on variable terrain is a much more complex task than general crane movement. Without automated mounding, 2a4h was 9.4% less productive compared to 1a2h on moderate terrain.
Compared to real-life time studies of excavator-mounted Bracke Planters, our 1a1h machine model overestimated productivity under moderate conditions by only 4.1% (Engqvist and Moretoft 1993), while productivity on clearcuts similar to terrain model 2 was underestimated by 2.0% (von Hofsten 1993) and 6.4% (Rantala et al. 2009) respectively; the latter comparison being based on the maximum measured productivity figure of an experienced operator. Other time studies of the Bracke Planter have reported lower productivities, but validating our machine models against those productivity levels is not relevant because it is important that simulation studies of conceivable forest machines highlight those productivity levels that are potentially attainable (Lindroos 2012). On the other hand, on clearcuts similar to terrain model 2, our 1a2h machine model overestimated productivity by 8.5% compared to the maximum productivity figures of an experienced M-Planter operator measured by Rantala et al. (2009). One possible explanation for this overestimation could be that the choosing microsite time penalty (Eq. 6) for 2h-devices was not severe enough in our simulation model.
As long as they are validated, discrete-event simulations can be used to make decisions regarding forest machine development (Asikainen 1995). Being based on terrain, machine, and simulation models, our study resembles that of Andersson et al. (1977) whose simulations correctly pointed to the superiority of planting dibbles compared to two types of plowing heads when tree planting mechanically on moraine soils. We are therefore confident that our results realistically predict 2a planting machines’ potential productivity despite defining Nordic clearcut conditions as only comprising stumps, roots and stones. Rantala et al. (2009) showed that the productivity of today’s planting devices is negatively correlated mainly with the occurrence of stones, stumps and slash. But since slash is harvested for bioenergy on >75% of the clearfelled area in southern Sweden (Skogsstyrelsen 2012), slash is often not a major obstacle during mechanized planting. Indeed, Finnish follow-up studies of operational M-Planters confirmed the absence of slash as a major productivity influencing factor while highlighting the significant influence of stones and stumps (Rantala and Laine 2010). However, since 1h-devices suffer more from the presence of slash than 2h-devices (Rantala et al. 2009), the productivity advantage of 2h-devices in our simulations could have been even greater if our terrain models included slash.
Our 2a-machine models assumed that operators would need two seconds when switching focus from one working crane to another. Using technical solutions or for experienced or skilled operators, this work task could perhaps become redundant. Assuming instant operator focus switching, 2a4h’s productivity increases by circa 5% on moderate terrain, becoming 13% higher than that of 1a2h.
We restricted the outer booms of 2a-machines to move laterally only one at a time. Alternatively, we can reasonably assume that the operator could handle moving both arms simultaneously on obstacle-free terrain (terrain model 0). If so, the productivity of 2a4h improves to 595 pl E0h–1, thus making it 40% more productive than 1a2h. However, this work method is unrealistic when obstacles are present and would quickly have to be abandoned once sub-surface obstacles disrupt the planting heads’ on-ground work.
Nevertheless, our models can be improved. First, more modern type stands could be used to better reflect the stump frequencies, stump spatial and diameter distributions, and species compositions found on today’s clearcuts. Second, it would be more realistic to expand the terrain model by including humus layers and surface boulders, especially the latter since stones in our present terrain model are only invisible, underground obstacles. Third, our machine models assume constant TC values for the mounding task which is perhaps too simplistic. Furthermore, our simulation model assumes that remounding always leads to successful mounding and planting which might be a bit sweeping. Despite these limitations, our models and simulation results are complete enough to provide valid guidance for the technical development of Nordic tree planting machinery.
5 Conclusions
To summarize, we have modelled 1a- and 2a intermittently advancing planting machines which interact in a discrete-event simulator with stochastic terrain models during mounding and planting. Our simulation results show that 2a-excavators do not improve planting machine productivity on clearcuts with underlying moraine soils (compare 1a2h with 2a2h). Moreover, we reveal that the 2a planting machines’ competitiveness would be strongly reliant on further development of automated work tasks, especially mounding. Accordingly, we establish that the 2a planting machines’ cost-efficiency would be poor, especially when accounting for the added necessary investment costs. Rather, we conclude that it is increasing the number of planting heads per planting device which seems to have the best theoretical potential to increase productivity, even on obstacle-rich terrain. Further simulation studies are needed to explore the possible advantages of new types of multi-headed crane-mounted planting devices.
References
Andersson P.-O., Berglund H., Bäckström P.-O. (1977). Simulering av maskinella planteringsorgans arbete. [Simulating the operation of mechanized planting units]. Forskningsstiftelsen Skogsarbeten, Redogörelse nr 7.
Arvidsson P.-Å., Nääs J.-E., Spångberg E. (1988). Öje-högen och Bräcke högläggare – en studie av höglägging på svåra marker. [Öje- and Bräcke Mounders – a study of mounding on difficult sites]. Forskningsstiftelsen Skogsarbeten, Resultat nr 20.
Asikainen A. (1995). Discrete-event simulation of mechanized wood-harvesting systems. Dissertation. University of Joensuu, Faculty of Forestry.
Berg S. (1982). Terrängtypschema. [Terrain classification system for forestry work]. Forskningsstiftelsen Skogsarbeten. ISBN 91-7614-078-4.
Björkhem U., Lundeberg G., Scholander J. (1975). Root distribution and compressive strength in forest soils. Root mapping and plate loading tests in thinning-stage stands of Norway spruce. Institutionen för växtekologi och marklära. Skogshögskolan. Rapporter och Uppsatser nr 22.
Brunberg B., Fries C. (1985). Högläggning med grävmaskin. [Mounding with excavators]. Forskningsstiftelsen Skogsarbeten, Resultat nr 16.
Eis S. (1974). Root system morphology of western hemlock, western red cedar, and Douglas-fir. Canadian Journal of Forest Research 4: 28–38.
Eliasson L. (1999). Simulation of thinning with a single-grip harvester. Forest Science 45(1): 26–34.
Engqvist M., Moretoft M. (1993). Tidsstudie och produktionsuppföljning på Öje-Planter sommaren 1993. [Time study and production follow-up of an Öje-Planter during summer 1993]. Norra Skogsinstitutet, SLU. Fördjupningsuppgift.
Eriksson C.P., Holmgren P. (1996). Estimating stone and boulder content in forest soils – evaluating the potential of surface penetration methods. Catena 28(1–2): 121–134.
Ersson B.T. (2010). Possible concepts for mechanized tree planting in southern Sweden – an introductory essay on forest technology. Department of Forest Resource Management, SLU, Arbetsrapport 269. ISSN 1401-1204. ISRN SLU-SRG-AR-269-SE.
Ersson B.T., Petersson M. (2011). Uppföljning av planteringsmaskinen 2011 – färska planteringar. [Follow-up of the planting machine year 2011 – freshly planted seedlings]. Skogsavdelningen. Södra Skog. Rapport S042.
Ersson B.T., Bergsten U., Lindroos O. (2011). The cost-efficiency of seedling packaging specifically designed for tree planting machines. Silva Fennica 45(3): 379–394.
Hansson A., Servin M. (2010). Semi-autonomous shared control of large-scale manipulator arms. Control Engineering Practice 18(9): 1069–1076.
Härkönen M. (2008). M-Planter- ja Bräcke-istutuskoneiden työn laatu. [Work quality of M-Planter and Bräcke forest planting machines]. M.Sc. thesis. University of Joensuu, Faculty of Forest Sciences.
Herlitz A. (1975). Typbestånd i slutavverkning. [Typestands for clear cutting]. Institutionen för skogsteknik, Skogshögskolan, Rapport nr 81.
von Hofsten H. (1993). Hög kvalitet även på högkvaliteten med Öje-Planter. [The Öje Planter machine – good performance at a competitive cost]. Skogforsk, Resultat nr 3.
von Hofsten, H. & Petersson, G. (1991). Högläggning med Öje-högen. [Mounding with Öje-högen]. Forskningsstiftelsen Skogsarbeten, Resultat nr 7.
Jundén L. (2011). Discrete event simulations in forest technology. Master’s thesis. Department of Physics/UMIT Research Lab, Umeå University.
Jundén L., Bergström D., Servin M., Bergsten U. (In press). Simulation of boom-corridor thinning using a double-crane system and different levels of automation. International Journal of Forest Engineering.
Kalliokoski T., Sievänen R., Nygren P. (2010). Tree roots as self-similar branching structures: axis differentiation and segment tapering in coarse roots of three boreal forest tree species. Trees 24(2): 219–236.
Karlsson J.( 2007). Produktivitet vid stubblyftning. [Productivity during stump lifting]. Department of Forest Resource Management, SLU, Arbetsrapport 168.
Larsson T. (1976). Blockförekomst i skogsmark. [Occurence of stones in forest soils]. Forskningsstiftelsen Skogsarbeten, Ekonomi nr 4.
Lindroos O. (2012). Evaluation of technical and organizational approaches for directly loading logs in mechanized cut-to-length harvesting. Forest Science 58(4): 326–341.
Luoranen J., Rikala R., Smolander H. (2011). Machine planting of Norway spruce by Bracke and Ecoplanter: an evaluation of soil preparation, planting method and seedling performance. Silva Fennica 45(3): 341–357.
Mattson S. (1997). EcoPlanter, planteringsmaskin med fräs. [The EcoPlanter: a mounder-equipped planting machine]. Skogforsk, Resultat nr 4.
Mellgren P.G. (1989). More reliable multi-function wood-harvesting machines in the future? International Journal of Forest Engineering 1(1): 17–22.
Mettin U., Westerberg S., Shiriaev A.S., La Hera P.X. (2009). Analysis of human-operated motions and trajectory replanning for kinematically redundant manipulators. In: 2009 IEEE/RSJ International Conference on Intelligent Robots and Systems. IEEE, St. Louis, USA. p. 795–800.
Newnham R.M. (1968). Simulation models in forest management and harvesting. Forestry Chronicle 44(1): 7–13.
Nilsson U., Örlander G. (1999). Vegetation management on grass-dominated clearcuts planted with Norway spruce in southern Sweden. Canadian Journal of Forest Research 29(7): 1015–1026.
Normark E., Norr M. (2002). EcoPlanter – sammanställning av ett utvecklingsprojekt. [EcoPlanter – a compilation of the development project]. Skogsvårdsavdelningen, Holmen Skog.
Örlander G., Nilsson U. (1999). Effect of reforestation methods on pine weevil (Hylobius abietis) damage and seedling survival. Scandinavian Journal of Forest Research 14(4): 341–354.
Örlander G., Gemmel P., Wilhelmsson C. (1991). Effects of scarification, planting depth and planting spot on seedling establishment in a low humidity area in southern Sweden. Institutionen för skogsskötsel, SLU, Rapport nr 33.
Ozier-Lafontaine H., Lecompte F., Sillon J.F. (1999). Fractal analysis of the root architecture of Gliricidia sepium for the spatial prediction of root branching, size and mass: model development and evaluation in agroforestry. Plant and Soil 209(2): 167–180.
Petersson M., Lindén M. (2010). Södras planteringsstandard för entreprenörer. [Södra’s standards for tree planting]. Södra Skog.
Petersson M., Örlander G., Nordlander G. (2005). Soil features affecting damage to conifer seedlings by the pine weevil Hylobius abietis. Forestry 78(1): 83–92.
Rantala J., Laine T. (2010). Productivity of the M-Planter tree-planting device in practice. Silva Fennica 44(5): 859–869.
Rantala J., Harstela P., Saarinen V.-M., Tervo L. (2009). A techno-economic evaluation of Bracke and M-Planter tree planting devices. Silva Fennica 43(4): 659–667.
Sängstuvall L., Bergström D., Lämås T., Nordfjell T. (2012). Simulation of harvester productivity in selective and boom-corridor thinning of young forests. Scandinavian Journal of Forest Research 27(1): 56–73.
Sjunnesson S. (1970). Simulation as a tool for analysis of man/machine systems for thinning. Skogshögskolan, Institutionen för skogsteknik, Rapporter och Uppsatser nr 42.
Skogsdata. (2012). Skogsdata 2012. [Forest statistics 2012]. Department of Forest Resource Management, SLU.
Skogsstyrelsen. (2012). Skogsstatistisk årsbok. [Swedish statistical yearbook of forestry]. Swedish Forest Agency.
Stendahl J., Lundin L., Nilsson T. (2009). The stone and boulder content of Swedish forest soils. Catena 77(3): 285–291.
Talbot B., Nordfjell T., Suadicani K. (2003). Assessing the utility of two integrated harvester-forwarder machine concepts through stand-level simulation. International Journal of Forest Engineering 14(2): 31–43.
Wang J.X., LeDoux C.B., Li Y.X. (2005). Simulating cut-to-length harvesting operations in Appalachian hardwoods. International Journal of Forest Engineering 16(2): 11–27.
Wilson B.F. (1975). Distribution of secondary thickening in tree root systems. In: Torrey J.G, Clarkson D.T (eds.). The development and function of roots. Academic Press, London. p. 197–219.
Wu T., Bettadapura D., Beal P. (1988). A statistical model of root geometry. Forest Science 34(4): 980–997.
Total of 47 references
Appendix 1. Comprehensive root models for Picea abies, Pinus sylvestris and Betula spp.
Root plate and initial values for main lateral roots
First, we used three equations based on the deterministic functions from Björkhem et al. (1975). The area of each stump and root plate/ZRT was calculated using Eq. A1:

where Arp is the root plate area in m2 and DStump is the tree’s stump diameter in mm. Arp is centered in the middle of the stump. Thereafter, Eq. A2 and A3 were used to determine the number and mean initial radius of the main (first-order) lateral roots which spread out from the root plate’s edge.
![]()
where n is the number of main (first-order) lateral roots at the perimeter of root plate (0.5 m from the stump’s outer edge) and Dbh is the tree’s diameter at breast height in mm; and
![]()
where rR is the mean radius of each main (first-order) lateral root in mm. The main lateral roots’ starting points are evenly distributed around the outer edge of root plate based on a random azimuth (horizontal direction).
Secondary and tertiary roots
Similar to Kalliokoski et al.’s (2010) segment-tapering root model, we modelled all individual roots using segments and nodes. Because roots were only considered obstacles down to 20 mm in diameter, our stumps forked down only to the tertiary level. The length of each root segment is given by γ. Each root segment including main lateral roots tapers (ie. has a larger initial (rini) than terminal radius (rfinal )), and this rate of taper was calculated using Eq. A4:
![]()
where tfi is the roots’ taper factor (Table A1) and i is how many roots the previous node forked into. The parameter values for tfi were based on Björkhem et al.’s (1975) functions for root tapering.
Each segment ends with a node at which the parent segment may, with varying probabilities fi, produce (fork into) i number of subsequent child segments (Table A1). Because Kalliokoski et al. (2010) report that the probability of nodes producing four children is < 0.05 (5%), we simplified our model by only allowing nodes to produce one to three child segments.
| Table A1. The sources, mean values and standard deviations (s) of the root model parameters. | |||||
| Parameter | Description | Source | Picea abies Mean (s) | Pinus sylvestris Mean (s) | Betula spp. Mean (s) |
| tf1 | Taper factor for segments from non-forking node | Björkhem et al. 1975 | 0.04 (0.0206) | 0.04 (0.0206) | 0.04 (0.0206) |
| tf2 | Taper factor for segments from node with two child segments | Björkhem et al. 1975 | 0.096 (0.0156) | 0.096 (0.0156) | 0.096 (0.0156) |
| tf3 | Taper factor for segments from node with three child segments | Jundén 2011 | 0.1 (0.011) | 0.1 (0.011) | 0.1 (0.011) |
| f1 | Probability of node producing one child segment | Kalliokoski et al. 2010 | 0.09 | 0.14 | 0.11 |
| f2 | Probability of node producing two child segments | Kalliokoski et al. 2010 | 0.78 | 0.77 | 0.70 |
| f3 | Probability of node producing three child segments | Kalliokoski et al. 2010 | 0.13 | 0.09 | 0.19 |
| q1 | Allocation factor for node producing one child segment | Kalliokoski et al. 2010 | 1 | 1 | 1 |
| q2 | Allocation factor for node producing two child segments | Kalliokoski et al. 2010 | 0.7/0.3 | 0.7/0.3 | 0.7/0.3 |
| q3 | Allocation factor for node producing three child segments | Jundén 2011 | 0.5/0.25/0.25 | 0.5/0.25/0.25 | 0.5/0.25/0.25 |
| α | Segment vertical angle (°) | Kalliokoski et al. 2010 | 12 | 13 | 12 |
| β | Segment horizontal angle (°) | Kalliokoski et al. 2010 | 32 (37) | 39 (46) | 31 (39) |
| γ | Segment length (m) | Kalliokoski et al. 2010 | 0.48 (0.549) | 0.518 (0.671) | 0.51 (0.658) |
| fsink | Probability of segment becoming a sinker root | Kalliokoski et al. 2010 | 0.13 | 0.13 | 0.13 |
How much of the parent segment’s cross sectional area is allocated to the largest of the child segments is called allocation factor q (Ozier-Lafontaine et al. 1999; Kalliokoski et al. 2010). In our root model, each node’s q-factor is dependent on the number of child segments produced at that node. On the other hand, our root model assumed that every node’s scaling factor p (the quota of cross-sectional area before branching versus the sum of cross-sectional areas after branching (Kalliokoski et al. 2010)) was 1, meaning that the total cross sectional area immediately before the node is always the same as after the node.
Even though the root segments’ initial horizontal angles are variable, all root segments were assumed to grow straight forwards from their node at that azimuth (horizontal angle), and that positive and negative angles (ie. branching to the left or right) were equally probable. Moreover, to simplify our model, secondary roots’ segments were considered to grow vertically at a constant angle without variation (however, as per Björkhem et al.’s (1975) findings, first-order segments/main lateral roots were assumed to grow at the soil surface). To further save on computing costs, root segment depth increases incrementally (Jundén 2011). There is also a possibility, fsink, that segments may become sinker roots (Kalliokoski et al. 2010). Sinker roots have vertical angles >45° and do not constitute obstacles for the planting heads; thus, these types of root segments essentially terminate at the previous node. For further details on our modelling of root depth, see Jundén (2011).
The taper factors, q-factors and sinker root probabilities are similar regardless of tree species while the other parameters are species-specific. Table A1 shows the values for the above-mentioned parameters. When relevant, Eq. A5 was used to calculate the normally distributed standard deviations (s) of variables for which Kalliokoski et al. (2010) provided the means (![]() ), sample standard errors of the mean (
), sample standard errors of the mean (![]() ) and sample size (N).
) and sample size (N).
![]()
