Perttu Anttila  ,
Vesa Nivala,
Olli Salminen,
Markus Hurskainen,
Janne Kärki,
Tomi J. Lindroos,
Antti Asikainen
,
Vesa Nivala,
Olli Salminen,
Markus Hurskainen,
Janne Kärki,
Tomi J. Lindroos,
Antti Asikainen
Regional balance of forest chip supply and demand in Finland in 2030
Anttila P., Nivala V., Salminen O., Hurskainen M., Kärki J., Lindroos T. J., Asikainen A. (2018). Regional balance of forest chip supply and demand in Finland in 2030. Silva Fennica vol. 52 no. 2 article id 9902. https://doi.org/10.14214/sf.9902
Highlights
- The impact of increasing forest chip demand in 2030 was analyzed in Finland
- Demand of small trees may exceed potential at the national level
- Surplus potential will remain in logging residues and stumps
- Hot spots of demand call for efficient logistical solutions.
Abstract
According to the National Energy and Climate Strategy of Finland in 2016, the demand for forest chips, that is, wood chips made of forest biomass directly for energy use, could even double by 2030 compared to the present situation. A spatially explicit impact analysis of regional supply and demand balances for forest chips was carried out. The balances were calculated as the difference between technical harvesting potentials and demand. First, the technical potentials were estimated based on the national forest inventory data. Secondly, three demand scenarios were defined for 2030 and subsequently deducted from the potentials. The results suggested that there would be increasing competition for feedstock in southern and western Finland, whereas in eastern and northern Finland there would still be surplus potential. Moreover, due to the remarkable deficit of small trees in southern Finland, there might be pressure towards using more pulpwood-sized and/or imported wood in energy production. The results also showed that, in particular, large new plants consuming substantial amounts of forest chips could have a significant effect on the regional availability of forest chips. Moreover, with increasing transport distances, new logistical solutions will be needed.
Keywords
bioenergy;
energy wood;
GIS;
availability;
potential
-
Anttila,
Natural Resources Institute Finland (Luke), Yliopistokatu 6, FI-80100 Joensuu, Finland
 http://orcid.org/0000-0002-6131-392X
E-mail
perttu.anttila@luke.fi
http://orcid.org/0000-0002-6131-392X
E-mail
perttu.anttila@luke.fi
- Nivala, Natural Resources Institute Finland (Luke), Eteläranta 55, FI-96300 Rovaniemi, Finland E-mail vesa.nivala@luke.fi
- Salminen, Natural Resources Institute Finland (Luke), Latokartanonkaari 9, FI-00790 Helsinki, Finland E-mail olli.salminen@luke.fi
- Hurskainen, VTT Technical Research Centre of Finland Ltd, Koivurannantie 1, FI-40400 Jyväskylä, Finland E-mail markus.hurskainen@vtt.fi
- Kärki, VTT Technical Research Centre of Finland Ltd, Koivurannantie 1, FI-40400 Jyväskylä, Finland E-mail janne.karki@vtt.fi
- Lindroos, VTT Technical Research Centre of Finland Ltd, Vuorimiehentie 3 (Espoo), P.O. Box 1000, FI-02044 VTT, Finland E-mail tomi.j.lindroos@vtt.fi
- Asikainen, Natural Resources Institute Finland (Luke), Yliopistokatu 6, FI-80100 Joensuu, Finland E-mail antti.asikainen@luke.fi
Received 6 November 2017 Accepted 24 April 2018 Published 2 May 2018
Views 101870
Available at https://doi.org/10.14214/sf.9902 | Download PDF

1 Introduction
The National Energy and Climate Strategy of Finland in 2016 outlines the actions that will enable Finland to attain the targets of the Government Programme and those of the EU to meet the challenging 80–95% reduction in greenhouse gas emissions by 2050 (Huttunen 2017). Finland has already achieved the 2020 renewable energy target, where wood-based fuels, such as bark, sawdust, black liquor, logging residues, and wood from early thinnings, have played a key role in replacing fossil fuels in the energy system. In 2015, a total of 26% of the net primary energy production was wood based and thus wood is already the most important fuel in the Finnish energy mix (Official Statistics of Finland 2016).
In addition to the industrial residues, the shift from fossil fuels to renewables also requires more biomass that can be sourced directly from the forest. According to the impact assessment for the Energy and Climate Strategy (Koljonen et al. 2017), the consumption of forest chips (i.e. wood chips made of forest biomass directly for energy use) could rise to 13–15 million solid cubic metres (Mm3). Since the year 2000, the use of forest chips has been increasing rapidly, and in 2015 their consumption in heating and combined heat and power (CHP) plants totalled 7.3 Mm3 (Official Statistics of Finland 2016). Besides the fact that forest chips are renewable, their utilization can have positive effects on, for example, the national balance of trade and rural employment. In order to ensure sustainable level of forest chip consumption, targets or scenarios in which it is increased should be contrasted with estimates of sustainable harvesting potential.
Geographical Information Systems (GISs) are a feasible tool for assessing the technical harvesting potentials of forest chips as both the amount of biomass and many of the constraints on harvesting are location specific. Indeed, several studies have utilized GIS in the estimation of potentials at national, regional, or plant level (see for example Nord-Larsen and Talbot 2004; Rørstad et al. 2010; Yoshioka et al. 2011; Bouchard et al. 2013; Fernandez-Lacruz et al. 2015; Castellano et al. 2009; Muinonen et al. 2013; Lundmark et al. 2015; Noon and Daly 1996).
In the framework of the above-mentioned studies, the utilization of forest chips for energy had not yet been initiated or non-overlapping supply regions for the individual plants were assumed. However, with increasing demand, competition between users starts to play a significant role. For example, Viana et al. (2010) noted that the procurement regions overlapped, which would in practice increase the assumed 35-km radius and thus the transport costs. Different approaches have been taken to consider competition in the assessment of supply potential. Harvesting potential can be allocated by minimizing transport costs (Nord-Larsen and Talbot 2004; Ranta 2005) or the demand can be totalled if the supply regions overlap (Goerndt et al. 2013; Sánchez-García et al. 2015; Nivala et al. 2016). Furthermore, regional balances of supply potential and demand can be gauged (Ranta 2005; Emer et al. 2011; Masera et al. 2006; Sánchez-García et al. 2015; Nivala et al. 2016; Ranta et al. 2012). The regional balance estimates are very advantageous in indicating the hot spots of supply and demand (Masera et al. 2006).
Nivala et al. (2016) assessed the regional balance of the technical potential and the demand according to the Finnish national target for 2020. What sets the method presented in their paper apart from the other studies is the level of details: in practice all plants using forest chips are included in the analysis. However, also several weaknesses can be identified. The potentials were estimated at regional or municipality level and further distributed evenly on forest land available for wood supply (FAWS). The small-tree potential was based on a set of national forest inventory (NFI) plots for which thinning was estimated to be possible. The downside of this approach was that the data described growing stock at the time of the inventory, as no growth was predicted for the trees. The targeted demand was first distributed to individual facilities and then to facilities’ supply regions, whose sizes were proportional to demand. The balances were then obtained by subtracting the supply regions from the polygons containing the potential data. Finally, supply regions containing negative values were “filled”; that is, the regions were extended as long as there were no negative values. Even though the assessment revealed hot spots in 2020, the extension of supply regions blurred them to some extent. Moreover, the vector-based method turned out to be computationally rather heavy and therefore calls for improvement.
The objectives of this study were 1) to assess regional balances of forest chips in 2015 and with respect to demand scenarios for 2030 as an impact analysis of the National Energy and Climate Strategy, and 2) to improve the methodology developed by Nivala et al. (2016). The balances for 2030 were calculated according to three demand scenarios. Furthermore, sensitivity analyses were performed to assess the effects of some of the assumptions made. The improvements to the methodology were as follows: a) the even spatial distribution of potential was changed to a biomass weighted distribution, b) the estimation method of small-tree potential was developed, c) the extension of negative supply regions was abandoned, and d) the approach was changed to a raster-based one.
2 Material and methods
2.1 Technical harvesting potential
In this study, the technical harvesting potential of forest chips was defined as the maximum potential procurement volume of chips available from the Finnish forests based on the prevailing guidelines for harvesting of energy wood (Koistinen et al. 2016). Technical potential was estimated for three assortments:
• Small-sized trees from early thinnings (hereafter, small trees)
• Crown biomass (i.e. branches and needles) and stemwood loss (i.e. defective wood, under-sized tops, and small-sized stems) from final fellings (hereafter, logging residues)
• Wood from stumps and roots from final fellings (hereafter, stumps).
Within each assortment, the results were classified according to tree species group as follows:
• Scots pine (Pinus sylvestris L.)
• Norway spruce (Picea abies [L.] H. Karst.)
• Broadleaved species.
The potentials were first calculated for fifteen NUTS 3 based Finnish regions portrayed in Fig. 1 and later distributed on a raster grid at 1 km × 1 km resolution as described below. The results are presented as average annual potentials in dry tonnes.
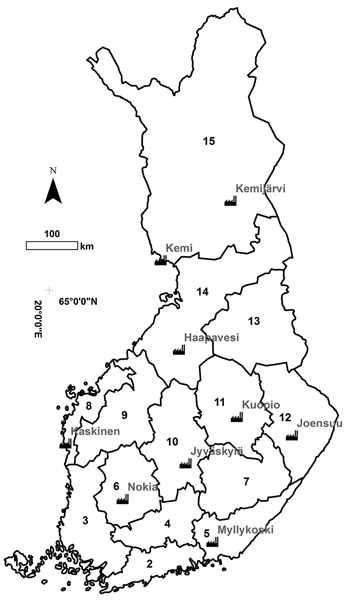
Fig. 1. The regional division in the study and the selected biorefinery locations. For the region names, see Table 3.
To begin with the estimation of the region-level potentials, technical harvesting potentials on FAWS were estimated using the sample plots of the eleventh national forest inventory (NFI11) measured in the years 2009–2013. First, a large number of sound and sustainable management schedules for five consecutive ten-year periods were simulated for each sample plot using a large-scale Finnish forest planning system known as MELA (Siitonen et al. 1996; Redsven et al. 2013). MELA simulations consisted of natural processes and human actions. The ingrowth, growth, and mortality of trees were predicted based on a set of distance-independent tree-level statistical models (Hynynen et al. 2002) included in MELA and the simulation of the stand (sample plot)-level management actions was based on the current Finnish silvicultural guidelines (Äijälä et al. 2014) and the guidelines for harvesting of energy wood (Koistinen et al. 2016).
Simulated management actions for the small-tree fraction consisted of thinnings that fulfilled the following stand criteria:
• mean diameter at breast height ≥ 8 cm
• number of stems ≥ 1500 ha–1
• mean height < 10.5 m (in Lapland) or mean height < 12.5 m (elsewhere).
Harvesting of energy wood was simulated as delimbed (i.e. including the stem only) in spruce-dominated stands and peatlands and as whole trees (i.e. including stem and branches) elsewhere. When harvested as whole trees, a total of 30% of the original crown biomass was left onsite (Koistinen et al. 2016). Energy wood thinnings could be integrated with roundwood logging or carried out independently.
Second, the technical energy wood potential of small trees (ST) was operationalized in MELA by maximizing the removal of thinnings in the first period. In this way, we were able to pick out all small tree fellings simulated in the first period despite, for example, the profitability of the operation. However, a single logging event was rejected if the energy wood removal was lower than 25 m³ ha–1 or the industrial roundwood removal of pine, spruce, or birch exceeded 45 m³ ha–1. The purpose of the latter constraint was to leave out stands targeted by forest industries. However, the ST calculated in this way contained some amount of timber suitable for industrial roundwood. Therefore, we also calculated a small tree estimate (ST10.5) that consisted only of the trees with diameters below 10.5 cm at breast height.
Third, the potentials for logging residues and stumps were calculated based on the final fellings. Final fellings consisted of clear cutting, seed tree cutting, and shelter-wood cutting, but only the clear-cutting areas were utilized for energy wood harvesting. As both logging residues and stumps are byproducts of roundwood removals, the technical potentials of chips have to be linked with removals of industrial roundwood. Future potentials were assumed to materialize when the industrial roundwood fellings followed the level of maximum sustainable removals.
The maximum sustainable removals were calculated in the linear programming module of MELA system such that the net present value (NPV) calculated with a 4% discount rate was maximized (Eq. 1) subject to non-declining periodic industrial roundwood (Eq. 2) and energy wood (Eq. 3) removals and net incomes (Eq. 4), and subject to the saw log removal remaining at least at the level of the first period (Eq. 5). For each stand (calculation unit) the optimisation chose the schedule that maximized the total NPV. There were no constraints concerning tree species selection, cutting methods, age classes, or the growth/drain ratio in order to efficiently utilize the dynamics of forest structure. The felling behaviour of the forest owners was not taken into account either. For the present situation in 2015, the removal of industrial roundwood was assumed to be the same as the average level in 2009–2013.
Sustainability constraints were for 50 years (five 10-year periods), but the NPV calculations were carried out beyond this period by continuing each schedule j without splitting until the management unit was regenerated or 150 years was reached whichever was shorter.

subject to
![]()
![]()
![]()
![]()

where xij is the area of management unit i (i = 1,…,m) managed according to management schedule j (j = 1,…h); ![]() is the amount of timber or energy wood assortment q (q = 1,…,k) produced if management schedule j is employed for the area of calculation unit i at period t (t = 1,…,T);
is the amount of timber or energy wood assortment q (q = 1,…,k) produced if management schedule j is employed for the area of calculation unit i at period t (t = 1,…,T);![]() is the amount of industrial roundwood (saw timber and pulpwood) harvested if management schedule j is employed for the area of calculation unit i at period t;
is the amount of industrial roundwood (saw timber and pulpwood) harvested if management schedule j is employed for the area of calculation unit i at period t; ![]() is the amount of energy wood harvested if management schedule j is employed for the calculation unit i at period t;
is the amount of energy wood harvested if management schedule j is employed for the calculation unit i at period t; ![]() is the amount of saw timber harvested if management schedule j is employed for the area of calculation unit i at period t; pq, cq are roundwood (as road-side) and energy wood (at mill yard) prices and corresponding costs of procurement by assortments q, (q = 1,…,k); SEVi is the estimate of the soil expectation value for management unit i calculated according to the Faustmann formula; and ai is the area of management unit i.
is the amount of saw timber harvested if management schedule j is employed for the area of calculation unit i at period t; pq, cq are roundwood (as road-side) and energy wood (at mill yard) prices and corresponding costs of procurement by assortments q, (q = 1,…,k); SEVi is the estimate of the soil expectation value for management unit i calculated according to the Faustmann formula; and ai is the area of management unit i.
Fourth, the technical harvesting potentials were derived by retention of 30% of the logging residues onsite (Koistinen et al. 2016) and respectively by retention of 16–18% of stump biomass (Muinonen et al. 2013; Anttila et al. 2013). The logging residue potential assuming maximum sustainable removals is later referred to as ResMax and the corresponding stump potential as StuMax. The potentials assuming the realized harvesting level are referred to as ResBAU and StuBAU, respectively.
Subsequently, the region-level potentials were spread on a raster grid at 1 km × 1 km resolution. Only grid cells on FAWS were considered in this operation. In this study, FAWS was defined as follows: First, forest land was extracted from the Finnish Multi-Source National Forest Inventory (MS-NFI) 2013 data (Mäkisara et al. 2016). Second, restricted areas were excluded from forest land. The restricted areas consisted of nationally protected areas (e.g. nature parks, national parks, protection programme areas) and areas protected by the State Forest Enterprise. In addition, some areas in northernmost Lapland restricted by separate agreements between the State Forest Enterprise and stakeholders were left out from the final data. Furthermore, for small trees, FAWS was further constrained by the stand criteria presented above to represent similar stand conditions for small-tree harvesting as in MELA.
Next, the region-level potentials were distributed to the grid cells by weighting with MS-NFI biomasses:

where
pi,sc,sp = potential in grid cell i, of scenario sc and species sp
sc ∈ {ST, ST10.5, ResBAU, ResMax, StuBAU, StuMax}
sp ∈ {pine, spruce, broadleaved}
Bi,c,sp = biomass in grid cell i, of component c and species sp
c ∈ {stem and bark | sc ∈ {ST, ST10.5}, living branches| sc ∈ {ResBAU, ResMax}, stump | sc ∈ {StuBAU, StuMax}}
n = number of grid cells within the region
Psc,sp = region-level potential of scenario sc and species sp
ST = technical potential of small trees
ST10.5 = technical potential potential of small trees with diameters below 10.5 cm at breast height
ResBAU = residue potential corresponding to realized harvesting level
StuBAU = stump potential corresponding to realized harvesting level
ResMax = residue potential corresponding to maximum sustainable removals
StuMax = stump potential corresponding to maximum sustainable removals.
2.2 Demand
Demand for forest chips in the heat and power sector and for liquid biofuel production was based on the actual consumption in 2015 and on three future scenarios of consumption in 2030 (Fig. 2). In 2015, a total of 7.3 Mm3 of forest chips, corresponding to 3.1 million dry tonnes (Mt), was used in heating and CHP plants in Finland (Official Statistics of Finland 2016). Of this, 52% originated from small trees, 37% from logging residues, and 11% from stumps. In practice, the small-tree fraction included an unknown amount of pulpwood.
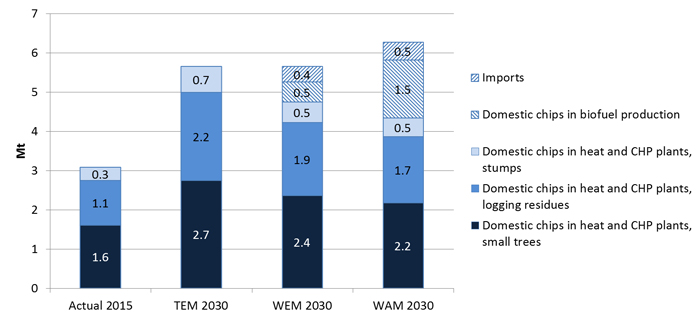
Fig. 2. The consumption of forest chips in heat and CHP plants realized in 2015 and in the demand scenarios for 2030 assessed in this study.
The scenarios for 2030 were obtained from two different sources. The first one was the impact assessment for the Energy and Climate Strategy (Koljonen et al. 2017). In the assessment, the development of the Finnish energy system following two scenarios was modelled using the TIMES-VTT integrated energy system model (Koljonen and Lehtilä 2012), which is based on the IEA-ETSAP TIMES energy system modelling framework and the global ETSAP-TIAM model (Loulou and Labriet 2008; Loulou et al. 2016). In the basic scenario, WEM (With Existing Measures), the national targets for energy and climate policy in 2020 will be met, but the policies or targets will not be tightened after this (Koljonen et al. 2017). Instead, in the so-called policy scenario WAM (With Additional Measures), the energy and climate policies and targets are stricter after 2020 to fulfil both proposed EU 2030 targets and additional national policy targets for 2030. The results from TIMES-VTT modelling specify the consumption of forest chips at the national level in heat and power production and in biofuel production and the amount of chips imported. In the scenario WEM, these values were 4.7, 0.5, and 0.4 Mt, and in the WAM scenario they were 4.3, 1.5, and 0.5 Mt, respectively.
The second source for the 2030 estimates was the Ministry of Economic Affairs and Employment, which provided an earlier scenario version in September 2016 (referred to hereafter as TEM). This scenario was added as an alternative, because it assumed no use of forest chips in biofuel production and 100% domestic feedstock. The total consumption of chips in heat and CHP plants was 5.7 Mt in this scenario.
Next, the national totals were divided into individual heat plants, CHP plants, and biomass-to-liquid plants (hereafter referred to as biorefineries). The following procedure was applied for the heat and CHP plants. For the scenario WEM, the plant-specific forest chip demands were determined by assuming first that the given national target will be met and then distributing the additional forest chip supply to the plants having the technological potential to increase the share of forest chips. Most of the additional potential was allocated to large-scale plants in which forest chips can substitute for peat up to a certain limit without any major operational risks.
The analysis was based on the heat and power plant databases of Natural Resources Institute Finland (Luke) and VTT Technical Research Centre of Finland Ltd (VTT). Luke’s database consisted of 1065 demand points of wood fuels with location and consumption data. Of these, 669 had used forest chips in 2015. VTT’s database, on the other hand, contained information on more than 1000 plants (e.g. plant type, capacity, commissioning year, annual production, and fuel use statistics). The remaining lifetimes of the plants or the uncertain future plant investments were not considered in this study. The plants currently under commissioning in Naantali and Lahti (Kymijärvi III) and Helen Ltd’s planned “Vuosaari bioheating plant” were, however, included in the analysis. This study thus assumed that the future plants will have demands for forest chips similar to those of the plants they will replace. The annual utilization hours for forest chips at the plants were then checked based on the plant-specific data and adjustments to the demands were made if necessary.
For the scenarios WAM and TEM, the each plant’s demand for forest chips was derived from the results of the scenario WEM. First, the plants were grouped into four main types: 1) municipal CHP, 2) industrial CHP, 3) municipal heat plant, and 4) industrial heat plant. Within a group, the changes in the use of forest chips were assumed to be similar, but between the groups the changes could diverge due to the different natures of the plants and their operations. Second, the changes in the use of forest chips in each group were adjusted to meet the targets of the scenarios WEM and TEM. For the scenario WAM (which had a lower national target in the heat and power sector than WEM), the use of biomass was assumed to decrease mostly in industrial CHPs, for example. This was due to the fact that the use of forest chips was assumed to increase quite significantly in industrial CHP plants in the scenario WEM compared to the current use. For the scenario TEM (which had a higher national target than WEM), the municipal CHP plants were deemed to have the most potential to further increase the use of forest chips compared to WEM. The increase did not yet lead to unrealistic shares of forest biomass in any of the plants. The use of imported forest chips was assumed to be concentrated in the large plants in the coastal area and in eastern Finland. Furthermore, the shares of the forest chip assortments were assumed to remain constant for individual plants. For the new installations, the shares were estimated either based on a priori information or as an average of existing plants of the same size.
At the moment, there are neither existing plants producing liquid transport biofuels from forest chips nor investment decisions to establish such plants in Finland. For this reason, a total of nine locations where such a biorefinery could operate were holistically determined based on infrastructure and forest resources (Fig. 1). In this study, the demand for domestic forest chips in the scenario WEM was distributed equally among the plants, resulting in the consumption of 0.06 Mt by each plant. In the scenario WAM, the emphasis of the study was on assessing how one large demand point would affect the regional balance. Therefore the consumption of all of the plants except one was kept constant and the remaining demand of 1.02 Mt was allocated to Kemi, where Kaidi, a Chinese company, is planning to build a biorefinery that will use forest chips. According to the company the estimated total wood demand of the plant would be 2.8 mill. m3 (c. 1.2 Mt) (Kaidi 2018). However, due to the location next to the Swedish border part of the demand would probably be fulfilled with imported energywood as well as with sawmill chips. Finally, it was presumed that the feedstock of the biorefineries would consist of small trees and logging residues with equal shares.
Finally the demand for forest chips was made spatially explicit by defining a procurement region for each plant and by distributing the plant’s demand in it (Nivala et al. 2016). For this purpose, the plants were categorized into five classes based on their demand (Table 1). For each demand class the maximum transport distance was determined using the results of an earlier survey (Kurki et al. 2012). Concentric supply circles were defined for the plants so that the higher the demand, the higher the number of circles and the larger the supply radius. Assuming that the facilities are trying to minimize transport costs, the intensity of demand decreased with increasing supply radius. For this, a share of 1/n, where n is the number of concentric circles, of the total demand of a plant was allocated to each supply region. A supply region is the supply circle, when the supply radius is 30 km, and the ring between consecutive supply circles, when the radius is higher than 30 km. Within each supply region the demand was further distributed to the grid cells by weighting with MS-NFI biomasses as the region-level potentials (Eq. 6).
| Table 1. Assumed supply radius of a plant as a function of demand (Kurki et al. 2012). | |
| Demand (kt) | Supply radius (km) |
| ≤ 1.3 | 30 |
| ≤ 4.2 | 60 |
| ≤ 33.6 | 100 |
| ≤ 73.5 | 150 |
| > 73.5 | 200 |
2.3 Balance
The forest chip balance of each assortment was calculated as the remainder of the above-described spatially-explicit potential supply and demand layers. Unlike in Nivala et al. (2016), negative balance values were also accepted. In addition to the balance calculations of the actual situation in 2015 and the three scenarios (TEM, WEM, and WAM), sensitivity analyses were performed to assess the effect of some assumptions made (Table 2). The effect of also including pulpwood-sized material in the small-tree feedstock was tested in the scenario WAM+. In the scenarios WAM_Res100 and WAM_ST100, the shares of residues and small trees in biorefinery feedstock were altered from the 50/50 ratio of the reference scenario WAM. As stumps are currently mainly harvested from spruce-dominated forests, the scenario WAM_NS shows the effect of excluding pine stumps from the potential.
| Table 2. The assumptions of the balance scenarios. Scenarios: “2015” – Actual demand of forest chips in 2015; “TEM” – estimate of demand in 2030 from the Ministry of Economic Affairs and Employment; “WEM” - estimate of demand in 2030 “With Existing Measures” from an impact analysis for the Finnish energy and climate strategy; “WAM” – estimate of demand in 2030 “With Additional Measures” from the impact analysis; “WAM+” – demand as in “WAM”, but potential of small trees higher; “WAM_Res100” – demand as in “WAM”, but only residues used in biorefining; “WAM_ST100” – demand as in “WAM”, but only small trees used in biorefining; “WAM_NS” – demand of stumps as in “WAM”, but only spruce stumps accepted. Potentials: “ST” – technical potential of small trees; “ST10.5” – technical potential of small trees with diameters below 10.5 cm at breast height; “ResBAU” – residue potential corresponding to realized harvesting level; “StuBAU” – stump potential corresponding to realized harvesting level; “ResMax” – residue potential corresponding to maximum sustainable removals; “StuMax” – stump potential corresponding to maximum sustainable removals. | |||
| Scenario | Biomass assortment(s) considered | Potential | Shares of small trees and residues of biorefinery feedstock |
| 2015 | all | ST10.5; ResBAU; StuBAU | N/A |
| TEM | all | ST10.5; ResMax; StuMax | N/A |
| WEM | all | ST10.5; ResMax; StuMax | 50%/50% |
| WAM | all | ST10.5; ResMax; StuMax | 50%/50% |
| WAM+ | small trees | ST | 50%/50% |
| WAM_Res100 | small trees, logging residues | ST10.5; ResMax | 0%/100% |
| WAM_ST100 | small trees, logging residues | ST10.5; ResMax | 100%/0% |
| WAM_NS | stumps | StuMax (spruce only) | N/A |
3 Results
3.1 Technical harvesting potential
The total annual technical harvesting potential of small trees (ST) in Finland was estimated at 2.8 Mt (Fig. 3). Nearly half of this amount was made up of broadleaved species, one third of pine, and the rest of spruce. When only trees with diameters below 10.5 cm at breast height were counted (ST10.5), the potential dropped to 1.6 Mt. The share of broadleaved species increased with decreasing diameter: these species comprised 56% of the potential. Altogether 33% of small tree potential was located on peatlands and 66% on mineral soils.
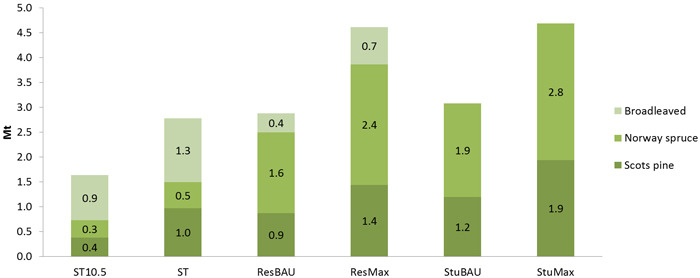
Fig. 3. Technical harvesting potential of forest chips in Finland.
The annual potential of logging residues (ResBAU) was 2.9 Mt and that of stumps (StuBAU) was 3.1 Mt when the removal of industrial roundwood was assumed to remain at the level of recent years (Fig. 3). Spruce was the dominant species for both the logging residue and the stump potentials, as the share of spruce was 60% for both assortments. If the removal of industrial roundwood were to rise at the maximum sustainable level, the potentials of logging residues (ResMax) and stumps (StuMax) would increase to 4.6 and 4.7 Mt, respectively. Only 15–17% of the potential lies on peatlands.
Regionally, the distribution of small tree potential differs from the distributions of logging residue and stump potentials (Fig. 4, Table 3). The high potential of small trees in Lapland is explained by the high share of young forests. On the other hand, the potential of logging residues and stumps is centred in southern and eastern Finland, where the biggest harvesting possibilities of spruce logs are located.
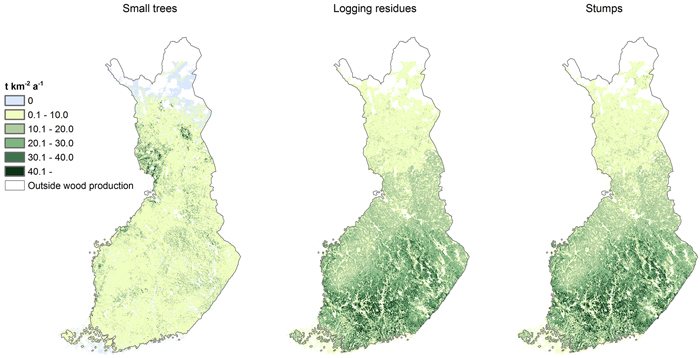
Fig. 4. Spatially explicit technical harvesting potentials of small trees (left), logging residues (centre), and stumps (right).
| Table 3. Technical harvesting potentials by region (1000 t). “ST” – technical potential of small trees; “ST10.5” – technical potential of small trees with diameters below 10.5 cm at breast height; “ResBAU” – residue potential corresponding to realized harvesting level; “StuBAU” – stump potential corresponding to realized harvesting level; “ResMax” – residue potential corresponding to maximum sustainable removals; “StuMax” – stump potential corresponding to maximum sustainable removals. | |||||||
| Region nr | Region | ST10.5 | ST | ResBAU | ResMax | StuBAU | StuMax |
| 1 | Åland | 3 | 6 | 16 | 24 | 18 | 24 |
| 2 | Uusimaa | 37 | 52 | 129 | 221 | 140 | 212 |
| 3 | Lounais-Suomi | 84 | 120 | 188 | 358 | 226 | 375 |
| 4 | Häme | 43 | 70 | 222 | 294 | 249 | 296 |
| 5 | Kaakkois-Suomi | 62 | 91 | 212 | 280 | 235 | 298 |
| 6 | Pirkanmaa | 68 | 104 | 198 | 323 | 220 | 331 |
| 7 | Etelä-Savo | 115 | 184 | 298 | 424 | 324 | 442 |
| 8 | Ostrobothnia | 55 | 86 | 64 | 144 | 69 | 141 |
| 9 | South and Central Ostrobothnia | 109 | 168 | 144 | 243 | 159 | 259 |
| 10 | Central Finland | 104 | 166 | 286 | 422 | 306 | 454 |
| 11 | Pohjois-Savo | 137 | 217 | 294 | 433 | 300 | 439 |
| 12 | North Karelia | 120 | 183 | 223 | 365 | 236 | 375 |
| 13 | Kainuu | 141 | 269 | 175 | 285 | 180 | 278 |
| 14 | North Ostrobothnia | 217 | 402 | 262 | 414 | 238 | 385 |
| 15 | Lapland | 343 | 658 | 163 | 382 | 176 | 381 |
| Total | 1638 | 2775 | 2874 | 4611 | 3077 | 4689 | |
3.2 Demand
Presently, the demand for forest chips is concentrated in the largest CHP plants in southern and central Finland and along the coastal areas. In the future, demand in these regions is expected to increase even more than elsewhere, as most of the additional use will take place in the large plants as well as in the new installations in the south (Fig. 5). Logging residues and stumps are mostly used in southern and central Finland, whereas the consumption of small trees is more evenly distributed.
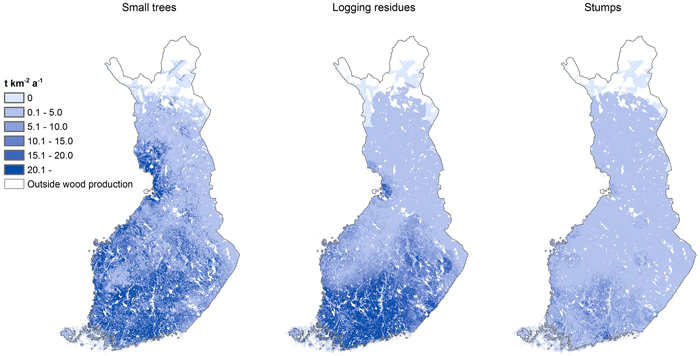
Fig. 5. Spatially explicit demand for small trees, logging residues, and stumps according to the scenario TEM in 2030.
3.3 Balance
The technical potential of small trees would barely satisfy the national demand for small trees in 2015 if pulpwood-sized material were excluded from the feedstock (Table 4). The regional balance was positive in the east and north. This can also be seen on the balance map (Fig. 6), where almost the whole of the southwestern part of the country is coloured blue and the eastern and northern parts are green. One can also distinguish some of the individual users as blue circles on the map.
| Table 4. Forest chip balance of small trees in the basic and sensitivity scenarios by region (1000 t). “2015” – Actual demand of forest chips in 2015; “TEM” – estimate of demand in 2030 from the Ministry of Economic Affairs and Employment; “WEM” – estimate of demand in 2030 “With Existing Measures” from an impact analysis for the Finnish energy and climate strategy; “WAM” – estimate of demand in 2030 “With Additional Measures” from the impact analysis; “WAM+” – demand as in “WAM”, but potential of small trees higher; “WAM_Res100” – demand as in “WAM”, but only residues used in biorefining; “WAM_ST100” – demand as in “WAM”, but only small trees used in biorefining. | ||||||||
| Region nr | Region | 2015 | TEM | WEM | WAM | WAM+ | WAM_Res100 | WAM_ST100 |
| 1 | Åland | -1 | -3 | -2 | -2 | 1 | -2 | -2 |
| 2 | Uusimaa | -85 | -188 | -147 | -136 | -113 | -132 | -141 |
| 3 | Lounais-Suomi | -56 | -245 | -202 | -179 | -132 | -168 | -191 |
| 4 | Häme | -70 | -153 | -134 | -119 | -100 | -110 | -128 |
| 5 | Kaakkois-Suomi | -7 | -60 | -53 | -45 | -13 | -31 | -59 |
| 6 | Pirkanmaa | -78 | -214 | -200 | -178 | -139 | -158 | -199 |
| 7 | Etelä-Savo | -24 | -95 | -81 | -68 | 0 | -48 | -87 |
| 8 | Ostrobothnia | -17 | -54 | -49 | -43 | -12 | -32 | -54 |
| 9 | South and Central Ostrobothnia | -37 | -124 | -111 | -99 | -32 | -80 | -118 |
| 10 | Central Finland | -60 | -146 | -139 | -119 | -56 | -95 | -142 |
| 11 | Pohjois-Savo | 31 | -27 | -36 | -25 | 57 | 3 | -53 |
| 12 | North Karelia | 51 | 12 | 4 | 11 | 78 | 33 | -10 |
| 13 | Kainuu | 100 | 70 | 78 | 58 | 185 | 84 | 32 |
| 14 | North Ostrobothnia | 74 | -36 | -23 | -144 | 49 | 27 | -316 |
| 15 | Lapland | 182 | 103 | 77 | -231 | 98 | 139 | -601 |
| Total | 1 | -1159 | -1019 | -1320 | -130 | -571 | -2069 | |
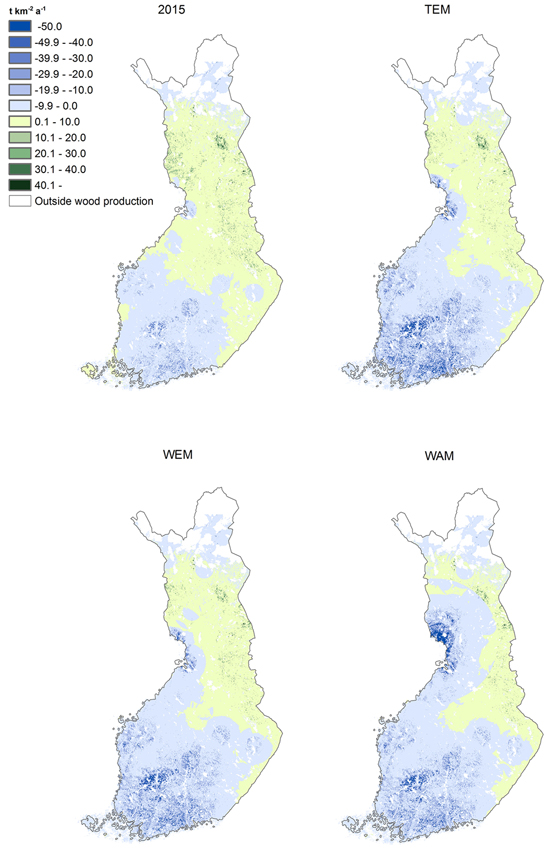
Fig. 6. Forest chip balance of small trees in 2015 and according to the scenarios TEM, WEM, and WAM.
In the future scenarios, the national balance of small trees was –1.2, –1.0, and –1.3 Mt in the scenarios TEM, WEM, and WAM, respectively (Table 4). At the regional level, the balance was positive only in North Karelia, Kainuu, and Lapland. However, in the scenario WAM, the balance of Lapland was also negative. The large demand of the biorefinery located in Kemi is clearly visible on the map (Fig. 6). The results of the sensitivity analysis show that the balance of small trees would be negative (–0.1 Mt) even if the whole potential were in use (WAM+ in Table 4). Furthermore, the assumption about the shares of residues and small trees in biorefinery feedstock has a radical effect: if all the feedstock consisted of logging residues, the balance would total –0.6 Mt. Instead, if the feedstock consisted of small trees only, the balance would be –2.1 Mt.
The balances of logging residues were all positive at the national level (Table 5). At the regional level, the balance was negative in Uusimaa in the scenario TEM but positive in all regions in the scenarios WEM and WAM. However, the sensitivity analysis indicates that the balance would be negative in North Ostrobothnia and Lapland should the feedstock of the biorefineries consist solely of logging residues (scenario WAM_Res100 in Table 5). The large demand points in southern Finland and on the northern coast of the Gulf of Bothnia are visible on the maps (Fig. 7). Especially in the scenario WAM, the biorefinery demand in Kemi, like the small tree balance, clearly stands out.
| Table 5. Forest chip balance of logging residues in the basic and sensitivity scenarios by region (1000 t). “2015” – Actual demand of forest chips in 2015; “TEM” – estimate of demand in 2030 from the Ministry of Economic Affairs and Employment; “WEM” – estimate of demand in 2030 “With Existing Measures” from an impact analysis for the Finnish energy and climate strategy; “WAM” – estimate of demand in 2030 “With Additional Measures” from the impact analysis; “WAM_Res100” – demand as in “WAM”, but only residues used in biorefining; “WAM_ST100” – demand as in “WAM”, but only small trees used in biorefining. | |||||||
| Region nr | Region | 2015 | TEM | WEM | WAM | WAM_Res100 | WAM_ST100 |
| 1 | Åland | 7 | 11 | 13 | 14 | 14 | 14 |
| 2 | Uusimaa | 15 | -34 | 14 | 26 | 21 | 31 |
| 3 | Lounais-Suomi | 61 | 50 | 95 | 115 | 105 | 126 |
| 4 | Häme | 87 | 36 | 63 | 82 | 70 | 94 |
| 5 | Kaakkois-Suomi | 115 | 101 | 112 | 127 | 113 | 142 |
| 6 | Pirkanmaa | 98 | 103 | 111 | 127 | 106 | 148 |
| 7 | Etelä-Savo | 180 | 209 | 230 | 250 | 231 | 268 |
| 8 | Ostrobothnia | 27 | 83 | 84 | 87 | 75 | 98 |
| 9 | South and Central Ostrobothnia | 86 | 154 | 157 | 163 | 148 | 178 |
| 10 | Central Finland | 174 | 230 | 233 | 252 | 228 | 277 |
| 11 | Pohjois-Savo | 205 | 273 | 270 | 281 | 252 | 310 |
| 12 | North Karelia | 168 | 261 | 266 | 274 | 254 | 294 |
| 13 | Kainuu | 158 | 242 | 248 | 227 | 201 | 252 |
| 14 | North Ostrobothnia | 211 | 301 | 284 | 95 | -139 | 329 |
| 15 | Lapland | 153 | 350 | 316 | 53 | -254 | 361 |
| Total | 1746 | 2371 | 2496 | 2173 | 1425 | 2921 | |
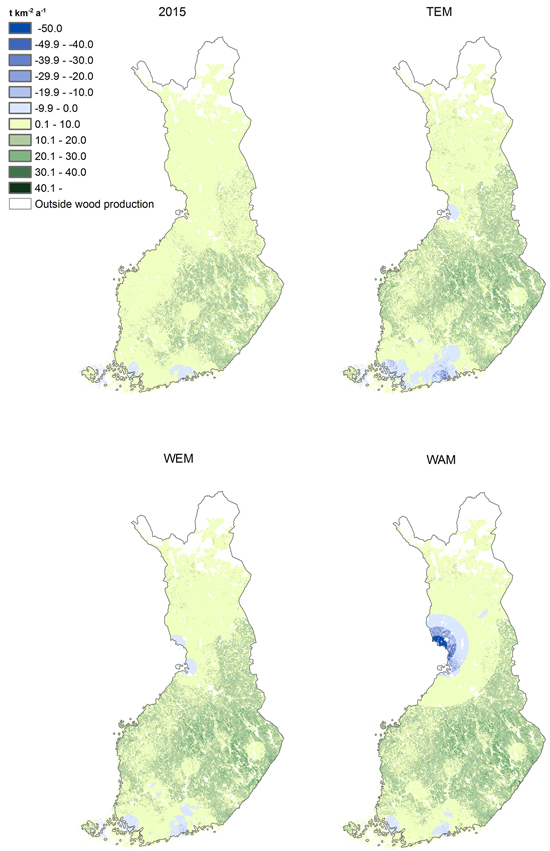
Fig. 7. Forest chip balance of logging residues in 2015 and according to the scenarios TEM, WEM, and WAM.
The technical potential of stumps is noticeably higher than the demand in all the scenarios at both national and regional levels (Table 6). Even if only spruce stumps were included in the potential, the balance would be positive by 2.3 Mt (scenario WAM_NS). Due to the small demand in comparison to the potential, some of the demand points can only just be discerned on the maps (Fig. 8).
| Table 6. Forest chip balance of stumps in the basic and sensitivity scenarios by region (1000 t). “2015” – Actual demand of forest chips in 2015; “TEM” – estimate of demand in 2030 from the Ministry of Economic Affairs and Employment; “WEM” - estimate of demand in 2030 “With Existing Measures” from an impact analysis for the Finnish energy and climate strategy; “WAM” – estimate of demand in 2030 “With Additional Measures” from the impact analysis; “WAM_NS” – demand of stumps as in “WAM”, but only spruce stumps accepted. | ||||||
| Region nr | Region | 2015 | TEM | WEM | WAM | WAM_NS |
| 1 | Åland | 17 | 22 | 22 | 23 | 10 |
| 2 | Uusimaa | 120 | 157 | 176 | 179 | 126 |
| 3 | Lounais-Suomi | 191 | 291 | 314 | 319 | 185 |
| 4 | Häme | 209 | 235 | 248 | 252 | 197 |
| 5 | Kaakkois-Suomi | 200 | 248 | 257 | 262 | 163 |
| 6 | Pirkanmaa | 181 | 265 | 277 | 280 | 191 |
| 7 | Etelä-Savo | 286 | 395 | 404 | 411 | 265 |
| 8 | Ostrobothnia | 47 | 111 | 117 | 119 | 68 |
| 9 | South and Central Ostrobothnia | 122 | 210 | 218 | 223 | 83 |
| 10 | Central Finland | 265 | 387 | 398 | 407 | 250 |
| 11 | Pohjois-Savo | 271 | 403 | 412 | 414 | 292 |
| 12 | North Karelia | 218 | 345 | 350 | 352 | 178 |
| 13 | Kainuu | 159 | 252 | 256 | 255 | 80 |
| 14 | North Ostrobothnia | 207 | 345 | 351 | 355 | 112 |
| 15 | Lapland | 159 | 358 | 360 | 361 | 92 |
| Total | 2653 | 4023 | 4160 | 4213 | 2291 | |
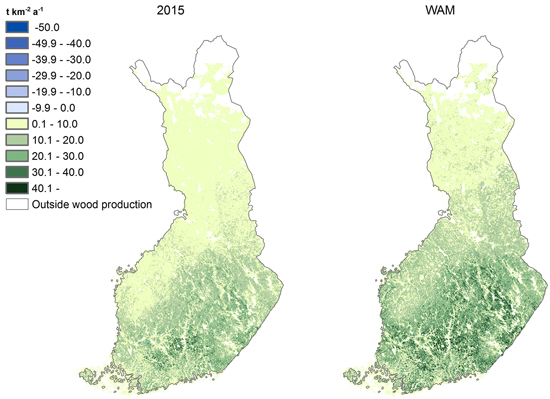
Fig. 8. Forest chip balance of stumps in 2015 and according to the scenario WAM. The maps of the scenarios TEM and WEM do not noticeably differ from the one of the scenario WAM and are, thus, not shown.
4 Discussion
In the scenarios for 2030, the level of removal of industrial roundwood was assumed to be at the maximum sustainable level (78 Mm3 a–1). If the removal stays at a lower level, the potential of logging residues and stumps will also be lower. Furthermore, technical potentials should not be taken as availabilities, because eventually the markets will determine the supplied amounts, which essentially depend on the forest owners’ willingness to sell and energy producers’ capability to pay for wood. A recent survey looked at the attitudes of forest owners. According to Rämö et al. (2016), 50% of the forest owners had sold energy wood, while a total of 8% would not sell it under any condition. Price was seen as the most significant factor explaining willingness to sell. On the demand side, the capability of energy producers to pay for wood basically depends on the prices of forest chips and competing fuels at the plant gate after taxes and incentives. Essentially, the technical potentials indicate only the upper limit of supply from domestic forests.
In the demand analysis for the heating and CHP plants, the side streams from the forest industry (sawdust, bark, etc.) were included in the analysis and no major changes in the availability of these streams were assumed in the 2030 scenarios. In addition, the remaining lifetimes of the plants and uncertain future plant investments were mostly not considered in this study. It was assumed that the future plants will have forest chip demands comparable to the plants they will replace. This was seen justified, because even though the new multi-fuel boilers would almost certainly be designed to use higher shares of woody biomass fuels than the existing ones, the existing CHP boilers could more and more often be replaced by boilers that will produce only heat. The replacement of a CHP plant with a heating plant would negate the additional biomass demand because heating plants will require less fuel to meet the same heat demand. Due to the low electricity prices in the Nordic electricity market, the trend of CHP plants being replaced with heating plants can already be seen in Finland.
If the demand for small trees rises to the level anticipated in this study, the deficit will be largely replaced by pulpwood and/or imported wood. In practise this happens already now, because part of the consumption of small trees reported by the plants in fact fulfils pulpwood dimensions. In addition, some transition between the assortments can be expected within the technical limits of the boilers, because the presumed future shares of forest chip assortments were chiefly based on the historical shares.
The assumption about procurement areas is based on an earlier survey (Kurki et al. 2012), and based on practical experiences it reflects the procurement of forest chips with current logistical alternatives well. If new logistical setups (e.g. large-scale utilization of terminals) emerge, they should be taken into account in future assessments.
Finally, there are significant uncertainties regarding biorefineries: So far, no investment decisions have been made concerning biorefineries using forest chips. Therefore, their locations, number, demand for forest chips, and shares of assortments can only be assumed.
5 Conclusions
In this study a GIS-based method to assess the regional sufficiency of forest chips was implemented. When adequate data are available, various scenarios of future consumption can be compared and regional hot spots of supply and demand can be detected. The improvements made in the methodology compared with Nivala et al. (2016) enable the provision of more accurate and visually appealing results as well as faster computation. Nonetheless, the method is based on several static assumptions about the future removal level of industrial roundwood, demand for forest chips, procurement areas, and operating environment in general. This weakness can be partly overcome by assessing a number of different scenarios and carrying out sensitivity analyses.
According to the results, the regional competition situation of different forest chip assortments in 2030 seems to be quite similar regardless of the scenario. A surplus potential of small trees remains in eastern and northern Finland after deducting presumed consumption. Moreover, due to the remarkable deficit of small trees in southern Finland, there might be pressure towards the use of more pulpwood-sized and/or imported wood in energy production. If the removal of industrial roundwood rises at the maximum sustainable level, there will be surplus potential of logging residues and stumps in almost the whole country, but it will be focused more in central–eastern Finland.
The results also show that, in particular, large new plants consuming substantial amounts of forest chips could have a significant effect on the regional sufficiency of forest chips. For this reason, this kind of balance assessment is of utmost importance for any planned large biorefinery, heat plant, or CHP plant. With the aid of these results, it is straightforward to estimate the technical and “free” potential as a function of transport distance for any location. The next, logical step of a feasibility study would entail a comparison of supply chains and compilation of cost-supply curves.
Regarding future development, there is a need to find new logistical solutions to supply forest chips. As much as one third of the small tree potential is located on peatlands, where harvesting will be more and more difficult with shortening of the frost season. Furthermore, as the demand will mostly grow far from the harvesting potential, long-distance transport of energy wood also calls for cost-effective solutions.
Acknowledgements
This work was financially supported by the Academy of Finland under the Climate-Neutral and Resource-Scarce Finland – Strategic Research Programme in 2015–2020 (Project FORBIO, No. 14970) and the Government’s analysis, assessment, and research activities (Project KEIJU). Dr Juha Laitila helped define the calculation parameters and Dr Ari Lauren offered valuable comments on the manuscript. The authors wish to thank the above-mentioned.
References
Äijälä O., Koistinen A., Sved J., Vanhatalo K., Väisänen P. (eds.) (2014). Metsänhoidon suositukset. [Guidelines for sustainable forest management]. Metsätalouden kehittämiskeskus Tapion julkaisuja. ISBN 978-952-6612-32-4. 181 p.
Anttila P., Muinonen E., Laitila J. (2013). Nostoalueen kannoista jää viidennes maahan. [One fifth of the stumps on a stump harvesting area stays in the ground]. BioEnergia 3: 10–11.
Bouchard S., Landry M., Gagnon Y. (2013). Methodology for the large scale assessment of the technical power potential of forest biomass: application to the province of New Brunswick, Canada. Biomass & Bioenergy 54: 1–17. https://doi.org/10.1016/j.biombioe.2013.03.014.
Castellano P.J., Volk T.A., Herrington L.P. (2009). Estimates of technically available woody biomass feedstock from natural forests and willow biomass crops for two locations in New York State. Biomass and Bioenergy 33(3): 393–406. https://doi.org/10.1016/j.biombioe.2008.08.001.
Emer B., Grigolato S., Lubello D., Cavalli R. (2011). Comparison of biomass feedstock supply and demand in Northeast Italy. Biomass and Bioenergy 35(8): 3309–3317. https://doi.org/10.1016/j.biombioe.2010.09.005.
Fernandez-Lacruz R., Di Fulvio F., Athanassiadis D., Bergström D., Nordfjell T. (2015). Distribution, characteristics and potential of biomass-dense thinning forests in Sweden. Silva Fennica 49(5) article 1377. https://doi.org/10.14214/sf.1377.
Goerndt M.E., Aguilar F.X., Skog K. (2013). Resource potential for renewable energy generation from co-firing of woody biomass with coal in the Northern U.S. Biomass and Bioenergy 59: 348–361. https://doi.org/10.1016/j.biombioe.2013.08.032.
Huttunen R. (2017). Government report on the National Energy and Climate Strategy for 2030 (unofficial translation). Ministry of Economic Affairs and Employment. 121 p. http://urn.fi/URN:ISBN:978-952-327-199-9.
Hynynen J., Ojansuu R., Hökkä H., Siipilehto J., Salminen H., Haapala P. (2002). Models for predicting stand development in MELA System. The Finnish Forest Research Institute Research Papers 835. 116 p. http://urn.fi/URN:ISBN:951-40-1815-X.
Kaidi (2018). Biorefinery in Kemi. http://www.kaidi.fi. [Cited 11 April 2018].
Koistinen A., Luiro J., Vanhatalo K. (2016). Metsänhoidon suositukset energiapuun korjuuseen, työopas. [Guidelines for sustainable harvesting of energy wood]. Metsäkustannus Oy, Helsinki. ISBN 978-952-5632-35-4. 74 p.
Koljonen T., Lehtilä A. (2012). The impact of residential, commercial, and transport energy demand uncertainties in Asia on climate change mitigation. Energy Economics 34(Supplement 3): S410-S420. https://doi.org/10.1016/j.eneco.2012.05.003.
Koljonen T., Soimakallio S., Asikainen A., Lanki T., Anttila P., Hildén M., Honkatukia J., Karvosenoja N., Lehtilä A., Lehtonen H., Lindroos T.J., Regina K., Salminen O., Savolahti M., Siljander R. (2017). Energia ja ilmastostrategian vaikutusarviot: yhteenvetoraportti. [Impact assessments of the Energy and Climate strategy: the summary report]. Publications of the Government´s analysis, assessment and research activities 21/2017. 106 p.
Kurki P., Mutanen A., Anttila P. (2012). Energiapuumarkkinat – käytännön kokemukset ja tilastointimahdollisuudet. [Energy wood markets – practical experiences and possibities of compilation of statistics]. Working Papers of the Finnish Forest Research Institute 228. 64 p. http://urn.fi/URN:ISBN:978-951-40-2358-3.
Loulou R., Labriet M. (2008). ETSAP-TIAM: the TIMES integrated assessment model Part I: model structure. Computational Management Science 5(1–2): 7–40. https://doi.org/10.1007/s10287-007-0046-z.
Loulou R., Remme U., Kanudia A., Lehtilä A., Goldstein G. (2016). Documentation for the TIMES Model. Energy Technology Systems Analysis Programme (ETSAP). http://iea-etsap.org/index.php/documentation. [Cited 16 March 2017].
Lundmark R., Athanassiadis D., Wetterlund E. (2015). Supply assessment of forest biomass – a bottom-up approach for Sweden. Biomass and Bioenergy 75: 213–226. https://doi.org/10.1016/j.biombioe.2015.02.022.
Mäkisara K., Katila M., Peräsaari J., Tomppo E. (2016). The Multi-Source National Forest Inventory of Finland – methods and results 2013. Natural resources and bioeconomy studies 10/2016. 215 p. http://urn.fi/URN:ISBN:978-952-326-186-0.
Masera O., Ghilardi A., Drigo R., Angel Trossero M. (2006). WISDOM: A GIS-based supply demand mapping tool for woodfuel management. Biomass and Bioenergy 30(7): 618–637. https://doi.org/10.1016/j.biombioe.2006.01.006.
Muinonen E., Anttila P., Heinonen J., Mustonen J. (2013). Estimating the bioenergy potential of forest chips from final fellings in Central Finland based on biomass maps and spatially explicit constraints. Silva Fennica 47(4) article 1022. https://doi.org/10.14214/sf.1022.
Nivala M., Anttila P., Laitila J., Salminen O., Flyktman M. (2016). A GIS-based methodology to estimate the regional balance of potential and demand of forest chips. Journal of Geographic Information System 8(5): 633–662. https://doi.org/10.4236/jgis.2016.85052.
Noon C.E., Daly M.J. (1996). GIS-based biomass resource assessment with BRAVO. Biomass and Bioenergy 10(2–3): 101–109. https://doi.org/10.1016/0961-9534(95)00065-8.
Nord-Larsen T., Talbot B. (2004). Assessment of forest-fuel resources in Denmark: technical and economic availability. Biomass and Bioenergy 27(2): 97–109. https://doi.org/10.1016/j.biombioe.2004.01.007.
Official Statistics of Finland (2016). Wood in energy generation 2015. http://stat.luke.fi/en/wood-energy-generation. [Cited 16 March 2017].
Rämö A., Hietala J., Haltia E., Horne P., Kniivilä M. (2016). Maaseutu Suomen biotalousstrategian tukipilarina – raaka-aineiden tarjonnan edistäminen metsissä. [Rural areas as a mainstay in Finnish bioeconomy strategy – boosting raw wood supply in private forests]. PTT reports 253. ISBN 978-952-224-182-5 (pdf). 93 p.
Ranta T. (2005). Logging residues from regeneration fellings for biofuel production – a GIS-based availability analysis in Finland. Biomass and Bioenergy 28(2): 171–182. https://doi.org/10.1016/j.biombioe.2004.08.010.
Ranta T., Korpinen O., Jäppinen E., Karttunen K. (2012). Forest biomass availability analysis and large-scale supply options. Open Journal of Forestry 2(1): 33–40. https://doi.org/10.4236/ojf.2012.21005.
Redsven V., Hirvelä H., Härkönen K., Salminen O., Siitonen M. (2013). MELA2012 reference manual. Finnish Forest Research Institute. 666 p. http://urn.fi/URN:ISBN:978-951-40-2394-1.
Rørstad .P, Trømborg E., Bergseng E., Solberg B. (2010). Combining GIS and forest modelling in estimating regional supply of harvest residues in Norway. Silva Fennica 44(3): 435–451. https://doi.org/10.14214/sf.141.
Sánchez-García S., Canga E., Tolosana E., Majada J. (2015). A spatial analysis of woodfuel based on WISDOM GIS methodology: multiscale approach in Northern Spain. Applied Energy 144: 193–203. https://doi.org/10.1016/j.apenergy.2015.01.099.
Siitonen M., Härkönen K., Hirvelä H., Jämsä J., Kilpeläinen H., Salminen O., Teuri M. (1996). MELA handbook. The Finnish Forest Research Institute Research Papers 622. ISBN 951-40-1543-6. 452 p.
Viana H., Cohen W.B., Lopes D., Aranha J. (2010). Assessment of forest biomass for use as energy. GIS-based analysis of geographical availability and locations of wood-fired power plants in Portugal. Applied Energy 87(8): 2551–2560. https://doi.org/10.1016/j.apenergy.2010.02.007.
Yoshioka T., Sakurai R., Aruga K., Sakai H., Kobayashi H., Inoue K. (2011). A GIS-based analysis on the relationship between the annual available amount and the procurement cost of forest biomass in a mountainous region in Japan. Biomass and Bioenergy 35(11): 4530–4537. https://doi.org/10.1016/j.biombioe.2011.03.029.
Total of 33 references.
