Eva Dařenová  ,
Richard A. Crabbe,
Robert Knott,
Barbora Uherková,
Jan Kadavý
,
Richard A. Crabbe,
Robert Knott,
Barbora Uherková,
Jan Kadavý
Effect of coppicing, thinning and throughfall reduction on soil water content and soil CO2 efflux in a sessile oak forest
Dařenová E., Crabbe R. A., Knott R., Uherková B., Kadavý J. (2018). Effect of coppicing, thinning and throughfall reduction on soil water content and soil CO2 efflux in a sessile oak forest. Silva Fennica vol. 52 no. 2 article id 9927. https://doi.org/10.14214/sf.9927
Highlights
- The coppice stand reached similar soil CO2 efflux rates eight years after harvest as the original stand
- Thinning increased SWC but did not affect soil CO2 efflux
- 30% throughfall reduction decreased soil CO2 efflux by 50.7%.
Abstract
In this study we determined the effect of transformation of a mature sessile oak forest stand into a coppiced forest, and of thinning and throughfall reduction in a coppice stand on soil water content (SWC) and soil CO2 efflux. The precipitation reduction was induced by installing parallel drainage channels in both unthinned and thinned coppice stands. The driving factor for temporal dynamics of soil CO2 efflux in all plots was soil temperature. The other factor was soil water content but only up to about 15%. Above this threshold, there was no more effect on CO2 efflux. We found no clear difference in SWC or soil CO2 efflux between the mature and coppiced stand eight years after harvesting. On the other hand, thinning of the coppice stand resulted in increase in SWC up to 22% in proportion, which we assume to be a result of increased gap fraction of the canopy. However, no effect on soil CO2 efflux was observed two years after the thinning. Installation of the drainage channels in two plots covering 30% of the ground area resulted in decrease in SWC up to a proportional 30.5% and thus contributed up to 50.7% reduction in soil CO2 efflux.
Keywords
soil respiration;
coppice;
precipitation;
soil moisture;
Quercus petraea
-
Dařenová,
Global Change Research Institute CAS, v.v.i., Belidla 4a, 603 00 Brno, Czech Republic
E-mail
darenova.e@czechglobe.cz
- Crabbe, Global Change Research Institute CAS, v.v.i., Belidla 4a, 603 00 Brno, Czech Republic E-mail crabbe.r@czechglobe.cz
- Knott, Mendel University in Brno, Zemedelska 3, 613 00 Brno, Czech Republic E-mail robert.knott@mendelu.cz
- Uherková, Mendel University in Brno, Zemedelska 3, 613 00 Brno, Czech Republic E-mail xfedorov@node.mendelu.cz
- Kadavý, Mendel University in Brno, Zemedelska 3, 613 00 Brno, Czech Republic E-mail jan.kadavy@mendelu.cz
Received 1 December 2017 Accepted 4 May 2018 Published 7 May 2018
Views 141443
Available at https://doi.org/10.14214/sf.9927 | Download PDF

1 Introduction
Coppicing used to be a common practice in European forestry because of its low cost demand and high production of firewood in a short rotation period. It utilizes the advantages of vegetative propagation and rapid regeneration of broadleaf tree species, when shoots emerge from stumps or roots shortly after the main tree stem has been cut (Evans 1992). The harvest is usually repeated after a defined period of time, depending on tree species and site conditions.
In the 20th century, socio-economic factors (such as high quality wood demand or lower necessity of firewood) resulted in a decline in maintenance of coppice forests, and they were thus abandoned or converted to high forest (Mairota et al. 2016). However, some countries in the Mediterranean region of Europe (e.g. Italy, Albania, France, Greece, Macedonia, Portugal), still widely practice coppicing because of their extreme site conditions (UN/ECE-FAO 2000). This is mainly due to preservation of root system from the previous generation, which is important for the water supply of the sprouts in early stages and prevent soil erosion, which enable sprout fast growth. This represents a huge advantage compared to the seeded trees under the extreme conditions (Herrero et al. 2014). In recent years, interest in coppice forest management across some European countries has increased (Nielsen and Moller 2000) and it has been also indicated the possibility of reintroducing such forest practice for both ecological and economic purposes: as part of nature conservation, where the natural regeneration is compromised by environmental conditions and as a source of sustainable energy (Merckx et al. 2012) for countries with limited forest resources.
Conversion of a high forest to coppice inevitably removes the aboveground parts of trees, which has a great impact on carbon balance of the ecosystem (Aguilos et al. 2014). Especially the effect of coppicing on soil processes has been studied and discussed (Londo et al. 1999; Tedeschi et al. 2006) given that these processes are complicated and “hidden from human sight”. Removing the tree biomass, generally, results in huge release in CO2 originated from decomposition of organic matter that has accumulated in the soil for years before the disturbance (Nakane and Lee 1995; Paul-Limoges 2015; Kischuk et al. 2016; Mayer et al. 2017). CO2 efflux from the soil declines subsequently with fast growing coppice sprouts and recovering carbon balance of the stand (Tedeshi et al. 2006), but the recovery can be affected by other disturbances and practices, such as another harvest after a selected rotation period or thinning. The rotation length and intensity of thinning and selection of sprouts during one rotation depend on the purpose of the stand. While demand of firewood is usually fulfilled by short rotation with minimum thinning, the production of higher quality wood requires longer rotation periods with more intensive thinning (Kadavý et al. 2011b).
Soil respiration is the largest source of forest ecosystem CO2 release into the atmosphere, where it represents 45–90% of total ecosystem respiration (Bolstad et al. 2004; Guan et al. 2006; Wu et al. 2013; Oikawa et al. 2017; Brændholt et al. 2018). Soil respiration results from the autotrophic component, which includes respiration of roots, symbiotic microbes and mycorrhizae, and the heterotrophic component, including respiration of microbes, decomposing plant litter, soil organic matter, and the priming effect (Kuzyakov 2006). Autotrophic respiration in oak forests may contribute to total soil respiration by 30% to 70% (Borken et al. 2006; Luan et al. 2011). Soil respiration is commonly measured as CO2 efflux from the soil surface (RS). RS varies mainly in dependence on temperature, soil water content (Inclan et al. 2010) and substrate supply (Wang et al. 2003). The substrate dynamics is driven by fresh photosynthetic substrates transported from leaves to rhizosphere and by plant litter input (Kuzyakov and Chen 2001; Han et al. 2015). As soil respiration usually represents over 50% of ecosystem respiration and is sensitive to any disturbances, forest management practices or climate change (like e.g. changes in precipitation pattern) can influence whether the forest would act as a CO2 sinks or source (Lindner et al. 2004).
The aims of the study were i) to determine difference in soil water content and soil CO2 efflux between a mature forest stand and a coppice stand eight years after harvesting of this original mature forest; ii) to determine the effect of the thinning of the coppice stand on soil water content and soil CO2 efflux; and iii) to determine the effect of reduction of throughfall on soil water content and soil CO2 efflux in both coppice forest and thinned-coppice forest.
2 Material and methods
2.1 The study site
The study site is located at the Training Forest Enterprise Masaryk Forest Krtiny, Bilovice forest district, in the southeastern part of the Czech Republic (49°25´N, 16°68´E). It is situated in the altitude 323 m a.s.l. on a western slope with 5–10° inclination. The site is characterized by mean annual temperature of 7.5 °C and mean annual precipitation of 550–650 mm. The soil is classified as Cambisol on the granodiorite bedrock of granodiorite with admixture of devonian and quaternary sediments in upper part of solum.
The experimental site is situated in a mature (45 years old) forest stand dominated by sessile oak (Quercus petraea [Matt.] Liebl.). In 2008, a coppice stand was established within this forest by the clear-cut on the area of 40 × 125 meters following the methodology of Kadavy et al. (2011a). The main species in the coppiced stand are sessile oak, European hornbeam (Carpinus betulus L.) and silver birch (Betula pendula Roth).
2.2 Experimental design
Within the coppiced area, four rectangular plots 14 × 9.5 m were established. Two of them were thinned in the winter 2014/2015. Thinning was done with a hand saw at the ground level. Basal area of each polycormon was reduced to 50% by leaving 1–3 dominant sprouts per stump for sessile oaks and 1–5 dominant sprouts per stump for European hornbeam polycormons.
On two plots (one unthinned and one thinned), parallel drainage channels were installed about 50 cm above the ground to reduce the throughfall. The drainage channels were made of wood with the surface covered by plastic strips and had a V-shape of a width of 20 cm. They covered 30% of the plot surface and they drained the rain water outside the coppiced area.
In summary, five plots with different treatment were studied: M-mature stand, CU-unthinned coppice stand, CT-thinned coppice stand, CUR-unthinned coppice stand with reduced throughfall, and CTR-thinned coppice stand with reduced throughfall.
2.3 Soil CO2 efflux
In each plot, three subplots were randomly established. In M, CU and CT each subplot contained three positions in a triangle with the sides about two meters. In CUR and CTR there were three positions under and two positions between the drainage channels. Therefore, there were nine or fifteen positions per plot, which is 57 positions in total.
Measurements of soil CO2 efflux were performed on monthly basis during two growing seasons – from June 2015 to September 2016. One week prior to the first measurement, PVC collars, 20 cm in diameter and 15 cm in height, were inserted about 3 cm deep into the soil on each position. Measurements were performed using a Li-8100 portable system (Li-Cor, Lincoln, NE, USA) with a 20 cm survey chamber. After the chamber closed, a period (dead band) of 15 s was set to allow steady mixing of the air in the chamber. During the following 60 s, CO2 concentration was measured repeatedly at 1s intervals and a linear approach was used to calculate soil CO2 efflux.
2.4 Micrometeorological measurements
Precipitation was measured by an automatic climate station (EMS Brno, CZ) in one hour intervals. During each measurement of soil CO2 efflux, soil temperature at 1.5 cm (TPD32 penetrate thermometer, Omega, Stamford, CT, USA) and soil water content in the 0–6 cm profile (ThetaProbe ML2x, Delta-T Devices, Cambridge, UK) were measured at the distance of 5 cm outside the collar at three points for each CO2 efflux measurement position.
2.5 Hemispherical photographs
Hemispherical photographs were taken in the middle of growing season at a height of 0.1 m above the ground at all points where soil respiration was measured. We used a Canon EOS 60D camera (Canon Inc., JAP) with Sigma (4.5 mm) fisheye lens (Sigma, JAP) arranged horizontally with the aid of a spirit level and oriented toward magnetic north using a compass. The aperture width and shutter speed were adjusted automatically. Photographs were taken under completely overcast sky conditions to avoid the occurrence of bright regions around sun and light reflections of foliage.
All photographs were analyzed with WinScanopy software (version Pro 2012, Regent Instruments Inc., CAN). We used pixel classification into canopy and sky (thresholding) based on colors. A standard overcast sky (SOC) model was selected to describe the light intensity of the diffuse light sky. To characterize light conditions above collars, gap fraction and leaf area index (LAI) for the zenith angle of 30° were determined. The mean values for each plot were calculated by the same procedure as for other parameters as described below.
2.6 Data analysis
Mean soil CO2 efflux (RS), soil water content (SWC), soil temperature (TS), and SD were calculated for M, CU and CT from three mean values of the subplots. In CUR and CTR, the means of each subplot were calculated proportionally: 37.5% of the mean value from positions under the drainage channels (that corresponds to 30% area covered by the drainage channels, plus we extended the width along the edges of the drainage channels by 3 cm to ensure a complete coverage over collars) and 62.5% of the mean value from the positions situated between the drainage channels.
Exponential function was applied separately for each plot to determine relationship between mean Rs and mean Ts calculated for each campaign:
![]()
with α and β as the regression coefficients. Data from campaigns when soil water content was 10% or less were excluded from the analysis as the effect of temperature on soil CO2 efflux was weakened by the lack of water. The proportional change in CO2 efflux in relation to a 10 °C increase in temperature, known as Q10, was calculated according to Lloyd & Taylor (1994):
![]()
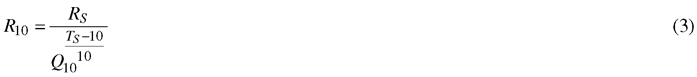
with α being the regression coefficient from Eq. 1. Mean Q10 was calculated for each plot. Soil CO2 efflux for each position was normalized for the temperature 10 °C (R10) according to the following equation:
For the normalization of soil CO2 efflux on dates with low soil water content, Q10 was set at 1.2, in accordance with Yuste et al. (2003).
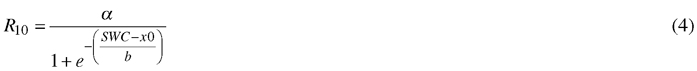
R10 was assumed to follow a sigmoidal function (Graham et al. 2014) of soil water content (SWC) as follows:
2.7 Statistical analyses
To test differences in soil temperature, soil water content and R10 between selected pairs of the plots for each measurement campaign, t-tests were applied. Correlations between different parameters were tested by the Pearson Correlation. F-test was applied to analyse the relationship of SWC and R10 between relevant plots. Statistical significance of the analyses was tested at α = 0.05 probability level. Statistical analyses were performed using SigmaPlot 11.0 analytical software (Systat Software, San Jose, CA, USA).
3 Results
3.1 Micrometeorological conditions
Mean soil temperature in times of measurements ranged between 11 and 24 °C with the highest values in July and August (Fig. 1). The lack of precipitation in July and September 2015 and September 2016 (Fig. 1) resulted in low SWC just around 10% (Fig. 2). On the contrary, the highest SWC was measured on 14 April 2016 when it reached about 38%.
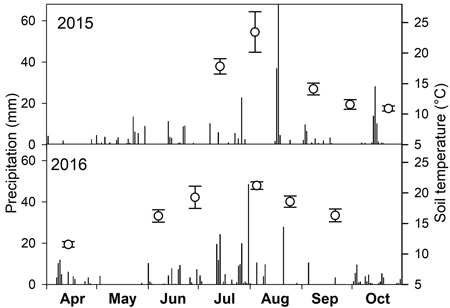
Fig. 1. Daily sum of precipitation (bars) over two growing seasons and mean soil temperature (open circles) with standard deviation on dates of soil CO2 efflux measurements.
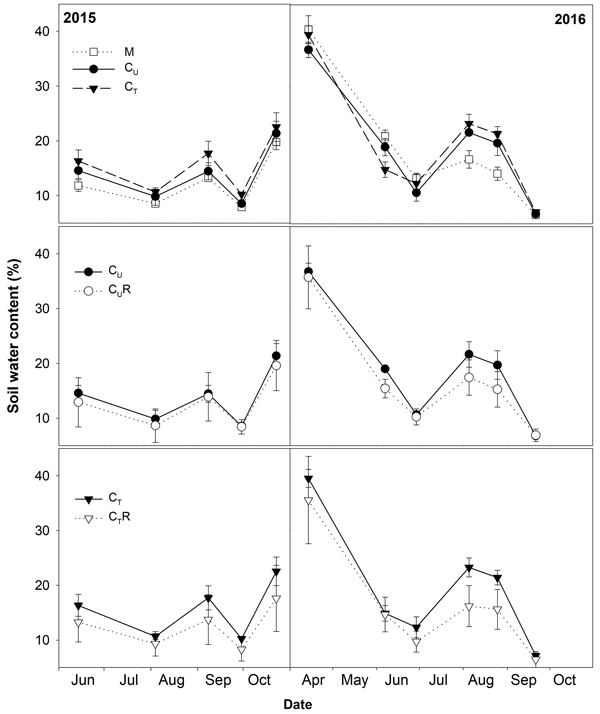
Fig. 2. Mean soil water content (±SD) in the studied plots: M-mature stand, CU-unthinned coppice stand, CT-thinned coppice stand, CUR-coppice stand with reduced throughfall, and CTR-thinned coppice stand with reduced throughfall.
3.2 Hemispherical photographs
Gap fraction in the mature stand (M) was found to be significantly higher than in CU and CT (p = 0.017 and 0.025, respectively) reaching 15.7 ± 2.7%. The mature stand was also characterised by the lowest LAI (3.55 ± 0.4) compared to the CU and CT (4.55 ± 0.38 and 4.78 ± 0.98; p = 0.017 and 0.025, respectively; Fig. 3). We detected only a slight increase in gap fraction as a result of thinning of the coppice stand. The difference between CU and CT was only 8.3% in proportion (p > 0.05). On the other hand, LAI did not show any difference between these plots (Fig. 3).
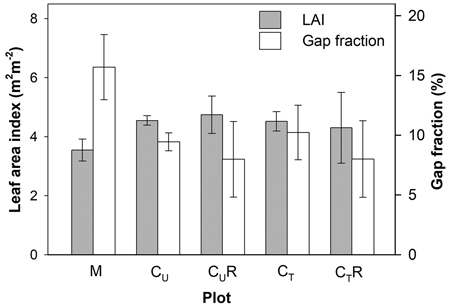
Fig. 3. Mean gap fraction and leaf area index above soil CO2 efflux measurement positions in the individual plots: M-mature stand, CU-coppice stand, CT-thinned coppice stand, CUR-coppice stand with reduced throughfall, and CTR-thinned coppice stand with reduced throughfall. For calculation of mean LAI in CUR and CTR positions shaded by the drainage channels were excluded, while for calculation of mean gap fraction all positions were included.
Differences in gap fraction and LAI between CU and CUR positions unsheltered by the drainage channels or between CT and CTR positions unshaded by the drainage channels were negligible, which confirms the comparability of the pairs of the plots in respect of above-ground biomass cover. Installation of the drainage channels in CUR and CTR decreased measured gap fraction by 15.4% and 21.8% in proportion compared to C and CT, respectively.
3.3 Soil CO2 efflux
Soil CO2 efflux ranged between 0.9 and 8.3 μmol m–2 s–1 and it increased with increasing TS. When measurement dates with SWC below 10% were excluded (4 August and 30 September 2015, 29 June and 21 September 2016), the R2 values of the exponential relationships between TS and RS were over 0.80 in all plots. Q10 calculated from these relationships are summarized in Table 1.
| Table 1. Q10 values and the parameters the coefficient of determination (R2) of the sigmoid fit of the relationships between soil CO2 efflux normalised for temperature of 10 °C (R10) and soil water content (SWC) from Fig. 5 [R10 = a/(1+exp(–(SWC–x0)/b))] for individual plots: M-mature stand, CU-coppice stand, CT-thinned coppice stand, CUR-coppice stand with reduced throughfall, and CTR-thinned coppice stand with reduced throughfall. | |||||
| M | CU | CT | CUR | CTR | |
| Q10 | 1.85 | 2.27 | 2.29 | 2.56 | 2.43 |
| a | 2.53 | 2.39 | 2.42 | 1.99 | 1.98 |
| b | 1.68 | 1.64 | 2.38 | 2.68 | 4.17 |
| x0 | 7.18 | 6.85 | 6.39 | 6.81 | 5.74 |
| R2 | 0.68 | 0.79 | 0.84 | 0.91 | 0.82 |
Soil CO2 efflux normalized for temperature of 10 °C (R10) ranged between 0.8 and 3.8 μmolCO2 m–2 s–1. The lowest values were detected on days with the lowest SWC (Fig. 4) and R10 grew with increasing SWC (Fig. 5). In all plots, there was an evidence of an increase in R10 up to SWC of about 15%. No further change was observed for the measurement on 14 April 2016 when SWC reached values around 40%. The lowest maxima of the fit (a-parameter of the function) were observed for CUR and CTR (Table1). The steepest rise of the function (b-parameter) was found for M and CU, while the slowest was in CTR.
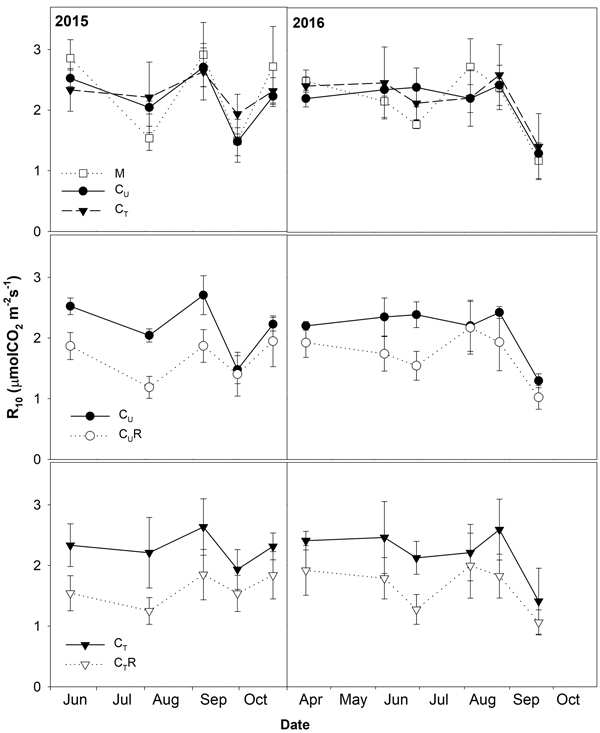
Fig. 4. Mean soil CO2 efflux normalised for temperature of 10 °C (R10; ±SD) in the studied plots: M-mature stand, CU-coppice stand, CT-thinned coppice stand, CUR-coppice stand with reduced throughfall, and CTR-thinned coppice stand with reduced throughfall.
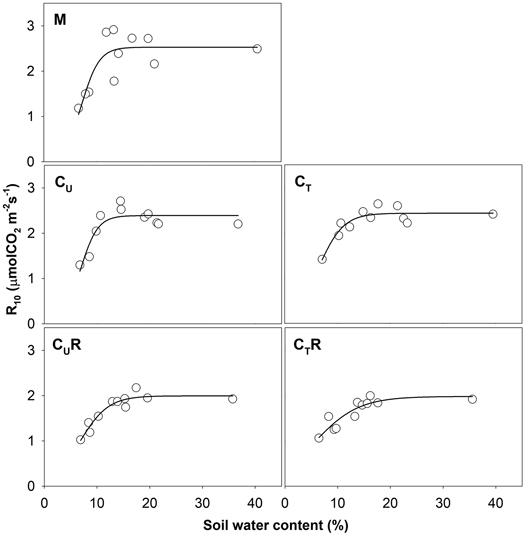
Fig. 5. Relationship between soil water content and R10 in individual plots: M-mature stand, CU-coppice stand, CT-thinned coppice stand, CUR-coppice stand with reduced throughfall, and CTR-thinned coppice stand with reduced throughfall.
3.4 Effect of gap fraction
No significant correlation was found between gap fraction and SWC in any plot or date. However, a slight increasing trend in SWC with increasing gap fraction was found in individual plots CU, CT, CUR and CTR on several dates.
No significant correlation was found between gap fraction and R10 in any plot or date. However, a slight increasing trend in R10 with increasing gap fraction was found in CU and CT, but decreasing trend in CUR on several dates.
3.5 Effect of coppicing and thinning
There were varied differences in SWC between M and CU without any distinctive temporal pattern (Fig. 6 and Fig. 7). Only on 29 June 2016 SWC in M was significantly higher and on 5 August 2016 and 25 August 2016 significantly lower compared to CU (Table 2). Differences in R10 between M and CU ranged from 2% to 35% (Fig. 7) but no clear pattern was observed (Fig. 8, Table 3). Significant difference was found only on 29 June 2016 (Table 2).
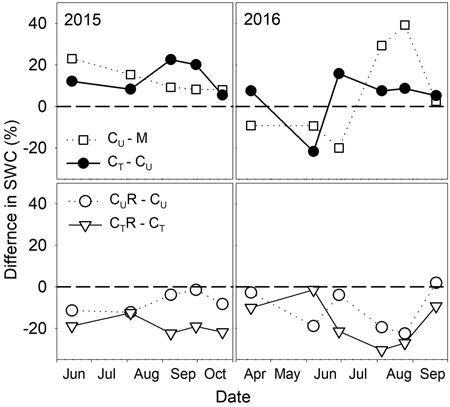
Fig. 6. Percentage differences in soil water content (SWC) between selected plots: M-mature stand, CU-coppice stand, CT-thinned coppice stand, CUR-coppice stand with reduced throughfall, and CTR-thinned coppice stand with reduced throughfall.
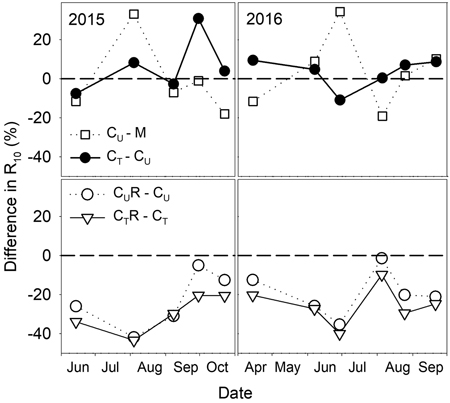
Fig. 7. Percentage differences in R10 (soil CO2 efflux normalised for temperature of 10 °C) between selected plots: M-mature stand, CU-coppice stand, CT-thinned coppice stand, CUR-coppice stand with reduced throughfall, and CTR-thinned coppice stand with reduced throughfall.
| Table 2. Results of statistical analyses (p-values of t-tests) comparing soil water content (SWC) and R10 between plots on individual dates: M-mature stand, CU-coppice stand, CT-thinned coppice stand, CUR-coppice stand with reduced throughfall, and CTR-thinned coppice stand with reduced throughfall. Asterisks indicate significant difference in the level α = 0.05. | ||||||||||||
| 2015 | 2016 | |||||||||||
| 14 Jul | 4 Aug | 8 Sep | 30 Sep | 23 Oct | 14 Apr | 7 Jun | 29 Jun | 5 Aug | 25 Aug | 21 Sep | ||
| SWC | M × CU | 0.056 | 0.247 | 0.276 | 0.216 | 0.353 | 0.095 | 0.050 | 0.004* | 0.039* | 0.028* | 0.586 |
| CU × CT | 0.282 | 0.444 | 0.104 | 0.005* | 0.583 | 0.102 | 0.009* | 0.203 | 0.388 | 0.369 | 0.363 | |
| CU × CUR | 0.243 | 0.273 | 0.610 | 0.883 | 0.578 | 0.778 | 0.024* | 0.650 | 0.139 | 0.138 | 0.861 | |
| CT × CTR | 0.096 | 0.048* | 0.096 | 0.184 | 0.265 | 0.447 | 0.920 | 0.167 | 0.041* | 0.061 | 0.497 | |
| R10 | M × CU | 0.161 | 0.017* | 0.595 | 0.953 | 0.273 | 0.065 | 0.462 | 0.009* | 0.223 | 0.879 | 0.547 |
| CU × CT | 0.429 | 0.650 | 0.833 | 0.120 | 0.575 | 0.102 | 0.787 | 0.258 | 0.982 | 0.598 | 0.743 | |
| CU × CUR | 0.012* | 0.002* | 0.026* | 0.776 | 0.325 | 0.134 | 0.068 | 0.010* | 0.933 | 0.152 | 0.106 | |
| CT × CTR | 0.040* | 0.046* | 0.095 | 0.197 | 0.139 | 0.125 | 0.164 | 0.016* | 0.626 | 0.099 | 0.357 | |
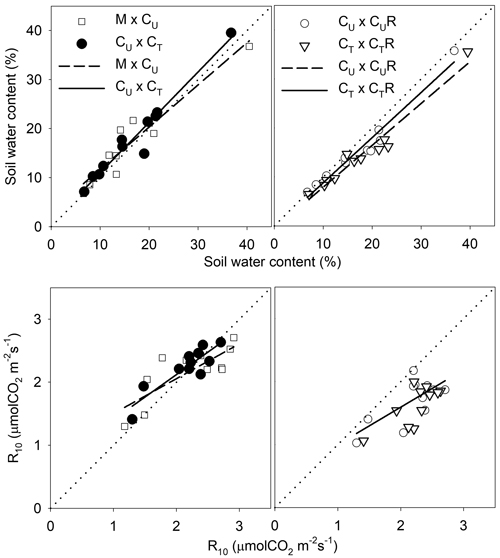
Fig. 8. Linear regressions describing the relationship of soil water content (SWC) and soil CO2 efflux normalised for temperature of 10 °C (R10) between selected pairs of the plots: M-mature stand, CU-coppice stand, CT-thinned coppice stand, CUR-coppice stand with reduced throughfall, and CTR-thinned coppice stand with reduced throughfall.
| Table 3. Statistics of the linear regressions from Fig. 8 describing the relationship of soil water content (SWC, %) and R10 (μmolCO2 m–2 s–1) between selected pairs of the plots: M-mature stand, CU-coppice stand, CT-thinned coppice stand, CUR-coppice stand with reduced throughfall, and CTR-thinned coppice stand with reduced throughfall. y0 and a are the parameters of the linear regression (y = y0 + a*x); F and p are the parameters of the F-test of the regressions, statistically significant regression corresponds to p < 0.05. | ||||||
| y0 | a | R2 | F | p | ||
| SWC | M × CU | 3.09 | 0.86 | 0.9 | 87.4 | <0.0001 |
| CU × CT | 0.68 | 1.02 | 0.95 | 188 | <0.0001 | |
| CU × CUR | –0.41 | 0.92 | 0.9648 | 246.4 | <0.0001 | |
| CT × CTR | –0.63 | 0.85 | 0.9519 | 178.1 | <0.0001 | |
| R10 | M × CU | 0.95 | 0.55 | 0.63 | 15.6 | 0.0034 |
| CU × CT | 0.69 | 0.71 | 0.79 | 34.1 | 0.0002 | |
| CU × CUR | 0.41 | 0.59 | 0.50 | 9.0 | 0.0150 | |
| CT × CTR | 0.41 | 0.59 | 0.50 | 9.0 | 0.0148 | |
Thinning resulted in an increase in SWC in the coppiced stand on all dates except for 7 June 2016 (Fig. 4). The increase was as much as by 22.5% in proportion (Fig. 6). However, the significant differences between CU and CT were found only on two dates (Table 2). Differences in R10 between C and CT were small, mostly less than 10%, and not significant (p > 0.05; Fig. 7, Table 2)
3.6 Effect of throughfall reduction
The drainage channels caused reduction of SWC on both plots on all dates (Fig. 2). The statistics for the individual dates are summarized in Table 2. The reduction of SWC reached up to 30.5% (Fig. 6) and the difference in SWC between plots increased with SWC as indicated by the regression slope in Fig. 8. Small differences were also found for 14 April 2016 when soil moisture far exceeded SWC on other dates. The throughfall reduction had a stronger effect on SWC in CT compared to CU by 0.3% to 18.5% in proportion (Fig. 6).
R10 was reduced in both CUR and CTR compared to CU and CT, respectively, on all dates (Fig. 2). The maximum reduction was observed on 4 August 2015 and reached 41.9% in CUR and 43.4% in CTR. On the contrary, the lowest R10 reduction was on 5 August 2016 when reaching 1.4% in CUR and 9.8% in CTR. Generally, the reduction of R10 was slightly higher in CTR compared to CUR (Fig. 7, Fig. 8).
The percentage reduction of R10 did not correlate with the percentage reduction of SWC in any treatment (p > 0.05).
4 Discussion
4.1 Temporal dynamics of RS
Soil CO2 efflux increased exponentially with increasing temperature in all plots. R2 of these relationships was always higher than 0.80, which confirms that soil temperature was a driving factor of temporal dynamics of RS at this site during periods without soil water limitation. The parameter of temperature sensitivity of RS (Q10) ranged between 1.85 and 2.56 among the plots, which is comparable to recent findings for oak forests (Darenova et al. 2016; Luan et al. 2011; Rey et al. 2002). Q10 in the mature forest was the lowest compared to the coppiced stands. This finding is consistent with the previous study of Darenova et al. (2016) who observed lower Q10 in a high forest than in a coppice, which was sparser than on our experimental plots. From this result we can speculate, that in mature forest soil CO2 efflux there is a higher proportion of root respiration which is less temperature sensitive than respiration of microbes (Bhupinderpal-Singh et al. 2003; Hogberg 2010). Similar explanation for difference in Q10 between oak stands of different age was given by Luan et al. (2011). On the other hand, reduction of throughfall seems to have no effect on the relationship between temperature and RS as there were small differences in Q10 between CU and CUR, and between CT and CTR.
For the analysis of this relationship between temperature and RS, data from four days when SWC barely exceeded 10% were excluded. Under such conditions, soil water availability becomes a limiting factor and the dependence of RS on temperature declines (Xu et al. 2004). The Q10 value for RS normalization on 10°C was set to be 1.2 on the base of the study of Yuste et al. (2003).
Soil water content (SWC) was the second factor significantly contributing to the seasonal variability of RS. RS normalized on the temperature of 10°C (R10) sharply increased up to SWC of about 15%. Above this level, SWC had no more effect on RS. Such a trend is common for unsaturated soils in different ecosystems and has been described, for example, by Yuste et al. (2003) and Xu et al. (2004). High SWC reduces soil CO2 efflux through limitation of oxygen availability for organic matter decomposition by microbes due to reduced air diffusion (Santruckova et al. 2004). However, at our study site SWC never seemed to reach that high limiting values.
4.2 Effect of gap fraction
We expected increase in SWC with increasing gap fraction above measurement positions, as a result of higher throughfall, which was observed for example by Gray et al. (2002) or Muscolo et al. (2014). We, however, did not find any significant correlation between gap fraction and SWC or R10 in any of the studied plots. Not even in CUR and CTR where some of the positions were under the drainage channels. The reason might be the dimension of the gaps, which were small in our forest type because of the dense canopy. Therefore, we assume that the differences in the throughfall reaching the ground are fast compensated by lateral water flow in the soil. For this same reason, we probably did not find any effect of gap fraction on R10.
4.3 Effect of coppicing and thinning
One of the impacts of forest management is changing of canopy closure. Lower canopy closure, or higher proportion of the gaps, results in higher proportion of throughfall reaching the ground surface to increase SWC (Marin et al. 2000). Although we observed lower gap fraction in the coppice compared to the mature stand, we did not observe significantly higher SWC in M. On 5 and 25 August, the SWC in M was even significantly lower compared to CU.
The mature and the coppice forest stands may also differ in soil water uptake by tree roots for the transpiration (Matejka et al. 2007), and this might account for their differences in SWC. However, Shipek et al. (2004) and Wildy et al. (2004) observed that transpiration tends to be higher for coppice compared to the mature forest as a result of a large number of actively growing sprouts. Nevertheless, we could not determine whether there was such a difference in transpiration between the mature and the coppice stand in our study. We, however, assumed that SWC in the coppice stand could be affected by the dense canopy layer, which shades the ground and decreases water evaporation from its surface. This would be in accordance with Raz-Yaseef et al. (2010) who observed higher SWC on shaded position compared to position under looser canopy.
Thinning of the coppice stand resulted in a slight increase in gap fraction and we thus assume this was the main reason for the higher SWC in CT compared to CU. As the canopy remained low and still dense, we did not expect any major effect of the thinning on evaporation from the soil surface, which would have decreased SWC.
Tree harvest, which precedes the coppice establishment, results in a significant increase in soil CO2 efflux (Londo et al. 1999; Tedeschi et al. 2006). According to Tedeschi et al. (2006), this enhanced RS may be attributed to the higher soil temperature and SWC resulted from the canopy removal and thus stimulating of decomposition of the organic material accumulated in the soil from previous decades, decomposition of the woody debris left on the soil surface after harvest and of dead roots, and development of a grass or herb ground layer of vegetation. Furthermore, the components of soil respiration connected to fresh assimilates supply from leaves are completely removed. As shoots of the coppice are growing, assimilation of the aboveground biomass is getting restored and the effect of harvest on soil respiration declines. Darenova et al. (2016) suggested that it takes about 10 years for RS to be restored to the pre-harvest levels in their study oak coppice forest. The absence of a significant difference in R10 between mature and unthinned coppice (after eight years of harvest) forest stands might be attributed to a possible disappearance of decomposition of debris and dead root. Conversely, a rapid growing aboveground biomass would contribute to the fast restoration of the autotrophic component of RS. Although the canopy in CU was already developed, SWC in CU was slightly higher compared to M. We, however, do not assume that this would have significant effect on the differences in RS between these two plots because of the negligible size of the differences.
Response of soil CO2 efflux to thinning has been studied for single stem forests. The previous studies described no effect (Misson et al. 2005), a decrease (Striegl and Wickland 1998) or an increase in RS shortly after thinning (Cheng et al. 2015; Ohashi et al. 1999) as a result of higher SWC and temperature (Pang et al. 2013). Thinning also affects fresh assimilate supply for rhizosphere respiration. Although, there is a complete stopping of assimilation of the removed trees, the remained trees may use the new space and start growing faster and enlarge their assimilate apparatus, which becomes evident in an increase in autotrophic respiration of the soil as described for example by Cheng et al. (2015). Therefore, effect of thinning on soil CO2 efflux is a combined result of changes of a substrate availability and changes in soil temperature and water as also observed by Tang et al. (2005).
Thinning in a young multiple-shoot coppice does not mean removal of all shoots on one individual. Therefore, remaining shoots can maintain the root system. This may mean that dead root decomposition is not a relevant driving factor when examining the effect of thinning on RS. The increased SWC, observed in this study because of the post-thinning increases in canopy gap, might have slightly enhanced CO2 efflux. Further, it was our expectation that thinning would result in a temporary decrease in new assimilate supply to the soil given that thinning engenders reduction in assimilatory aboveground parts of trees. This can be, however, gradually compensated by increased shoot growth induced after thinning as observed by Fedorova et al. (2016) on our experimental plots. We assume that we did not observed any significant changes in soil CO2 efflux after thinning of the coppiced stand as a result of combination of these processes.
4.4 Effect of reduced throughfall
Covering of the 30% of the ground area with the drainage channels resulted in the lower amount of throughfall reaching the ground leading to as much as 30.5% proportional reduction of SWC in a profile 0–6 cm. The decrease in soil water content in time after a rainfall depends on vertical soil water movement (Rycroft and Amer 1995), uptake by roots for transpiration (Lagergren and Lindroth 2002) and evaporation from the soil surface (Merlin et al. 2011). The rate of these processes increases with increasing SWC, which may explain more rapid drying of soil in wetter plots CU and CT compared CUR and CTR and decrease in differences in SWC between CU and CUR and between CT and CTR with decreasing SWC. Data from 14 April 2016 were out of this relationship as a difference in SWC between the relevant plots was small despite high SWC. The first half of April was characterized by high precipitation and no leaves developed. Therefore, we assume that the high amount of throughfall reaching the ground led to the SWC, which was the highest from all measurement dates, and mitigated the differences in SWC between the plots.
RS was reduced in both CUR and CTR compared CU and CT, respectively and the 30% throughfall reduction resulted in decline of R10 by up to 57.2%. We assume that soil water availability affected both heterotrophic and autotrophic components of RS. The effect of SWC on the heterotrophic respiration is through changes of the amount, composition and activity of microbes (Zhao et al. 2016), while the autotrophic respiration is affected by the response of root activity and leaf photosynthesis to soil water conditions (Brunner et al 2015; Wang et al. 2012). Response of autotrophic respiration to SWC differs among studies. Generally, they describe increase in autotrophic respiration with increasing SWC. For example Jarvi and Burton (2013) found an increase in root respiration along their measured SWC range (8–35%), while in the study of Bryla et al. (2001) root respiration increased only up to SWC of about 10% and then remained plateaued. This is consistent with the study of Jiang et al. (2013) who observed an increase in root biomass in plots with added water compared to control. This was only during a dry season, whereas no effect was found during the wet season. SWC affects autotrophic respiration mainly through reduction of photosynthesis, which means the substrate supply for roots (Kuzyakov and Cheng 2001). Long term precipitation reduction may decrease the productivity of plant biomass. For example, decline in coppice aboveground productivity under reduced rainfall treatments was described for example by Orsag et al. (2015). In their study, the productivity decreased by 20% to 50% as a result of 40% and 70% roof coverage of the ground area. The reduction of the productivity of the photosynthetic biomass would lead to permanent reduction of the autotrophic respiration contributing to total RS. However, the study of Fedorova et al. (in submition) did not confirmed significant effect of reduced SWC on growth of sprouts at our study site. Therefore, we did not expect reduction of autotrophic respiration as a result of reduced biomass. But some differences in autotrophic respiration as a result of lower instantaneous photosynthesis rate caused by lower SWC in plots with the drainage channels may be considered, especially during periods with SWC around 10% when we can expect the highest effect of soil water content on respiration.
Although our results pointed that SWC has an effect on RS only up to about 15%, we observed consistently lower R10 in plots with reduced throughfall. The consistently lower SWC in CUR and CTR might be a reflection of a permanent decline in soil microbial biomass and tree activity, and, therefore, in a corresponding decrease in RS. This observation is supported by a previous studies that found some positive correlation between soil carbon stock and RS with increasing mean annual precipitation (Jobbagy and Jackson 2000; Wang et al. 2010). The smallest reduction of R10 caused by throughfall reduction was observed in 5 August 2016. Shortly before this date, heavy rain occurred. Therefore, we can speculate that this sudden high input of water together with high temperatures (Fig. 1) launched decomposition processes in reduced throughfall plots so RS almost reached magnitudes of plots with ambient precipitation.
5 Conclusions
The main conclusions that can be drawn from this study are as follows:
There was no clear difference in SWC or R10 between the mature and coppiced stand eight years after harvesting. Therefore, we can assume that the effect of the disturbance on soil respiration processes already vanished eight after coppicing.
Thinning of the coppice stand resulted in increase in SWC up to 22% in proportion as a result of increased gap fraction of the canopy. However, no effect on R10 was observed two years after the thinning. We assume this to be a result of opposing effect of soil moisture, removing photosyntheting biomass and changes in root growth caused by thinning on RS.
Throughfall reduction by 30% resulted in decrease in SWC up to proportional 30.5% and led to up to 50.7% reduction of R10 as a result of permanent decline in microbial and tree activity.
Importantly, this study has contributed to characterizing the inter-linked below-and-above ground soil carbon cycling of managed forests.
Acknowledgements
This work was supported by the Ministry of Education, Youth and Sports of CR within the National Sustainability Program I (NPU I), grant number LO1415 and by the Cost Action FP 1301, Project No. LD15117. The facilities for this experiment were supported by the Specific University Research Fund of the FFWT Mendel University in Brno, grant number 15/2015.
References
Aguilos M., Takagi K., Liang N., Ueyama M., Fukuzawa K., Nomura M., Kishida O., Fukazawa T., Takahashi H., Kotsuka C., Sakai R., Ito K., Watanabe Y., Fujinuma Y., Takahashi Y., Murayama T., Saigusa N., Sasa K. (2014). Dynamics of ecosystem carbon balance recovering from a clear-cutting in a cool-temperate forest. Agricultural and Forest Meteorology 197: 26–39. https://doi.org/10.1016/j.agrformet.2014.06.002.
Bhupinderpal-Singh, Nordgren A., Lofvenius M.O., Hogberg M.N., Mellander P.E., Hogberg P. (2003). Tree root and soil heterotrophic respiration as revealed by girdling of boreal Scots pine forest: extending observations beyond the first year. Plant Cell and Environment 26: 1287–1296. https://doi.org/10.1046/j.1365-3040.2003.01053.x.
Bolstad P.V., Davis K.J., Martin J., Cook B.D., Wang W. (2004). Component and whole-system respiration fluxes in northern deciduous forests. Tree Physiology 24: 493–504. https://doi.org/10.1093/treephys/24.5.493.
Borken W., Savage K., Davidson E.A., Trumbore S.E. (2006). Effects of experimental drought on soil respiration and radiocarbon efflux from a temperate forest soil. Global Change Biology 12: 177–193. https://doi.org/10.1111/j.1365-2486.2005.001058.x.
Braendholt A., Ibrom A., Larsen K.S., Pilegaard K. (2018). Partitioning of ecosystem respiration in a beech forest. Agricultural and Forest Meteorology 252: 88–98. https://doi.org/10.1016/j.agrformet.2018.01.012.
Brunner I., Herzog C., Dawes M.A., Arend M., Sperisen C. (2015). How tree roots respond to drought. Frontiers in Plant Science 6: 547. https://doi.org/10.3389/fpls.2015.00547.
Bryla D.R., Bouma T.J., Hartmond U., Eissenstat D.M. (2001). Influence of temperature and soil drying on respiration of individual roots in citrus: integrating greenhouse observations into a predictive model for the field. Plant Cell and Environment 24: 781–790. https://doi.org/10.1046/j.1365-3040.2001.00723.x.
Cheng X.Q., Kang F.F., Han H.R., Liu H.W., Zhang Y.L. (2015). Effect of thinning on partitioned soil respiration in a young Pinus tabulaeformis plantation during growing season. Agricultural and Forest Meteorology 214: 473–482. https://doi.org/10.1016/j.agrformet.2015.09.016.
Darenova E., Čater M., Pavelka M. (2016). Different harvest intensity and soil CO2 efflux in sessile oak coppice forests. iForest-Biogeosciences and Forestry 9: 546–552. https://doi.org/10.3832/ifor1773-009.
Evans J. (1992). Coppice forestry – an overview. In: Buckley G.P. (ed.). Ecology and Managemet of coppice woodlands. Chapman & Hall. p. 18–27.
Fedorova B., Kadavy J., Adamec Z., Kneifl M., Knott R. (2016). Response of diameter and height increment to thinning in oak-hornbeam coppice in the southeastern part of the Czech Republic. Journal of Forest Science (Prague) 62: 229–235. https://doi.org/10.17221/13/2016-JFS.
Fedorova B., Kadavy J., Adamec Z., Knott R., Kucera A., Kneifl M., Drapela K., Inurrigarro R.O. (2018). Effect of thinning and reduced throughfall on the tree growth and soil moisture in Quercus petraea (Matt.) Liebl. and Carpinus betulus L. dominated coppice. Austrian Journal of Forest Science 135: 1–17.
Graham S.L., Hunt J.E., Millard P., McSeveny T., Tylianakis J.M., Whitehead D. (2014). Effects of soil warming and nitrogen addition on soil respiration in a New Zealand tussock grassland. Plos One 9: e91204. https://doi.org/10.1371/journal.pone.0091204.
Gray A.N., Spies T.A., Easter M.J. (2002). Microclimatic and soil moisture responses to gap formation in coastal Douglas-fir forests. Canadian Journal of Forest Research-Revue Canadienne De Recherche Forestiere 32: 332–343. https://doi.org/10.1139/X01-200.
Guan D.X., Wu J.B., Zhao X.S., Han S.J., Yu G.R., Sun X.M., Jin C.J. (2006). CO2 fluxes over an old, temperate mixed forest in northeastern China. Agricultural and Forest Meteorology 137: 138–149. https://doi.org/10.1016/j.agrformet.2006.02.003.
Han T.F., Huang W.J., Liu J.X., Zhou G.Y., Xiao Y. (2015). Different soil respiration responses to litter manipulation in three subtropical successional forests. Scientific Reports 5: 18166. https://doi.org/10.1038/srep18166.
Herrero C., Juez L., Tejedor C., Pando V., Bravo F. (2014). Importance of root system in total biomass for Eucalyptus globulus in northern Spain. Biomass & Bioenergy 67: 212–222. https://doi.org/10.1016/j.biombioe.2014.04.023.
Hogberg P. (2010). Is tree root respiration more sensitive than heterotrophic respiration to changes in soil temperature? New Phytologist 188(10): 9–10. https://doi.org/10.1111/j.1469-8137.2010.03366.x.
Inclan R., Uribe C., De La Torre D., Sanchez D.M., Clavero M.A., Fernandez A.M., Morante R., Cardena A., Fernandez M., Rubio A. (2010). Carbon dioxide fluxes across the Sierra de Guadarrama, Spain. European Journal of Forest Research 129: 93–100. https://doi.org/10.1007/s10342-008-0247-1.
Jarvi M.P., Burton A.J. (2013). Acclimation and soil moisture constrain sugar maple root respiration in experimentally warmed soil. Tree Physiology 33: 949–959. https://doi.org/10.1093/treephys/tpt068.
Jiang H., Deng Q., Zhou G., Hui D., Zhang D., Liu S., Chu G., Li J. (2013). Responses of soil respiration and its temperature/moisture sensitivity to precipitation in three subtropical forests in southern China. Biogeosciences 10: 3963–3982. https://doi.org/10.5194/bg-10-3963-2013.
Jobbagy E.G., Jackson R.B. (2000). The vertical distribution of soil organic carbon and its relation to climate and vegetation. Ecological Applications 10: 423–436. https://doi.org/10.2307/2641104.
Kadavy J., Kneifl M., Knott R. (2011a). Biodiversity and target management of endangered and protected species in coppices and coppices with standards included in system of Natura 2000: methodology of establishment of experimental research plots in the conversion to coppice and coppice-with-standards and their description. Brno, Mendel University in Brno. 58 p.
Kadavy J., Kneifl M., Servus M., Knott R., Hurt V., Flora M. (2011b). Nízký a střední les – plnohodnotná alternativa hospodaření malých a středních vlastníků lesa (Obecná východiska). Kostelec nad Černými Lesy: Lesnická práce, sro. 296 p.
Kishchuk B.E., Morris D.M., Lorente M., Keddy T., Sidders D., Quideau S., Thiffault E., Kwiaton M., Maynard D. (2016). Disturbance intensity and dominant cover type influence rate of boreal soil carbon change: a Canadian multi-regional analysis. Forest Ecology and Management 381: 48–62. https://doi.org/10.1016/j.foreco.2016.09.002.
Kuzyakov Y. (2006). Sources of CO2 efflux from soil and review of partitioning methods. Soil Biology & Biochemistry 38: 425–448. https://doi.org/10.1016/j.soilbio.2005.08.020.
Kuzyakov Y., Cheng W. (2001). Photosynthesis controls of rhizosphere respiration and organic matter decomposition. Soil Biology & Biochemistry 33: 1915–1925. https://doi.org/10.1016/S0038-0717(01)00117-1.
Lagergren F., Lindroth A. (2002). Transpiration response to soil moisture in pine and spruce trees in Sweden. Agricultural and Forest Meteorology 112: 67–85. https://doi.org/10.1016/S0168-1923(02)00060-6.
Law B.E., Ryan M.G., Anthoni P.M. (1999). Seasonal and annual respiration of a ponderosa pine ecosystem. Global Change Biology 5: 169–182. https://doi.org/10.1046/j.1365-2486.1999.00214.x.
Lindner M., Lucht W., Bouriaud O., Green T., Janssens I.A. (2004). Specific study on forest greenhouse gas budget. CarboEurope-GHG concerned action – synthesis of the European greenhouse gas budget. Report 8/2004. Specific Study 1. Viterbo, Italy. 62 p.
Lloyd J., Taylor J.A. (1994). On the temperature-dependence of soil respiration. Functional Ecology 8: 315–323. https://doi.org/10.2307/2389824.
Londo A.J., Messina M.G., Schoenholtz S.H. (1999). Forest harvesting effects on soil temperature, moisture, and respiration in a bottomland hardwood forest. Soil Science Society of America Journal 63: 637–644. https://doi.org/10.2136/sssaj1999.03615995006300030029x.
Luan J.W., Liu S.R., Wang J.X., Zhu X.L., Shi Z.M. (2011). Rhizospheric and heterotrophic respiration of a warm-temperate oak chronosequence in China. Soil Biology & Biochemistry 43: 503–512. https://doi.org/10.1016/j.soilbio.2010.11.010.
Mairota P., Buckley P., Suchomel C., Heinsoo K., Verheyen K., Hedl R., Terzuolo P.G., Sindaco R., Carpanelli A. (2016). Integrating conservation objectives into forest management: coppice management and forest habitats in Natura 2000 sites. iForest-Biogeosciences and Forestry 9: 560–568. https://doi.org/10.3832/ifor1867-009.
Marin C.T., Bouten W., Sevink J. (2000). Gross rainfall and its partitioning into throughfall, stemflow and evaporation of intercepted water in four forest ecosystems in western Amazonia. Journal of Hydrology 237: 40–57. https://doi.org/10.1016/S0022-1694(00)00301-2.
Matejka F., Strelcova K., Hurtalova T., Goemoeryova E., Ditrnarova L. (2009). Seasonal changes in transpiration and soil water content in a spruce primeval forest during a dry period. In: Střelcová K. et al. (eds.). Bioclimatology and natural hazards. Springer, Dordrecht. p. 197–206.
Mayer M., Sanden H., Rewald B., Godbold D.L., Katzensteiner K. (2017) Increase in heterotrophic soil respiration by temperature drives decline in soil organic carbon stocks after forest windthrow in a mountainous ecosystem. Funct Ecol 31: 1163–1172. https://doi.org/10.1111/1365-2435.12805.
Merckx T., Feber R.E., Hoare D.J., Parsons M.S., Kelly C.J., Bourn N.A.D., Macdonald D.W. (2012). Conserving threatened Lepidoptera: towards an effective woodland management policy in landscapes under intense human land-use. Biological Conservation 149: 32–39. https://doi.org/10.1016/j.biocon.2012.02.005.
Merlin O., Al Bitar A., Rivalland V., Beziat P., Ceschia E., Dedieu G. (2011). An analytical model of evaporation efficiency for unsaturated soil surfaces with an arbitrary thickness. Journal of Applied Meteorology and Climatology 50: 457–471. https://doi.org/10.1175/2010JAMC2418.1.
Misson L., Tang J.W., Xu M., McKay M., Goldstein A. (2005). Influences of recovery from clear-cut, climate variability, and thinning on the carbon balance of a young ponderosa pine plantation. Agricultural and Forest Meteorology 130: 207–222. https://doi.org/10.1016/j.agrformet.2005.04.001.
Muscolo A., Bagnato S., Sidari M., Mercurio R. (2014). A review of the roles of forest canopy gaps. Journal of Forestry Research 25: 725–736. https://doi.org/10.1007/s11676-014-0521-7.
Nakane K., Lee N.J. (1995). Simulation of soil carbon cycling and carbon balance following clear-cutting in a mid-temperate forest and contribution to the sink of atmospheric CO2. Vegetatio 121: 147–156. https://doi.org/10.1007/BF00044680.
Nielsen A.B., Moller F. (2008). Is coppice a potential for urban forestry? The social perspective. Urban Forestry & Urban Greening 7: 129–138. https://doi.org/10.1016/j.ufug.2008.02.005.
Ohashi M.K., Gyokusen K., Saito A. (1999). Measurement of carbon dioxide evolution from a Japanese cedar (Cryptomeria japonica D. Don) forest floor using an open-flow chamber method. Forest Ecology and Management 123: 105–114. https://doi.org/10.1016/S0378-1127(99)00020-1.
Oikawa P.Y., Sturtevant C., Knox S.H., Verfaillie J., Huang Y.W., Baldocchi D.D. (2017). Revisiting the partitioning of net ecosystem exchange of CO2 into photosynthesis and respiration with simultaneous flux measurements of 13CO2 and CO2, soil respiration and a biophysical model, CANVEG. Agricultural and Forest Meteorology 234: 149–163. https://doi.org/10.1016/j.agrformet.2016.12.016.
Orsag M., Fischer M., Tripathi A.M., Zalud Z., Trnka M. (2015). Long-term productivity of short rotation coppice under decreased soil water availability. Global change: a complex challenge conference proceedings. p. 98–101.
Pang X., Bao W., Zhu B., Cheng W. (2013). Responses of soil respiration and its temperature sensitivity to thinning in a pine plantation. Agricultural and Forest Meteorology 171: 57–64. https://doi.org/10.1016/j.agrformet.2012.12.001.
Paul-Limoges E., Black T.A., Christen A., Nesic Z., Jassal R.S. (2015). Effect of clearcut harvesting on the carbon balance of a Douglas-fir forest. Agricultural and Forest Meteorology 203: 30–42. https://doi.org/10.1016/j.agrformet.2014.12.010.
Raz-Yaseef N., Rotenberg E., Yakir D. (2010). Effects of spatial variations in soil evaporation caused by tree shading on water flux partitioning in a semi-arid pine forest. Agricultural and Forest Meteorology 150: 454–462. https://doi.org/10.1016/j.agrformet.2010.01.010.
Rey A., Pegoraro E., Tedeschi V., De Parri I., Jarvis P.G., Valentini R. (2002). Annual variation in soil respiration and its components in a coppice oak forest in Central Italy. Global Change Biology 8: 851–866. https://doi.org/10.1046/j.1365-2486.2002.00521.x.
Rycroft D.W., Amer M.H. (1995). Prospects for the drainage of clay soils. Food and Agriculture Organization, Rome, IT. 147 p.
Santruckova H., Picek T., Tykva R., Simek M., Pavlu B. (2004). Short-term partitioning of 14C-[U]-glucose in the soil microbial pool under varied aeration status. Biology and Fertility of Soils 40: 386–392. https://doi.org/10.1007/s00374-004-0790-y.
Shipek D.C., Ffolliott P.F., Gottfried G.J., DeBano L.F. (2004). Transpiration and multiple use management of thinned Emory oak coppice. Research Paper RMRS-RP-48, USDA Forest Service, Rocky Mountain Forest and Range Experiment Station, Fort Collins, CO. https://doi.org/10.2737/RMRS-RP-48.
Striegl R.G., Wickland K.P. (1998). Effects of a clear-cut harvest on soil respiration in a jack pine – lichen woodland. Canadian Journal of Forest Research 28: 534–539. https://doi.org/10.1139/cjfr-28-4-534.
Tang J., Qi Y., Xu M., Misson L., Goldstein A.H. (2005). Forest thinning and soil respiration in a ponderosa pine plantation in the Sierra Nevada. Tree Physiology 25: 57–66. https://doi.org/10.1093/treephys/25.1.57.
Tedeschi V., Rey A., Manca G., Valentini R., Jarvis P.G., Borghetti M. (2006). Soil respiration in a Mediterranean oak forest at different developmental stages after coppicing. Global Change Biology 12: 110–121. https://doi.org/10.1111/j.1365-2486.2005.01081.x.
UN/ECE-FAO (2000). Forest resources of Europe, CIS, North America, Australia, Japan and New Zeland, Main Report. Geneva Timber and Forest Study Papers 17, United Nations, Geneva, Switzerland. 445 p.
Wang M., Shi S., Lin F., Hao Z., Jiang P., Dai G. (2012). Effects of soil water and nitrogen on growth and photosynthetic response of manchurian ash (Fraxinus mandshurica) seedlings in Northeastern China. Plos One 7: e30754. https://doi.org/10.1371/journal.pone.0030754.
Wang W., Chen W., Wang S. (2010). Forest soil respiration and its heterotrophic and autotrophic components: global patterns and responses to temperature and precipitation. Soil Biology & Biochemistry 42: 1236–1244. https://doi.org/10.1016/j.soilbio.2010.04.013.
Wang W.J., Dalal R.C., Moody P.W., Smith C.J. (2003). Relationships of soil respiration to microbial biomass, substrate availability and clay content. Soil Biology & Biochemistry 35: 273–284. https://doi.org/10.1016/S0038-0717(02)00274-2.
Wildy D.T., Pate J.S., Sefcik L.T. (2004). Water-use efficiency of a mallee eucalypt growing naturally and in short-rotation coppice cultivation. Plant and Soil 262: 111–128. https://doi.org/10.1023/B:PLSO.0000037030.61945.0d.
Wu J., Larsen K.S., van der Linden L., Beier C., Pilegaard K., Ibrom A. (2013) Synthesis on the carbon budget and cycling in a Danish, temperate deciduous forest. Agricultural and Forest Meteorology 181: 94–107. https://doi.org/10.1016/j.agrformet.2013.07.012.
Xu L.K., Baldocchi D.D., Tang J.W. (2004). How soil moisture, rain pulses, and growth alter the response of ecosystem respiration to temperature. Global Biogeochemical Cycles 18: GB4002. https://doi.org/10.1029/2004GB002281.
Yuste J.C., Janssens I.A., Carrara A., Meiresonne L., Ceulemans R. (2003). Interactive effects of temperature and precipitation on soil respiration in a temperate maritime pine forest. Tree Physiology 23: 1263–1270. https://doi.org/10.1093/treephys/23.18.1263.
Zhao C., Miao Y., Yu C., Zhu L., Wang F., Jiang L., Hui D., Wan S. (2016). Soil microbial community composition and respiration along an experimental precipitation gradient in a semiarid steppe. Scientific Reports 6: 24317. https://doi.org/10.1038/srep24317.
Total of 65 references.
