Timo Saksa  ,
Jari Miina,
Hilkka Haatainen,
Kauko Kärkkäinen
,
Jari Miina,
Hilkka Haatainen,
Kauko Kärkkäinen
Quality of spot mounding performed by continuously advancing mounders
Saksa T., Miina J., Haatainen H., Kärkkäinen K. (2018). Quality of spot mounding performed by continuously advancing mounders. Silva Fennica vol. 52 no. 2 article id 9933. https://doi.org/10.14214/sf.9933
Highlights
- The number and quality of mounds varied considerably according to the operating conditions
- The main factors reducing the quality of spot mounding were steep terrain, a thick humus layer, fresh logging residues, stoniness and soil texture
- With careful selection of timing and conditions for mounding, the quality obtained by continuously advancing mounders can be improved.
Abstract
Operating conditions affecting the quality of spot mounding by Bracke continuously advancing mounders were investigated on 66 regeneration areas (124 ha) in eastern Finland. The quality of mounds was classified as suitable (good or acceptable after additional compression) or unsuitable for planting. Models were constructed for the number of suitable planting spots obtained per hectare (good and acceptable mounds), the probability of successful mounding (≥1600 planting spots ha–1) and the probability of creating a suitable mound as a function of terrain, site and soil characteristics, as well as slash conditions (removed, fresh or dry logging residues). The average number of mounds created was 1892 ± 290 mounds ha–1, of which 1398 ± 325 mounds ha–1 (74%) were classified as suitable for planting. The quality of spot mounding was reduced by steep terrain, a thick humus layer and fresh logging residues. Stoniness and soil texture also affected the number of planting spots created. Mounding after logging residues had dried increased the number of planting spots by 191 spots ha–1 compared with mounding in the presence of fresh residues. Removing residues did not significantly increase the number of planting spots compared with mounding amongst dry residues. A thick humus layer, very stony soil, steep slopes and valley terrain decreased the number of planting spots by 150–450 spots ha–1. The number and quality of mounds varied considerably according to the operating conditions, but with careful selection of timing and sites the quality obtained by a continuously advancing mounder can be improved.
Keywords
soil preparation;
slash;
logging residues;
forest regeneration;
mixed modelling
-
Saksa,
Natural Resources Institute Finland (Luke), Juntintie 154, FI-77600 Suonenjoki, Finland
E-mail
timo.saksa@luke.fi
- Miina, Natural Resources Institute Finland (Luke), Yliopistokatu 6, FI-80100 Joensuu, Finland E-mail jari.miina@luke.fi
- Haatainen, Faculty of Science and Forestry, School of Forest Sciences, University of Eastern Finland, P.O. Box 111, FI-80101 Joensuu, Finland E-mail hilkka.haatainen@storaenso.com
- Kärkkäinen, Tornator Oyj, Muuntamontie 2, FI-80100 Joensuu, Finland E-mail kauko.karkkainen@tornator.fi
Received 7 December 2017 Accepted 9 April 2018 Published 13 April 2018
Views 74647
Available at https://doi.org/10.14214/sf.9933 | Download PDF

1 Introduction
In Finland, on about 90% of reforestation areas the soil is mechanically prepared before planting, direct seeding or natural regeneration. In 2016, the soil was prepared in a total of 103 300 ha, in which the most common treatment was mounding (62% of the total area, http://stat.luke.fi/en/metsa). Soil preparation supports the establishment and improves the development of tree seedlings, reducing competition from undesired vegetation and damage by pine weevils (Hylobius abietis L.). At the same time, unnecessary soil disturbance should be avoided so as not to encourage regeneration of broadleaved species (Karlsson et al. 2002), soil erosion, or nutrient loss (Palviainen et al. 2014).
The soil preparation method is selected based on factors such as site fertility, soil texture, regeneration method and tree species. Spot mounding is widely used, especially in combination with Norway spruce (Picea abies (L.) Karst.) planting, because it exposes an adequate amount of mineral soil, creates good planting spots and encourages rapid initial growth (Nilsson and Örlander 1995; Saksa et al. 2005; Uotila et al. 2010). For spruce, the recommendation is that 1600–2000 seedlings ha–1 should be planted (Äijälä et al. 2014), and thus a number of suitable planting spots in that range should be created by mounding.
Spot mounding is a method wherein the forest floor and its underlying mineral soil is removed and overturned onto an adjacent piece of undisturbed forest floor (Sutton 1993; Löf et al. 2015). The height of the mounds is 15–20 cm at medium and coarse-textured sites and 5–10 cm at fine-textured sites (Luoranen et al. 2007). A good spot mound has a continuous, 5 to 10 cm thick layer of mineral soil on top of the mound that prevents pine weevil damage (Örlander and Nilsson 1999). In a mound where the organic layer is covered by mineral soil, a stable soil moisture content is guaranteed for tree seedlings; however, stones, stumps or logging residues below or within the mound increase the risk of drying.
At present in Finland, spot mounding is mainly performed using excavators. Continuously advancing mounders have also been used to some extent, mainly in northern Finland. However, interest in using continuously advancing mounders is increasing due to their recent technical development, higher productivity and cost-competitiveness (Saarinen 2006; Rantala et al. 2010). The first continuously advancing mounders were already in use by the late 1970s and early 1980s, and such machines have especially been used in Sweden and Canada (Sutton 1993). Today’s mounders have a hydraulically powered three or four-point mattock wheel mounted on each of two, three or four independent adjustable arms (Löf et al. 2015; McCarthy et al. 2017). The mattock wheels turn and temporarily stop at a predetermined angle, creating a mound as the forwarder moves forward. The mounder creates spot mounds in which a hinge attaches the mound to the underlying undisturbed soil.
According to Saarinen (2006) and Rantala et al. (2010), the average work time per spot mound was three times longer in excavator-based spot mounding compared with the use of a continuously advancing Bracke BD 296 mounder. However, the continuous advancing method may create a low density of good planting spots, especially if the site has stony soil, steep slopes or a large amount of logging residues and stumps (Sutherland 1989; Leblanc 1990; Andersson and Brunberg 1991; Larsson 2011). Modern continuously advancing mounders are equipped with hydraulic load-sensing valves and articulated arms so that mattock wheels are able to find their way around stumps and stones. The operator can continuously adjust the mounding device choosing between eight preset programs depending on the operating conditions at the site (Bracke Forest AB, http://www.brackeforest.com). Therefore, the new features of the latest mounding devices could provide a better quality of spot mounding, even in harsh operating conditions. However, the performance of continuously advancing mounders across a wide range of operating conditions has not been fully investigated.
The aim of this study was to investigate factors that affect the quality of spot mounding with Bracke continuously advancing mounders. The quality of spot mounding was measured on 66 forest regeneration areas under a wide range of operating conditions in eastern Finland. Using the data, models were prepared for the number of suitable planting spots ha–1, the probability of successful mounding and the probability of creating a suitable mound as a function of terrain, site and soil characteristics, as well as slash conditions (removed, fresh or dry logging residues). Based on the models, the characteristics that are most suitable for Bracke continuous mounding were determined.
2 Materials and methods
2.1 Measurements on regeneration areas
Altogether 66 practical forest regeneration areas were inventoried in summer 2016. The regeneration areas were located in 29 forest estates owned by Tornator Oyj in eastern Finland. The areas were spot mounded in 2015 or 2016 using continuously advancing two-row mounders attached to large-sized forwarders. In total, a regeneration area of 124 ha was mounded, individual areas having an average size and standard deviation of 1.9 ± 1.3 ha (range = 0.4–7.2 ha). Mounding was conducted by four different operators; each operator mounded 10–30 regeneration areas and 16–56 ha. Three operators worked with a Bracke M25.a mounding device with laterally articulated arms, and one operator used a Bracke BD 296 (M26.a) model with inwardly articulated arms.
Logging residues were removed from 36 areas (75 ha); stump removal was not used. On eight areas (17 ha), logging residues were still fresh, and on 22 areas (31 ha) residues were dry at the time of mounding. Logging residues were defined as fresh if the area was clear-cut during the previous cutting season (August of the previous year to April of the current year) and mounded in July or earlier. If mounding was postponed to August or later, the previous cutting season residues were considered to have dried during the summer. Also, if clear-cutting was done before the August of the previous year, the residues were considered to have dried during the late summer of that year.
Depending on the size of the regeneration area, 5, 10, 15, 20 or 25 circular sample plots with a radius of 3.99 m (50 m2) were systematically located using a GPS device on the regeneration area of <1, 1–2, 2–4, 4–6 or 6–8 ha, respectively. On each sample plot, the following assessments were done by a forest professional (four persons in total) who was instructed and trained to avoid between-investigator differences in classification. According to the criteria of a good mound given by Luoranen et al. (2007), the number of mounds was counted and classified as good, acceptable for planting after additional boot compression or unsuitable for planting at all. In addition, the following site and soil characteristics were determined: site fertility (rich, medium or sub-dry); terrain (valley, flat or sloping); soil texture class (coarse, medium or fine mineral soil or peat); and thickness of humus layer (cm). The thickness of humus layer and stoniness were measured using the rod-testing method at five random points on the sample plot (Viro 1958). Based on the average penetration (excluding humus) of the rod, the stoniness was classified as stoneless (>21 cm), stony (12–21 cm) or very stony (<12 cm). Wetness, i.e. whether the soil was wet enough to affect regeneration or not, was also determined at each sample plot.
The data consisted of 708 sample plots, of which 656 sample plots were located on areas with mineral soil. Only sample plots located on mineral soil areas were considered in the modelling, because the criteria for a good spot mound are different on peatlands (e.g., no mineral soil layer on top of the mound). Among the sample plots located on peat soil areas (52 plots on ten regeneration areas), the total number of mounds was, on average, 1769 ± 405 mounds ha–1; of which 569 ± 512 mounds ha–1 were good, 523 ± 329 mounds ha–1 were acceptable after additional compression, and 677 ± 406 mounds ha–1 were unsuitable for planting.
The modelling data consisted of 656 sample plots with mineral soil, in which the quality of 6217 mounds was determined (Table 1). On most sample plots, the terrain was flat and the site was stony, medium-textured and of medium fertility, i.e. a Myrtillus type site in the Finnish system of classification (Cajander 1926). Wet soil was expected to affect regeneration on only 8% of the sample plots.
| Table 1. The number of suitable planting spots (good and acceptable after additional compression) and the main characteristics on the 50 m2 sample plots in the modelling data (i.e., the sample plots with mineral soil, N = 656). | |||
| Variable | Mean | Std dev. | Range |
| Planting spots per 50 m2 | 7.0 | 2.8 | 0–17 |
| Thickness of humus, cm | 6.5 | 2.4 | 2–20 |
| N | % | ||
| Logging residues | Removed | 400 | 61 |
| Fresh | 83 | 13 | |
| Dry | 173 | 26 | |
| Site fertility a | Rich | 64 | 10 |
| Medium | 568 | 87 | |
| Sub-dry | 24 | 4 | |
| Soil texture | Coarse | 8 | 1 |
| Medium | 474 | 72 | |
| Fine | 174 | 27 | |
| Stoniness | Stoneless | 193 | 29 |
| Stony | 389 | 59 | |
| Very stony | 74 | 11 | |
| Terrain | Sloping | 150 | 23 |
| Flat | 480 | 73 | |
| Valley | 26 | 4 | |
| Wetness b | Not affect | 604 | 92 |
| Affect | 51 | 8 | |
| a Site fertility classes: rich, medium and sub-dry = Oxalis-Myrtillus, Myrtillus and Vaccinium site type, respectively, in the Finnish system of classification (Cajander 1926). b Whether the soil was wet enough to affect regeneration or not. | |||
2.2 Statistical analyses
The data had a multi-level hierarchy, i.e. mounds within sample plots within regeneration areas within forest estates with different operators. Note that the same operator mounded all of the regeneration areas within a single forest estate. Correlated observations were taken into account by including random effects at different levels in the variance component models, and by allowing the intercept to vary randomly across the levels (Searle et al. 1992).
The number of suitable planting spots (i.e., good and acceptable after additional compression) on a 50 m2 sample plot was modelled by fitting a linear mixed model:
![]()
where n is the number of planting spots on the 50 m2 sample plot, f(•) is the fixed part of the model, X is a vector of fixed predictors, and β is a vector of fixed parameters. Subscripts i, j, k and l refer to the sample plot, regeneration area, forest estate and operator, respectively. ul, ulk and ulkj are random, normally distributed between-operator, between-forest estate and between-regeneration area effects with a mean of zero and constant variances. Random terms were assumed to be uncorrelated across the levels. Normality and constant variance of random effects and residuals were achieved without transforming the dependent variable.
A logistic mixed model was fitted for the probability of successful mounding, i.e. the number of suitable planting spots on the 50 m2 sample plot is at least eight (1600 planting spots ha–1):

where γ is the probability of the number of planting spots on the 50 m2 sample plot being at least eight (i.e., 1600 planting spots ha–1). A similar logistic mixed model including a random sample plot effect was used to predict the probability that a mound on the sample plot was classified as suitable for planting (i.e., good or acceptable after additional compression). A binomial assumption of the distribution of the error term, and a logit link function were used in logistic modelling (McCulloch and Searle 2001).
In the modelling, variables such as the machine version (M25.a versus BD 296), slash conditions, site fertility, terrain, soil texture, thickness of humus layer, stoniness and wetness were used as fixed effects. The thickness of the humus layer was considered as a continuous predictor, and the other variables were categorical. The linear model was fitted using the MIXED command and the logistic models using the GENLINMIXED command of the IBM SPSS Statistics version 22 software. To be identified as important predictors, the fixed variables included in the models had to be significant at the 0.1 level.
The accuracy of the predictions of the linear model obtained using the fixed effects only, or both fixed and random effects, was determined by calculating the proportion of explained variance (R2), bias and root mean square error (RMSE). The relative error statistics (bias% and RMSE%) were calculated by dividing the bias and RMSE by the mean of the predicted response.
To determine the quality of the predictions made using the logistic models, the probability of success was predicted for each observation in the modelling data. The accuracy of the predicted classification as success or failure was analysed using the observed success probability as threshold. The overall accuracy is the ratio of the number of correctly classified observations relative to the total number of observations. The value kappa is a measure of the total accuracy that accounts for agreement occurring by chance.
The model predictions were used to illustrate the effects of different operating conditions on the quality of mounding at the sample plot level (i.e., the number of suitable planting spots and the probability of successful mounding on the sample plot) and the quality of an individual mound on the sample plot (i.e., the probability that the quality of a mound was suitable).
3 Results
3.1 Number of suitable planting spots
The number of suitable planting spots (i.e., good and acceptable after additional compression) varied considerably among the 66 regeneration areas treated by the continuously advancing mounder. Based on the sample plots with mineral soil (656 plots), the total number of mounds per regeneration area was, on average, 1892 ± 290 mounds ha–1; of which 919 ± 333 mounds ha–1 were good, 478 ± 178 mounds ha–1 were acceptable after additional compression, and 494 ± 255 mounds ha–1 were unsuitable for planting. Thus, the number of suitable planting spots was, on average, 1398 ± 325 spots ha–1, which is 74 ± 13% of all of the mounds.
A linear mixed model (Eq. 1) was prepared for the number of suitable planting spots on the 50 m2 sample plots with mineral soil (Table 2). The following variables were significant at least at the 0.1 level, and thus included in the final model as predictors that decreased the number of suitable planting spots: fresh logging residues, thick humus layer, stones, as well as sloping and valley terrain. In addition, more suitable planting spots were found at sites with fine and coarse-textured soils than at sites with medium textured soil.
| Table 2. Linear mixed model (Eq. 1) for the number of suitable planting spots (i.e., good and acceptable after additional compression) on the 50 m2 sample plot. F-values are calculated to test the significance of the categorical variables in the model. The fitting statistics using both fixed and random effects are given in parentheses. The modelling data consist of 656 sample plots with mineral soil. | ||||
| Variable | Estimate | Std err. | t-value | p |
| Intercept | 5.741 | 0.941 | 6.10 | <0.001 |
| Slash conditions (ref. Dry) | F = 3.16 | 0.056 | ||
| Fresh | –0.956 | 0.543 | –1.76 | 0.085 |
| Removed | 0.339 | 0.438 | 0.78 | 0.451 |
| Thickness of humus, cm | –0.148 | 0.052 | –2.84 | 0.005 |
| Soil texture (ref. Fine) | F = 3.17 | 0.043 | ||
| Medium | –0.626 | 0.294 | –2.13 | 0.034 |
| Coarse | 0.979 | 0.983 | 1.00 | 0.320 |
| Stoniness (ref. Very stony) | F = 4.68 | 0.010 | ||
| Stony | 0.444 | 0.339 | 1.31 | 0.191 |
| Stoneless | 1.025 | 0.370 | 2.77 | 0.006 |
| Terrain (ref. Valley) | F = 11.74 | <0.001 | ||
| Sloping | 1.467 | 0.573 | 2.56 | 0.011 |
| Flat | 2.233 | 0.551 | 4.05 | <0.001 |
| Random effect | Variance | |||
| Operator (N = 4) | 0.010 | |||
| Forest estate (N = 29) | 1.179 | |||
| Regeneration area (N = 66) | 0.317 | |||
| Sample plot (N = 656) | 5.502 | |||
| Fitting statistics | ||||
| R2, % | 13.6 (34.4) | |||
| Bias, spots per 50 m2 | 0.06 (0.00) | |||
| Bias%, % | 0.8 (0.0) | |||
| RMSE, spots per 50 m2 | 2.60 (2.27) | |||
| RMSE%, % | 37.4 (32.3) | |||
According to the fitted model, removing logging residues and mounding amongst dry logging residues increased the number of suitable planting spots by 259 spots ha–1 and 191 spots ha–1, respectively, compared with mounding amongst fresh residues (Table 2, Fig. 1).
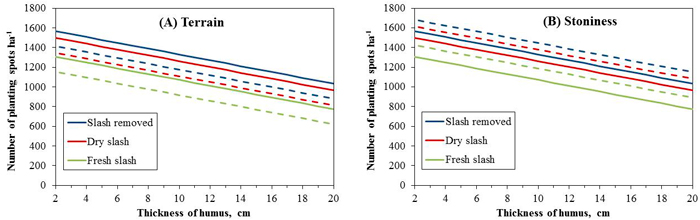
Fig. 1. Predicted number of suitable planting spots ha–1 (i.e., good and acceptable for planting after additional compression) as a function of thickness of humus layer, if logging residues are removed, dry or fresh. Other predictors: A – flat (solid lines) or sloping (broken lines) terrain, medium soil texture and stony soil; B – stony (solid lines) or stoneless (broken lines) soil, flat terrain and medium soil texture.
An increase of 5 cm in the thickness of the humus layer decreased the number of suitable planting spots by 148 spots ha–1. About the same number of planting spots (153 spots ha–1) were lost when mounding was performed on sloping ground; valleys in undulating terrain decreased the number of planting spots by 447 spots ha–1. Stony and very stony soil decreased the number of planting spots by 116 and 205 spots ha–1, respectively.
The proportion of the variance explained by fixed effects (R2) was only 14%, and most of the unexplained variation (79%) was found at the sample plot level (Table 2). Variance associated with the random effect of the operator was minor, but due to the nested hierarchy of the data it was not possible to separate the random effects of the operator, the forest estate and the regeneration area (i.e., the same operator mounded all of the regeneration areas within a single forest estate). Using the total variance of forest estate and regeneration area effects (21% of unexplained variance), the 95% confidence interval for the number of suitable planting spots per hectare was ± 479 spots ha–1. This indicates that random variation at the regeneration area level was large compared with the effects of the fixed predictors.
The variables used to describe the conditions on the regeneration areas had a similar effect on the probability of successful mounding, i.e. the probability that the number of suitable planting spots (good and acceptable after additional compression) on the 50 m2 sample plot was at least eight (1600 spots ha–1) (Table 3). In the logistic mixed model (Eq. 2), slash conditions were a more powerful predictor (F = 5.22, p = 0.006), and soil texture and stoniness were less powerful predictors (F = 1.55, p > 0.1) than in the linear mixed model (Eq. 1).
| Table 3. Logistic mixed model (Eq. 2) for the probability of successful mounding, i.e. the number of suitable planting spots on the 50 m2 sample plot is at least eight (1600 spots ha–1). F-values are calculated to test the significance of the categorical variables in the model. The modelling data consist of 656 sample plots with mineral soil. | |||||
| Variable | Estimate | Std err. | t-value | p | Exp(Est.) |
| Intercept | 0.140 | 1.020 | 0.14 | 0.891 | 1.150 |
| Slash conditions (ref. Dry) | F = 5.22 | 0.006 | |||
| Fresh | –1.255 | 0.548 | –2.29 | 0.022 | 0.285 |
| Removed | 0.326 | 0.433 | 0.75 | 0.453 | 1.385 |
| Thickness of humus, cm | –0.160 | 0.055 | –2.89 | 0.004 | 0.852 |
| Soil texture (ref. Fine) | F = 1.55 | 0.213 | |||
| Medium | –0.185 | 0.289 | –0.64 | 0.523 | 0.831 |
| Coarse | 2.066 | 1.323 | 1.56 | 0.119 | 7.894 |
| Stoniness (ref. Very stony) | F = 1.55 | 0.214 | |||
| Stony | 0.158 | 0.328 | 0.48 | 0.630 | 1.171 |
| Stoneless | 0.523 | 0.359 | 1.46 | 0.146 | 1.687 |
| Terrain (ref. Valley) | F = 6.71 | 0.001 | |||
| Sloping | –0.007 | 0.640 | –0.01 | 0.991 | 0.993 |
| Flat | 0.824 | 0.618 | 1.33 | 0.183 | 2.280 |
| Random effect | Variance | ||||
| Operator (N = 4) | 0.466 | ||||
| Forest estate (N = 29) | 0.443 | ||||
| Regeneration area (N = 66) | 0.235 | ||||
| Exp(Est.) is the exponentiated parameter estimate (i.e. odds ratio) for the corresponding variable. | |||||
When the minimum number of suitable planting spots per sample plot required to classified as successfully mounded was increased from eight to nine (from 1600 to 1800 spots ha–1), the effects of the humus layer and slash conditions were still statistically significant at the 0.05 level, but terrain was a less significant predictor (p = 0.077). On the other hand, using a lower minimum density of suitable planting spots (seven planting spots per plot or 1400 spots ha–1) the effects of slash conditions (p = 0.117) and the humus layer (p = 0.055) became less significant and the effects of stoniness (p = 0.042) and terrain (p = 0.001) became more significant.
The odds of mounding success (at least eight planting spots per plot or 1600 spots ha–1) when logging residues were removed were about 39% higher, and with fresh logging residues about 71% lower than the odds with dry logging residues (Fig. 2). Similarly, flat terrain increased the odds of success by about 130% compared to valley or sloping terrain. A one centimetre increase in thickness of the humus layer resulted in a 15% decrease in the odds of mounding success, when all other independent variables were held constant.
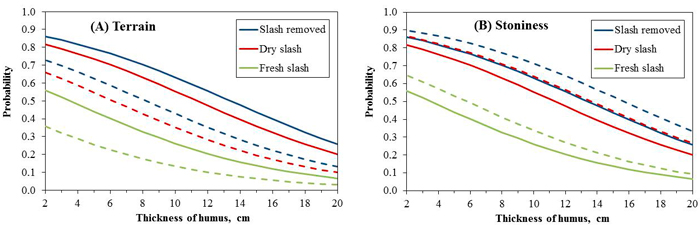
Fig. 2. Predicted probability of successful mounding (i.e., ≥1600 suitable planting spots ha–1) as a function of thickness of humus layer, if logging residues are removed, dry or fresh. Other predictors: A – flat (solid lines) or sloping (broken lines) terrain, medium soil texture and stony soil; B – stony (solid lines) or stoneless (broken lines) soil, flat terrain and medium soil texture.
The accuracy of the predicted classification was calculated so that the observed success probability 0.46 was used as threshold. The agreement of the observed and predicted success of mounding was only fair (Table 4): the overall accuracy was 61% (kappa 0.22). The unexplained variance in the logistic mixed model was more evenly distributed among the random effects (operator 41%, forest estate 39%, and regeneration area 21%) than in the linear mixed model.
| Table 4. Accuracy of the classification of the 50 m2 sample plots as successfully mounded, i.e. the number of suitable planting spots per plot is at least eight (1600 spots ha–1). The predicted categories have been calculated using the fixed part of the model (Eq. 2); the classification using both fixed and random effects are given in parentheses. | ||||
| Observed | Predicted | Total | Accuracy | |
| Success | Failure | |||
| Success | 218 (218) | 81 (81) | 299 | 73% (73%) |
| Failure | 173 (49) | 184 (308) | 357 | 52% (86%) |
| Total | 391 (286) | 265 (389) | 656 | 61% (80%) |
3.2 Quality of mounds
Of the total of 656 sample plots with mineral soil, the quality of 6217 mounds was classified as follows: 74% were suitable (48% good, 26% acceptable after additional compression) and 26% were unsuitable for planting. In the logistic mixed model (Eq. 2) for the probability that the quality of mound was suitable (i.e., good or acceptable after compression), thickness of the humus layer and terrain were the only statistically significant predictors at the 0.05 level (Table 5). Flat terrain increased the odds of obtaining a suitable mound by about 18% and 75% compared, respectively, with slopes and valleys in undulating terrain (Fig. 3).
| Table 5. Logistic mixed model (Eq. 2) for the probability that the quality of mound was good or acceptable for planting after additional compression. F-values are calculated to test the significance of the categorical variables in the model. The modelling data consist of 6217 mounds on 656 sample plots with mineral soil. | |||||
| Variable | Estimate | Std err. | t-value | p | Exp(Est.) |
| Intercept | 1.263 | 0.435 | 2.91 | 0.004 | 3.536 |
| Slash conditions (ref. Dry) | F = 2.57 | 0.076 | |||
| Fresh | –0.385 | 0.213 | –1.81 | 0.070 | 0.680 |
| Removed | 0.035 | 0.208 | 0.17 | 0.866 | 1.036 |
| Thickness of humus, cm | –0.055 | 0.020 | –2.78 | 0.005 | 0.946 |
| Soil texture (ref. Fine) | F = 2.05 | 0.129 | |||
| Medium | –0.227 | 0.120 | –1.88 | 0.060 | 0.797 |
| Coarse | 0.160 | 0.388 | 0.41 | 0.681 | 1.174 |
| Stoniness (ref. Very stony) | F = 1.96 | 0.141 | |||
| Stony | 0.029 | 0.133 | 0.22 | 0.829 | 1.029 |
| Stoneless | 0.203 | 0.144 | 1.41 | 0.159 | 1.225 |
| Terrain (ref. Valley) | F = 4.68 | 0.009 | |||
| Sloping | 0.394 | 0.215 | 1.83 | 0.067 | 1.483 |
| Flat | 0.560 | 0.207 | 2.71 | 0.007 | 1.751 |
| Random effect | Variance | ||||
| Operator (N = 4) | 0.239 | ||||
| Forest estate (N = 29) | 0.225 | ||||
| Regeneration area (N = 66) | 0.034 | ||||
| Sample plot (N = 656) | 0.191 | ||||
| Exp(Est.) is the exponentiated parameter estimate (i.e. odds ratio) for the corresponding variable. | |||||
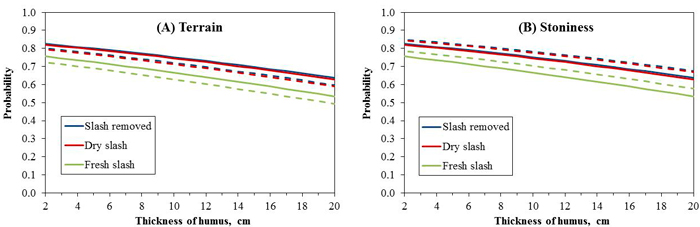
Fig. 3. Predicted probability of suitable mound as a function of thickness of humus layer, if logging residues are removed, dry or fresh. Other predictors: A – flat (solid lines) or sloping (broken lines) terrain, medium soil texture and stony soil; B – stony (solid lines) or stoneless (broken lines) soil, flat terrain and medium soil texture. Note that the lines for Slash removed and Dry slash are overlapping.
The predicted quality of mound showed moderate agreement with the observed data (Table 6): the overall accuracy was 72% (kappa 0.44). Most of the unexplained variance in the logistic mixed model was distributed almost equally among the effects of operator (35%), forest estate (33%) and sample plot (28%).
| Table 6. Accuracy of the classification of the mounds as unsuitable or suitable (i.e., good or acceptable after additional compression) for planting. The predicted categories have been calculated using the fixed part of the model; the classification using both fixed and random effects are given in parentheses. | ||||
| Observed | Predicted quality of mound | Total | Accuracy | |
| Unsuitable | Suitable | |||
| Unsuitable | 313 (1155) | 1302 (460) | 1615 | 19% (72%) |
| Suitable | 452 (1703) | 4150 (2899) | 4602 | 90% (63%) |
| Total | 765 (2858) | 5452 (3359) | 6217 | 72% (65%) |
4 Discussion
In this study, operating conditions affecting the quality of spot mounding by Bracke continuously advancing mounders were investigated on a total of 66 regeneration areas in eastern Finland. The average number of mounds created was 1892 ± 290 mounds ha–1, of which 1398 ± 325 mounds ha–1 (74%) were classified as suitable for planting. In the study of Rantala et al. (2010), the number of suitable mounds created by the mounder was similar, 1430 ± 460 mounds ha–1, although that study used slash and stump removal, which makes spot mounding easier to carry out. We found that the number and quality of mounds varied considerably according to the operating conditions. The main factors affecting the quality of spot mounding were the terrain, the thickness of the humus layer and the characteristics of the logging residues. Stoniness and soil texture affected the number of planting spots created by continuously advancing mounders. On plots with fine-textured soils, the quality of mounding was better than with medium-textured soils, but this result needs to be further evaluated.
The modelling approach used in this study revealed a large unexplained variation in the quality of spot mounding. The unexplained variation was found both within and between regeneration areas, which indicates that factors affecting the quality of mounding were inadequately described by the variables measured on the 50 m2 sample plots. For example, the proportion of the variation in suitable planting spots explained by the fixed part was only 14%, but increased to 34% when random effects were also included in the predictions (Table 2). Due to large random variation, the fitted models cannot be used to predict accurately the expected outcome of spot mounding as a function of the operating conditions on a given soil preparation area. However, the modelling provided quantitative information for the quality management of practical forest regeneration work.
In Sweden, Andersson and Brunberg (1991) found that the quality of continuously advancing mounder was affected by logging residues, stoniness, soil type, wetness, thickness of humus layer, number of stumps and terrain. In their study, for every 100 stumps per ha, the number of unsuitable planting spots increased by 1.5%. We did not inventory stumps, but they could be measured by diameter and tree species and used as predictors. Instead of assessing slash conditions at the regeneration area level, logging residues could also be measured on the sample plots. On the other hand, the size of the sample plot (50 m2) used in this study may be too small to detect the effect of e.g. the terrain, because the total length of the mounding device and base machine is longer than the diameter of the sample plot (about 8 m).
Due to the nested hierarchy of the data (i.e., all regeneration areas within each forest estate were mounded by the same operator), it was not possible to model the effects of the operator or the version of the mounding machine on the quality of mounding. Because the operator is able to adjust continuously the mounding device depending on the operating conditions, the effects of operator experience and training on the quality of mounding should be studied in the future.
Our results indicated that with careful selection of timing and sites, the quality of planting spots obtained with a continuously advancing mounder can be improved. For example, mounding after logging residues have dried increased the number of planting spots by 191 spots ha–1 compared with mounding amongst fresh logging residues. Removing logging residues did not significantly (p = 0.451) increase the number of planting spots compared with mounding amongst dry residues. Operating conditions such as a thick humus layer, very stony soil, steep slopes and valley terrain resulted in about 150–450 fewer planting spots ha–1.
In practice, if a spot mound is unsuitable for planting, the adjoining mineral soil-covered patch produced by the machine may be acceptable as a planting spot. When Rantala et al. (2010) counted both suitable spot mounds and patches, the number of suitable planting spots was 1740 ± 190 spots ha–1. Mounds should be preferred as planting spots because the survival and growth of seedlings planted on the mounds is higher than for seedlings planted beyond the mound (Hallsby and Örlander 2004). In this study, patches were not studied as planting spots.
In the study by Saarinen (2006), the productivity of forwarder-mounted mounders was not improved by slash removal, but the quality of mounding was much better; on average, 82% of planting points were on the top of the mound when logging residues were removed and 62% were on top if residues were not removed. Increasing stoniness was also found to decrease the number of planting spots by Rantala et al. (2010); stoniness affected the quality of spot mounding performed by continuously advancing mounders more than that in excavator-based spot mounding.
In conclusion, the probability of successful mounding by continuously advancing mounders can be increased by careful selection of the operating conditions. Spot mounding is recommended after logging residues have dried or been removed. A thin humus layer, stoneless soil and flat terrain will improve the quality of spot mounding.
References
Äijälä O., Koistinen A., Sved J., Vanhatalo K., Väisänen P. (eds.) (2014). Metsänhoidon suositukset [Forest management recommendations]. Metsätalouden kehittämiskeskus Tapion julkaisuja. 181 p. ISBN 978-952-6612-32-4. [In Finnish].
Andersson G., Brunberg T. (1991). Productivity norms for vehicle-mounted mounders. The Forest Operations Institute of Sweden. Report 4. 28 p. [In Swedish with English summary].
Cajander A.K. (1926). The theory of forest types. Acta Forestalia Fennica 29(3). 108 p. https://doi.org/10.14214/aff.7193.
Hallsby G., Örlander G. (2004). A comparison of mounding and inverting to establish Norway spruce on podzolic soils in Sweden. Forestry 77(2): 107–117. https://doi.org/10.1093/forestry/77.2.107.
Karlsson M., Nilsson U., Örlander G. (2002). Natural regeneration in clear-cuts: effects of scarification, slash removal and clear-cut age. Scandinavian Journal of Forest Research 17(2): 131–138. https://doi.org/10.1080/028275802753626773.
Larsson A. (2011). Val av markbehandlingsmetod inom Sveaskogs innehav i norra Sverige. [Selection of soil scarification method in northern Sweden within Sveaskog AB domains.] Master’s thesis. Swedish University of Agricultural Sciences, Umeå, Sweden. Examensarbeten 2011:9. 31 p. [In Swedish].
Leblanc J.-D. (1990). Evaluation of the Bräcke mounder in the northern clay section. Canadian Forestry Service, Ontario Region. Information Report O-X-402. 29 p.
Löf M., Ersson B.T., Hjältén J., Nordfjell T., Oliet J.A., Willoughby I. (2015). Chapter 5: Site preparation techniques for forest restoration. In: Stanturf J.A. (ed.). Restoration of boreal and temperate forests. 2nd edition. CRC Press. p. 85–102.
Luoranen J., Saksa T., Finér L., Tamminen P. (2007). Metsämaan muokkausopas. [Soil scarification manual for forest lands]. Finnish Forest Research Institute, Vantaa. 75 p. http://urn.fi/URN:ISBN:978-951-40-2059-9. [In Finnish].
McCarthy R., Johansson F., Bergkvist I. (2017). Mounding with three- and four-pointed mattock wheels. Skogforsk, Arbetsrapport nr 925. 24 p. [In Swedish with English summary].
McCulloch C.E., Searle S.R. (2001). Generalized, linear and mixed models. Wiley, New York. 325 p.
Nilsson U., Örlander G. (1995). Effects of regeneration methods on drought damage to newly planted Norway spruce seedlings. Canadian Journal of Forest Research 25(5): 790–802. https://doi.org/10.1139/x95-086.
Örlander G., Nilsson U. (1999). Effect of reforestation methods on pine weevil (Hylobius abietis) damage and seedling survival. Scandinavian Journal of Forest Research 14(4): 341–354. https://doi.org/10.1080/02827589950152665.
Palviainen M., Finér L., Laurén A., Launiainen S., Piirainen S., Mattsson T., Starr M. (2014). Nitrogen, phosphorus, carbon, and suspended solids loads from forest clear-cutting and site preparation: long-term paired catchment studies from Eastern Finland. Ambio 42(2): 218–233. https://doi.org/10.1007/s13280-013-0439-x.
Rantala J., Saarinen V.-M., Hallongren H. (2010). Quality, productivity and costs of spot mounding after slash and stump removal. Scandinavian Journal of Forest Research 25(6): 507–514. https://doi.org/10.1080/02827581.2010.522591.
Saarinen V.-M. (2006). The effects of slash and stump removal on productivity and quality of forest regeneration operations – preliminary results. Biomass & Bioenergy 30(4): 349–356. https://doi.org/10.1016/j.biombioe.2005.07.014.
Saksa T., Heiskanen J., Miina J., Tuomola J., Kolström T. (2005). Multilevel modelling of height growth in young Norway spruce plantations in southern Finland. Silva Fennica 39(1): 143–153. https://doi.org/10.14214/sf.403.
Searle S.R., Casella G., McCulloch C.E. (1992). Variance components. Wiley, New York. 501 p. https://doi.org/10.1002/9780470316856.
Sutherland B.J. (1989). An evaluation of mound formation by the Bräcke mounder in interior British Columbia. Canadian Forestry Service, Ontario Region. Information Report O-X-399. 19 p.
Sutton R.F. (1993). Mounding site preparation: a review of European and North American experience. New Forests 7: 151–192. https://doi.org/10.1007/BF00034198.
Uotila K., Rantala J., Saksa T., Harstela P. (2010). Effect of soil preparation method on economic result of Norway spruce regeneration chain. Silva Fennica 44(3): 511–524. https://doi.org/10.14214/sf.146.
Viro P.J. (1958). Stoniness of forest soil in Finland. Communicationes Instituti Forestalis Fenniae 49(4). 45 p.
Total of 22 references.
