Jukka Malinen  ,
Harri Kilpeläinen,
Erkki Verkasalo
,
Harri Kilpeläinen,
Erkki Verkasalo
Validating the predicted saw log and pulpwood proportions and gross value of Scots pine and Norway spruce harvest at stand level by Most Similar Neighbour analyses and a stem quality database
Malinen J., Kilpeläinen H., Verkasalo E. (2018). Validating the predicted saw log and pulpwood proportions and gross value of Scots pine and Norway spruce harvest at stand level by Most Similar Neighbour analyses and a stem quality database. Silva Fennica vol. 52 no. 4 article id 9972. https://doi.org/10.14214/sf.9972
Highlights
- Non-parametric prediction together with external stem quality database provides predictions usable for pre-harvest assessment at a stand level
- The prediction of Norway spruce assortment recovery and value proved to be more accurate than the predictions for Scots pine
- RMSE and bias of unit prices were 3.50 € m–3 and 0.58 € m–3 for pine and 2.60 € m–3 and 0.35 € m–3 for spruce.
Abstract
Detailed pre-harvest information about the volumes and properties of growing stocks is needed for increased precision in wood procurement planning for just-in-time wood deliveries by cut-to-length (CTL) harvesters. In the study, the non-parametric Most Similar Neighbour (MSN) methodology was evaluated for predicting external quality of Scots pine and Norway spruce, expressed as stem sections fulfilling the saw log dimension and quality requirements of Finnish forest industry, as they affect the recovery of timber assortments and the value of a pre-harvest stand. Effects of external tree quality were evaluated using saw log recovery and saw log reduction caused by stem defects, as well as total timber value (€) and average unit value (€ m–3) in a stand. Root mean square error (RMSE) of saw log recovery and reduction were 9.12 percentile points (pp) for Scots pine and 6.38 pp for Norway spruce stands. In the unit value considerations, the predictions compared with measurements resulted in the RMSE of 3.50 € m–3 and the bias of 0.58 € m–3 in Scots pine stands and 2.60 € m–3, and 0.35 € m–3 in Norway spruce stands, respectively. The presented MSN based approach together with the utilization of the external stem quality database included in the ARVO software could provide dimension and external quality predictions usable for pre-harvest assessment of timber stock at a stand level. This prediction methodology is usable especially in analyses where timber assortment recoveries, values and unit prices are compared when different bucking objectives are used.
Keywords
stem quality;
bucking;
non-parametric prediction;
database;
assortment recovery;
value recovery
-
Malinen,
University of Eastern Finland, School of Forest Sciences, P.O. Box 111, FI-80101 Joensuu, Finland
E-mail
jukka.malinen@uef.fi
- Kilpeläinen, Natural Resources Institute Finland (Luke), Production systems, Yliopistokatu 6, FI-80100 Joensuu, Finland E-mail harri.kilpelainen@luke.fi
- Verkasalo, Natural Resources Institute Finland (Luke), Production systems, Yliopistokatu 6, FI-80100 Joensuu, Finland E-mail erkki.verkasalo@luke.fi
Received 5 March 2018 Accepted 8 November 2018 Published 12 November 2018
Views 108834
Available at https://doi.org/10.14214/sf.9972 | Download PDF

1 Introduction
Detailed pre-harvest information about the volumes and properties of growing stocks is needed for increased precision in wood procurement planning for just-in-time wood deliveries by cut-to-length (CTL) harvesters. These planning processes include stand selection for timber purchasing, harvesting logistics and timing, machinery selection as well as assessment of applicable timber assortments, their relevant unit prices and allocation to different product groups and mills. All information above can be used in calculating the wood paying capability of a growing stock, which is the residual value for the wood raw material after all other costs along the value chain are deducted from the sale values of wood-based products (Jylhä et al. 2010).
Precise information increases planning efficiency in wood procurement. Details of interest can be classified for different tree species from the easiest and most generic to the most specific, depending on the information source, as follows: 1) stand volume, 2) species proportions, 3) size distributions of stems, 4) tapering of stems, 5) external quality indicators of stems and stem parts, and 6) internal quality indicators of stems and stem parts that are derived from the requirements of end uses. Except the internal quality indicators, these are currently observable or measurable non-destructively from the growing stock. In ideal circumstances, all information collected could be entered to a bucking simulator that is capable to produce log size and quality class distributions by timber assortments. The crucial question is about the resources that are available for and worth allocating to pre-harvest evaluation or measurement.
The estimation of forest stand volumes in Nordic countries is currently conducted using airborne laser scanning (ALS) devices and area based approach (ABA), where the forest variables are estimated at plot level utilizing statistical correlations between explanatory variables from ALS data and measured forest stand variables from the reference data (Næsset et al. 2004). Another ALS based approach is to utilize individual tree delineation (ITD) and denser ALS data (Hyyppä and Inkinen 1999). Both approaches are able to estimate the size distributions of trees (Hou et al. 2016). However, the difficulty is to identify tree species directly from ALS measurements (McRoberts et al. 2010; Sanz et al. 2018). This deficiency must be overcome before ALS based methods can be applied more extensively in the wood procurement planning of mixed species forests.
In addition to the data on diameter and tree height, stem tapering is crucial for bucking simulation-based timber assortment recovery calculations. Tapering can be predicted using taper curve models based on ground measurements (Laasasenaho 1982). ALS based stem characteristic estimates (Nakajima et al. 2008) may be used to replace ground measurements needed for taper curve models (Peuhkurinen et al. 2007). Taper curve predictions can be produced also by non-parametric prediction based on previously collected stem databases (Malinen et al. 2001).
The accuracy of the model-based and non-parametric methods is dependent on the accuracy of predictor variables and the validity of modelling data or reference data for the current stand. Terrestrial laser scanning (TLS) is a promising method, but the shadowing effect (occlusion, visibility from the scan location) due to stand structure causes challenges to diameter estimations (Kankare et al. 2016). Moreover, TLS requires stand visits and measurements with a laser scanner, which might come too laborious and expensive for practical operations.
Timber assortment recovery estimates based only on stem dimensions give overestimates for the volumes of timber assortments with specific quality requirements (Malinen et al. 2007). External quality can be assessed by ground-based forest measurements, which are, however, considered too expensive; faster visual observations are considered too inaccurate (Kiviluoma and Uusitalo 1997). ALS could provide a variety of data on canopy structure or single-tree crown properties (Maltamo et al. 2009). However, the estimation of the lowest dead branch height, being often the most important generally accepted external quality character affecting the internal quality of Scots pine (Uusitalo and Kiviluoma 2005), and inclusion of other stem defects are difficult to combine in this way. TLS offers a new approach at least to categorize stems into quality classes (Kankare et al. 2014). However, the use in operational forestry demands more accurate measurements and careful cost considerations.
Non-parametric methods based on data from log measurement equipment at saw mills (Tommola et al. 1999) or CTL harvesters in the forest (Malinen et al. 2001; Holmgren et al. 2012; Barth and Holmgren 2013) could offer a viable solution for predicting detailed timber characteristics of forest stands. Here, the predictor variables could be retrieved from forest management plans completed with field visits or ALS data. As non-parametric methods, at best, are as good as what is the quality of the data, the acquisition of high amount and quality data is crucial. There are some forest inventory data available that are usable for this kind of purposes, such as the data of 16 000 felled trees in Slovakia collected for converting stem volume to timber assortments (Bosela et al. 2016). Moreover, TLS (Kankare et al. 2016) as well as Mobile Laser Scanning (MLS) or Unmanned Aerial Vehicles (UAV) (Jaakkola et al. 2017) may provide adequate reference data in the future.
Malinen et al. (2014) presented a software, Prehas, capable for assessing the amount and value of harvestable timber, including the predictions of timber assortment recoveries, length-diameter distributions of logs and value recovery of timber. It is based on the utilization of previously collected stem data (stm-data) from CTL harvesters, and application of non-parametric k Most Similar Neighbour (k-MSN) method (Moeur and Stage 1995) and computer bucking simulator. ARVO, the Finnish version of the Prehas software, includes also an external stem quality database containing more than 13 000 measured sample trees, which is used as a reference data for non-parametric external quality predictions that are utilized in the bucking simulator (Malinen et al. 2014). The applicability of stem databases, which include stem dimensions, together with non-parametric methods has been proven in previous studies (Malinen et al. 2001; Malinen 2003; Holmgren et al. 2012; Barth and Holmgren 2013), but the usability of extensive external quality database has not been evaluated.
The aim of the study was to evaluate and validate the methodology for predicting external quality of Scots pine and Norway spruce, as they affect the recovery of timber assortments and the value of a pre-harvest stand when using typical quality requirements of the timber assortments used in the Finnish wood procurement. The stem quality database that is provided in the ARVO software includes tree-level information about stem sections which fulfil the quality requirement of saw logs in the Finnish forest industries. The data was processed with a bucking simulator and a non-parametric prediction method (MSN). The evaluation and validation were based on target variables of saw log recovery and saw log reduction due to defects, and total timber values (€) and average unit values (€ m–3) in a stand. Also, the validity of the stem group prediction in the ARVO software was evaluated comparing the predicted growing stock and predicted stem quality against the measured growing stock and measured stem quality. The results of the study present the potential of the methodology, although they are applicable only in the same forest conditions that are present in the database.
2 Material and methods
2.1 Stem quality database
The stem quality database that is utilized in the ARVO software was collected in several research projects at the Finnish Forest Research Institute METLA between 1998 and 2010 (Fig. 1). The major part of the data were gathered for the bucking simulation studies based on measurements on sample trees from circular sample plots in different parts of Finland (e.g., Malinen et al. 2007). The data were amended with new measurements from other forest stands and suitable existing stem data from other studies to construct an extensive stem database. In the stem data, every tree from each plot had been measured and evaluated for the dimensions and quality, paying particular attention to the occurrence and effective lengths of the technical defects in a tree (Table 1). In the ARVO software, external quality of each sample tree was stored as a vertical stem section meeting the quality requirements for saw logs of the Finnish forest industries. The final stem quality database included a total of 12 568 trees of Scots pine (Pinus Sylvestris L.) and Norway spruce (Picea Abies (L.) Karst.) (Table 2).
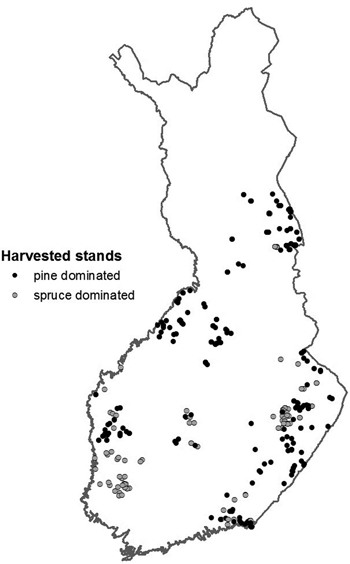
Fig. 1. Locations of Scots pine and Norway spruce dominated study stands used to construct the stem quality database.
| Table 1. List of external defects evaluated on sample trees, stored into stem quality database and used as quality indicators preventing cross cutting of saw log from the respective vertical stem section. | |
| External quality indicator | Definition |
| Surface defects | Scars or checks |
| Decay | Observed decay |
| Dry stem | Dying tree |
| Dead stem | Dead tree |
| Other form defects | Any other defect preventing the use as a saw log |
| Multiple crooks | Multiple curvature or twisting |
| Crooked stem | Sharp curvature due to individual crook |
| Sweep | Even curvature more than 1 cm of deviation per 1 m of length |
| Crown change | Broken main crown and a newly grown crown from one fork |
| Broken crown | Broken main crown |
| Forked stem | Tree with two or more forks |
| Spike knot | Large branch emerging from the trunk at an extremely sharp angle |
| Grouped branches | Distance between branches in a whorl is less than 15 cm |
| Dead knot > 40 mm | Diameter of dead knot exceeding 40 mm |
| Living knot > 50 mm | Diameter of living knot exceeding 50 mm |
| Table 2. Distributions and mean characteristics of harvesting removals of virtual stands in the stem quality database by forest site type (fertility class) based on the data from sample plot measurements. Site types: Oxalis-Myrtillus (OMT), Myrtillus (MT) and combined Vaccinium (VT) and Calluna (CT) types, or corresponding peatland types (Cajander 1926). Mean characteristics with ranges (from minimum to maximum) and standard deviations (in parenthesis) are presented for virtual stands by harvesting type. | |||
| OMT | MT | VT & CT | |
| Tree dominance, number of stands | |||
| Scots pine dominated | 12 | 22 | |
| Norway spruce dominated | 5 | 14 | 1 |
| Harvesting type, number of stands | |||
| Clear cut | 5 | 18 | 5 |
| Thinning | 8 | 17 | |
| Seed tree cutting | 1 | ||
| Number of sample trees | 903 | 6 589 | 5 076 |
| Scots pine | 273 | 3 001 | 4 822 |
| Mean per stand | 46 (3–193;74.0) | 116 (19–258;64.5) | 204 (15–361;86.8) |
| Norway spruce | 630 | 3 588 | 254 |
| Mean per stand | 105 (53–193; 69.0) | 150 (5–451;106.5) | 25 (6–78;21.5) |
| Stems including any external defect, % | 57.6 | 55.0 | 80.0 |
| Scots pine | 89.7 | 73.9 | 81.5 |
| Mean per stand | 75.9 (60.0–100.0; 15.2) | 66.9 (26.6–93.8; 19.4) | 75.6 (17.9–97.5; 22.9) |
| Norway spruce | 43.7 | 39.2 | 39.4 |
| Mean per stand | 35.5 (20.8–57.0; 13.5) | 32.5 (9.3–62.5; 14.8) | 44.6 (11.1–100; 32.5) |
| Mean stand age, a | 91 (71–125; 20.7) | 98 (29–212; 45.2) | 72 (26–139; 31.3) |
| Clear cut or seed tree cutting | 91 (71–125; 20.7) | 113 (74–212; 42.0) | 109 (89–139; 20.2) |
| Thinning | 60 (29–107; 26.3) | 59 (26–114; 23.3) | |
| Mean basal area, m2 ha–1 | 24.3 (20.2–33.6; 5.4) | 16.8 (11.3–24.4; 3.4) | 15.5 (9.8–23.1; 4.0) |
| Clear cut or seed tree cutting | 24.3 (20.2–33.6; 5.4) | 17.6 (11.9–24.4; 3.5) | 19.4 (16.6–23.1; 2.8) |
| Thinning | 15.5 (11.3–19.5; 2.7) | 14.2 (9.8–21.9; 3.5) | |
| Mean dgM, cm (basal area median tree) | 28.8 (28.0–29.8; 0.7) | 23.4 (13.1–29.8; 5.2) | 17.7 (11.8–27.7; 5.5) |
| Clear cut or seed tree cutting | 28.8 (28.0–29.8; 0.7) | 26.4 (23.6–27.7; 1.5) | 26.1 (23.5–27.7; 1.5) |
| Thinning | 16.5 (13.1–21.7; 3.3) | 14.7 (11.8–18.2; 2.4) | |
| Scots pine | 31.5 (28.6–34.8; 2.9) | 25.7 (13.1–33.9; 6.4) | 18.0 (11.8–29.3; 6.1) |
| Clear cut or seed tree cutting | 31.5 (28.6–34.8; 2.9) | 29.4 (24.3–33.9; 2.4) | 27.4 (25.8–29.3; 1.4) |
| Thinning | 17.2 (13.1–22.6; 3.7) | 14.7 (11.8–18.3; 2.3) | |
| Norway spruce | 29.7 (28.1–31.7; 1.4) | 22.8 (9.9–29.0; 5.7) | 19.3 (12.1–34.7; 7.9) |
| Clear cut or seed tree cutting | 29.7 (28.1–31.7; 1.4) | 26.0 (22.9–29.0; 1.6) | 21.8 (16.2–27.1; 4.1) |
| Thinning | 14.5 (9.9–18.1; 3.4) | 17.2 (12.1–34.7; 9.8) | |
At a single tree level, the occurrence and effectiveness of external defects is more or less arbitrary. The essential questions in planning wood procurement are such like how many stems in a stand are affected by the defects and to what extent individual trees suffer from them. Therefore, plotwise data consisting of 10–95 measured sample trees per plot were subjectively re-organized as the stem quality database of virtual stands which mimicked ordinary Finnish forest stands. The requirements for sample plots that belonged to the same virtual stand were i) equal site fertility, ii) equal type of harvesting, iii) near to each other by geographical location and iv) near to each other by stand age (Table 2). Because continuous standwise variables were utilised in the stemwise prediction (Table 3), original values of locations, dominant heights, species proportions in the stand and basal areas on sample plots were left unaltered. In total, 34 Scots pine and 20 Norway spruce dominated virtual stands were created in such a way that each single virtual stand contained 70–724 sample trees.
| Table 3. Predictor and design variables used to predict external quality for reference trees in the ARVO software. If the stand belonged to the specified category, the dummy variable has the value 1, otherwise 0. | ||||||
| Variables | Pine | Spruce | ||||
| Min. | Mean | Max. | Min. | Mean | Max. | |
| Predictor variables | ||||||
| Thinning stand (dummy) | 0.000 | 0.661 | 1.000 | 0.000 | 0.026 | 1.000 |
| Seed tree cutting stand (dummy) | 0.000 | 0.018 | 1.000 | 0.000 | 0.000 | 1.000 |
| OMT fertility type (dummy) | 0.000 | 0.013 | 1.000 | 0.000 | 0.078 | 1.000 |
| MT fertility type (dummy) | 0.000 | 0.382 | 1.000 | 0.000 | 0.443 | 1.000 |
| Peatland (dummy) | 0.000 | 0.108 | 1.000 | 0.000 | 0.056 | 1.000 |
| Stand area, ha (if available) | 0.3 | 0.7 | 9.2 | 0.3 | 2.5 | 9.2 |
| Diameter at breast height dbh, cm | 5.9 | 178.3 | 52.5 | 4.2 | 21.5 | 52.5 |
| Square of dbh, cm | 3481.0 | 38 699.1 | 275 625.0 | 1764.0 | 52 566.5 | 275 625.0 |
| Tree height, m | 2.4 | 15.6 | 32.4 | 2.3 | 18.0 | 33.0 |
| Square of tree height, m | 576.0 | 25 553.0 | 104 976.0 | 529.0 | 36 267.9 | 108 900.0 |
| Latitude, degrees in KKJ coordinates | 60.48865 | 63.77689 | 66.64243 | 60.49 | 62.85 | 66.35 |
| Longitude, degrees in KKJ coordinates | 19.43323 | 27.27441 | 30.98978 | 21.34 | 26.98 | 30.58 |
| Tree age, years | 19.5 | 78.7 | 227.5 | 37 | 111 | 227.5 |
| Dominant height of stand, m | 8.3 | 16.4 | 29.3 | 13.5 | 23.8 | 30.5 |
| Species proportion in stand, % | 2.4 | 87.5 | 100 | 0.1 | 66.6 | 100 |
| Basal area of species, m2 ha–1 | 0.8 | 19.9 | 46.6 | 0.1 | 19.7 | 38.6 |
| Logarithm of basal area of species, m2 ha–1 | –0.3 | 2.7 | 3.8 | –2.3 | 2.8 | 3.6 |
| Logarithm of basal area median diameter (dgM), cm | 2.0 | 2.9 | 3.8 | 2.0 | 3.2 | 3.9 |
| Design variables | ||||||
| Lower limit of crown, m | 0.0 | 8.5 | 22.7 | 0.0 | 5.6 | 20.3 |
| Lower limit of dead branches, m | 0.0 | 2.8 | 20.8 | 0.0 | 1.5 | 20.0 |
| Length of downgraded stem section, m | 0.0 | 4.4 | 28.3 | 0.0 | 9.7 | 26.0 |
| Proportion of downgraded stem section from total tree height, % | 0.0 | 33.8 | 100.0 | 0.0 | 7.5 | 100.0 |
2.2 Non-parametric prediction of external quality
In the bucking simulator of the ARVO software, the external quality for each tree in a pre-harvest stand can be predicted by using the stem quality database and non-parametric prediction. In the method, the most similar tree in the stem quality database is searched for each tree in a pre-harvest (target) stand under consideration, and the quality information of the most similar (reference) tree is generalized to the pre-harvest (target) tree.
The similarity of target and reference trees was confirmed according to the Most Similar Neighbour (MSN) Inference (Moeur and Stage 1995). The similarity function used in the MSN method is a generalized Mahalanobis distance (Mahalanobis 1936). Here, a canonical correlation analysis provides a unified multivariate approach to the computation of the weighting matrix in the distance function, by summarizing the relationship between a set of predictor attributes and a set of design attributes simultaneously. The MSN similarity measure derived from the canonical correlation analysis is:

, where:
D = distance between observations,
Xu = vector of known predictor variables from the uth target observation,
Xj = vector of known predictor variables from the jth reference observation,
Γ = matrix of canonical coefficients of indicator variables,
Λ = diagonal matrix of squared canonical correlation.
In the MSN similarity function, the weighting matrix weights the elements of predictor variables according to their predictive power for all elements of design variables simultaneously, while incorporating the covariance between the elements of design attributes. Table 3 presents the predictor and design variables used to predict the external quality of the pre-harvest target trees in the virtual stands dominated by Scots pine and Norway spruce. The predictor variables describe characteristics of the growing site and tree stock. Crown height and lower limit of dead branches were selected for design variables, as these characteristics have a large influence on the external quality of a tree. Proportions of the saw log section and saw log volume in a single tree describe the availability of saw logs from the stem.
As the most similar reference tree in the stem quality database was selected for the pre-harvest target tree, the lower and upper heights of saw log sections from the reference tree in the stem quality database were scaled to corresponding relative heights of the pre-harvest target tree. This information was used further when all trees in the virtual stands were bucked to logs according to the predicted external quality.
2.3 Evaluation of the predicted external quality
For the evaluation of the external quality prediction, the results were calculated based on both
1) measured dimensions and measured quality of the sample trees, and
2) measured dimensions and predicted quality of the sample trees.
The original plotwise stem quality database was re-organized as virtual standwise data (Chapter 2.1). For the evaluation of the differences in saw log recovery (% of the total timber volume) and reduction due to defects (percentage points from the defect free recovery of saw logs, pp) between the measured and predicted growing stocks in virtual stands, both plotwise and standwise results were calculated.
In the ARVO software, stem group prediction without quality effects is composed by the k-MSN method based on stem database and target stand variables. The external quality for the predicted stem group is composed by the MSN method, predictor variables describing the target pre-harvest stand and stem group prediction. Fig. 2 summarizes how the stem group prediction and databases were used to predict tree stock for a user-defined pre-harvest stand in the ARVO software. In the study, virtual stands with measured dimensions were used to replace the stem group prediction without quality effects, and the stem group prediction with quality effects was replaced by the measured quality or the prediction of external quality. Since the virtual stands were composed of the same stems as the database of the external quality, the predictions of MSN for the stem quality were calculated using a leave-one-out cross-validation technique, where each stem in turn was excluded from the stem database, and the external quality predictions, i.e., lower and upper heights of the saw log sections, were calculated for the stem in the question.
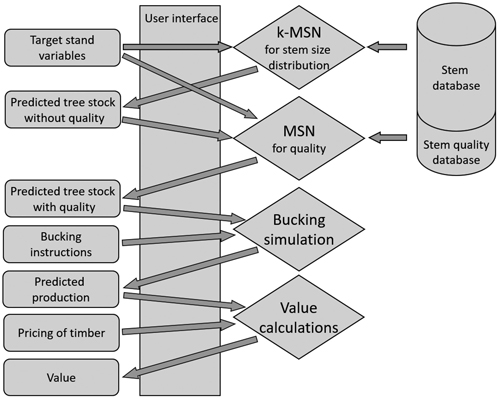
Fig. 2. Schematic illustration of the functions of the ARVO software.
Furthermore, the validity of the ARVO stem group prediction was evaluated comparing the predicted growing stock and predicted stem quality against the measured growing stock and measured stem quality of virtual stands. Target stand variables for the ARVO predictions were calculated according to measured plotwise and standwise data. The stem database used in stem group predictions was based on ARVO’s pre-installed stem database including stm-data from 423 stands throughout Finland (Malinen et al. 2014). The k-MSN method applied in the ARVO tree stock predictions is similar to the MSN method, apart from that k nearest neighbours is selected instead on the nearest neighbour, and the estimates are calculated according to these k nearest neighbours. In the ARVO software, the number of the nearest neighbours (k) is set to 10. For more detailed description of the k-MSN method in the ARVO software, see Malinen et al. (2014).
2.4 Bucking simulation
The dynamic programming-based bucking-to-value simulator developed in the Finnish Forest Research Institute METLA in early 2000’s (Malinen et al. 2006, 2007) was used to divide stems into logs and pulpwood bolts according to predefined timber assortment objectives. The bucking simulator generated cutting alternatives for each stem maximizing the value of stem according to the predefined price matrices. The volumes of different timber assortments in a stem were then calculated according to the pattern of optimal bucking alternative.
In the Prehas and ARVO software, the tapering of the stems in the stem database is derived from the diameters measured by 10 cm intervals by harvester. However, the tapering of the stems in the stem quality database for validation purposes was predicted based on the measured diameter at breast height and tree height, fitting the taper curve for each tree using polynomial taper curve models of Laasasenaho (1982). In the bucking simulation, both the dimensions and external quality of each tree, expressed as vertical stem sections fulfilling saw log quality requirements of the Finnish forest industries, were taken into account. The value relationships between different timber assortments, log lengths and top diameters were given as value matrices in the simulator. The vertical stem parts that contained defects eliminating the use as a saw log were bucked to pulpwood or non-merchantable wood, including jump butts, off-cuts and top-cuts. The stem sections that did not meet the required dimensions of any timber assortments were classified as non-merchantable wood, that is, wood biomass that can be collected for bioenergy or left in the forest.
The bucking objectives used in this study were compatible with the requirements applied for Scots pine and Norway spruce in the MELA analyses of the study by Malinen et al. (2007), hence, the only timber assortments being saw logs and pulpwood. The saw logs were not divided into different log classes according to their dimensions or external quality, which corresponds to the basic bucking practices used in the roundwood trade in Finland (see Luke’s statistical services 2018, for example). Accordingly, the minimum top diameters of saw logs were 14.5 cm for pine and 17.0 cm for spruce, and the lengths of saw logs were fixed at every 0.3 meters between 4.3 and 6.1 meters. The minimum top diameters of pulpwood were 6.3 cm for pine and 6.5 cm for spruce, respectively, the allowable lengths being from 2.0 to 5.5 meters.
The value of the harvested timber was calculated according to the average stumpage prices for standing sales in Finland in May 2017 (Luke’s statistical services 2017). The unit prices in standing sales of pine and spruce logs were 55.0 € m–3 and 57.9 € m–3 (solid over bark), respectively. The respective unit prices of pulpwood were 16.3 € m–3 for pine and 18.1 € m–3 for spruce.
The reliability of the results based on the predicted external quality of trees was measured by using root mean squared error (RMSE) and bias, which were defined as:
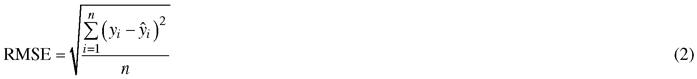

, where n is the number of observations, yi is the measured value in a sample plot or a stand i and ŷi is the predicted value in the sample plot or stand i.
3 Results
3.1 Saw log recovery and saw log reduction
According to the measured dimensions and quality, the mean recovery of saw logs was 42.7% of the total timber volume in the Scots pine stands. The corresponding proportions were 68% in the case of clear cuttings (CC) and 14.3% in the case of thinnings (T). Different external defects decreasing the timber quality were quite common in pine stems, especially in thinning stands (see also Wall et al. 2005). If all stems in pine stands could be cross-cut without saw log reductions due to any defects saw logs would make up of almost two thirds of the total timber volume (62.8%, CC 89.9%, T 31.4%), but the defects decreased the mean saw log recovery by as much as 20.1 percentage points (pp) (CC 21.9 pp, T 18.0 pp). In Norway spruce stands, the mean saw log recovery without saw log reduction was higher than in pine stands, 67.9% (CC 71.8%, T 45.9%), and saw log reduction was 7.1 pp only (CC 6.6 pp, T 9.6 pp), resulting in a clearly higher saw log recovery of 60.8% (CC 65.1%, T 36.2%).
While comparing the measured and predicted stem quality both saw log recovery and saw log reduction provided the same RMSE and bias, since the differences between the predicted and measured saw log recoveries were the same as the corresponding differences in the saw log reductions. When saw log recoveries were predicted for Scots pine plots, RMSE was 14.88 pp (CC 20.10 pp, T 8.98 pp) and bias was –0.65 pp (CC –0.18 pp, T –1.01 pp) (Fig. 3). The corresponding standwise value was notable lower for RMSE (9.12 pp, CC 11.55 pp, T 5.01 pp), albeit higher for bias (–1.52 pp, CC –2.64 pp, T –0.22 pp). When saw log recoveries were predicted for Norway spruce plots, RMSE and bias were 6.02 pp (CC 5.48 pp, T 8.36) and –0.85 pp (CC –0.95 pp, T –0.32 pp), respectively (Fig. 4). The corresponding standwise values were slightly higher both for RMSE (6.38 pp, CC 3.25 pp, T 14.47) and bias (0.90 pp, CC 0.83 pp, T 1.31). As the number of stems per plot was relatively small, in some cases a plot did not include any measured stems with defects that affected bucking, resulting in zero values in the respective Figures.
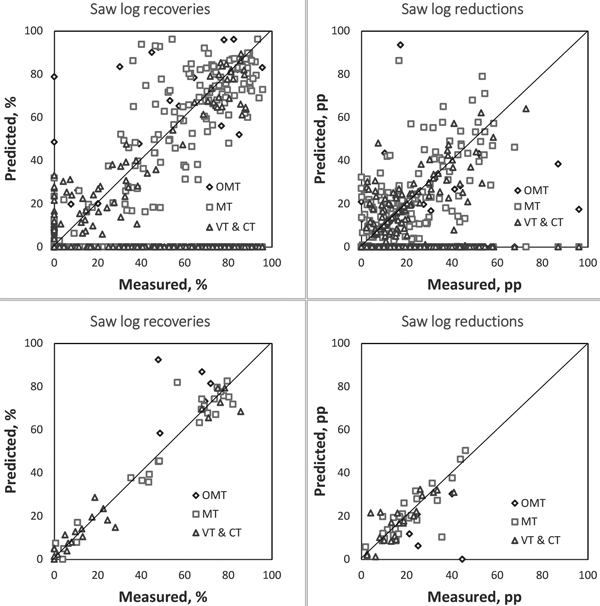
Fig. 3. Saw log recoveries (left) and saw log reductions (right) based on the measured vs. predicted stem quality in Scots pine plots (upper sub-graphs) and stands (lower sub-graphs) by site fertility types. Saw log recoveries are presented as percentages of the total timber volume (%) and saw log reductions are presented as percentage points from the defect free recovery of saw logs (pp).
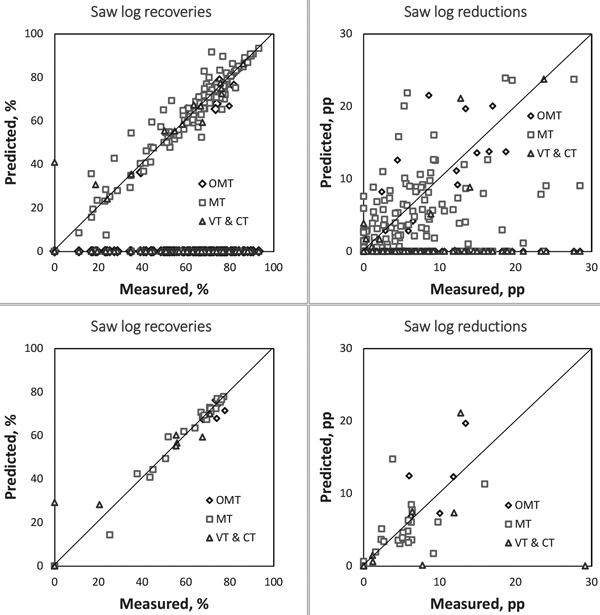
Fig. 4. Saw log recoveries (left) and saw log reductions (right) based on the measured vs. predicted stem quality in Norway spruce plots (upper sub-graphs) and stands (lower sub-graphs) by site fertility types. Saw log recoveries are presented as percentages of the total timber volume (%) and saw log reductions are presented as percentage points from the defect free recovery of saw logs (pp).
3.2 Stand value and unit price of timber
When the selected sample trees in the virtual stands were bucked into different timber assortments according to the measured information on dimensions and quality, the mean value of timber in these stands was 1500.73 € in Scots pine stands and 2564.38 € in Norway spruce stands (Fig. 5). These were calculated as total stand values, because the virtual stands used in the study had no actual land area. Because the saw log recoveries in the spruce stands were higher than those in the pine stands and most of the cuttings in the pine stands were thinnings, the average unit price was remarkably higher in the spruce stands (42.28 € m–3) than in the pine stands (32.66 € m–3).
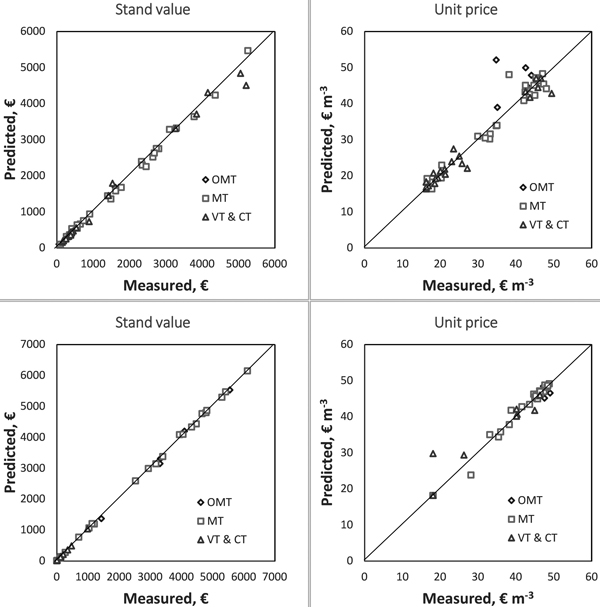
Fig. 5. Stand values (€) (left) and average unit prices (€ m–3) (right) based on the measured vs. predicted stem quality in Scots pine stands (upper sub-graphs) and Norway spruce stands (lower sub-graphs) by site fertility type.
In the value considerations of Scots pine stands, using the predicted quality compared with the measured quality resulted in the RMSE of 132.84 € and the bias of –16.56 €, both of the figures being higher than those for Norway spruce stands, 54.90 € and –7.67 € (Fig. 5). The RMSE and bias regarding the unit price of timber were also slightly higher for pine stands (3.50 € m–3 and 0.58 € m–3) than for spruce stands (2.60 € m–3 and 0.35 € m–3). All in all, the stand values based on the predicted stem quality were very close to those based on the measured stem quality in both pine and spruce stands. The differences in the unit price of timber were generally small between the predicted and measured tree quality approach, except in individual stands of either pine or spruce (Fig. 5).
3.3 ARVO results
To provide a general view of the performance of the ARVO software, a validation was conducted also using the ARVO stem group prediction and external quality prediction with the stem quality database. In Scots pine stands, the RMSE and bias of the saw log recovery calculated using the stem group prediction and estimated stem quality against using only the measured information of the growing stock were 8.60% and 0.08%, respectively (Fig. 6). The corresponding RMSE of the saw log reduction was 10.14 pp and bias was –5.37 pp. The RMSE and bias of the saw log recovery were slightly smaller in the case of the stem group prediction (estimated dimensions and estimated stem quality) than in the case of the estimated stem quality (without the stem group prediction) (RMSE 9.12% and bias –1.52%). However, the RMSE for the saw log reduction was slightly larger (10.14 pp vs. 9.12 pp) and bias was notably larger (–5.37 pp vs. –1.52 pp) in the first case than in the latter case (see also Chapter 3.1).
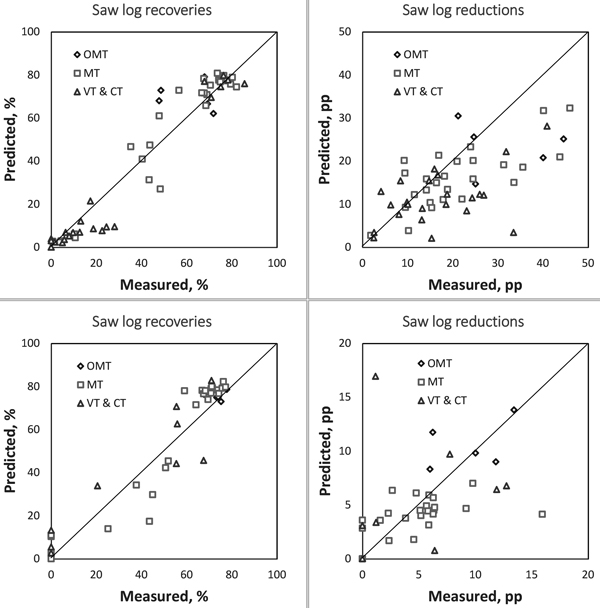
Fig. 6. Saw log recoveries (percentage of the total timber volume, %) (left) and saw log reductions (percentage points, pp) (right) based on the measured vs. predicted information of the growing stock in Scots pine stands (upper sub-graphs) and in Norway spruce stands (lower sub-graphs) by site fertility type.
In Norway spruce stands, both the RMSE and bias of the saw log recovery were larger in the case of the stem group prediction than in the case of the estimated stem quality (10.06% vs. 6.38%, and 2.96 pp vs. 0.90 pp). The RMSE of the saw log reduction was similar in the case of the stem group prediction to the case of the estimated stem quality (without the stem group prediction) (6.13 pp vs. 6.38 pp). The bias was at the same level albeit opposite (–0.95 pp vs. 0.90 pp).
When the stem groups were predicted for Scots pine stands by the ARVO software, the RMSE of the unit price was 3.41 € m–3 and the bias was 0.53 € m–3, compared to the RMSE of 3.50 € m–3 and the bias of 0.58 € m–3 in the case of the estimated stem quality (without the stem group prediction) (Fig. 7). In Norway spruce stands, the RMSE of the unit price was 4.22 € m–3 and the bias was 1.22 € m–3 in the case of the stem group prediction, the figures being remarkably higher than in the case of the estimated stem quality (2.60 € m–3 and 0.35 € m–3).
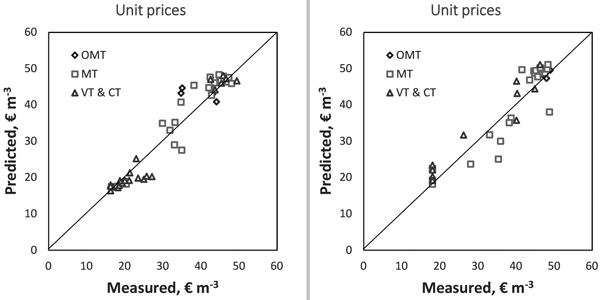
Fig. 7. Average unit prices (€ m–3) based on the measured vs. predicted information of the growing stock in Scots pine stands (left) and in Norway spruce stands (right) by soil fertility type.
4 Discussion
In this study the aim was to evaluate the performance of non-parametric prediction of external stem quality, especially for pre-harvest assessment using bucking simulation. The presented MSN and k-MSN methodologies have been widely studied in the field of forestry (Moeur and Stage 1995; Malinen et al. 2001; Malinen et al. 2006; Maltamo et al. 2006; Packalen and Maltamo 2007), and the software (Prehas and ARVO) including MSN and k-MSN algorithms has been built and distributed free of charge with the stem database collected in Finland (http://www.metla.fi/metinfo/arvo/). The ARVO software includes also a stem quality database utilized to estimate the external stem quality of individual pre-harvest stands. This study provided an assessment of the accuracy of the external stem quality prediction in the bucking simulation; this was not previously analysed.
As common with the non-parametric estimation, the results are applicable only in the forest stands being close in tree stock dimensions and quality to the circumstances where the reference data has been collected. The external stem quality data used in the ARVO software is quite laborious to collect, but new methods for collecting similar data using big data sourced from forest inventories or obtained as by-product of process control in wood harvesting are emerging. In pre-harvest assessment, however, their usability is dependent on the algorithms capable to predict and classify the characteristics under interest (Deng et al. 2016). Therefore, the intention of this study was to introduce the capabilities of nearest neighbour methods in the prediction of external stem quality and timber value.
For the pre-harvest assessment of merchantable timber, a stem group description accurate enough for bucking simulation purposes is needed (Kivinen 2006; Heinimann and Breschan 2012). However, bucking simulations conducted by commercial bucking simulators are typically based only on stem dimensions giving most often large overestimates of valuable timber assortments due to the lack of external quality indicators. It is well known that external quality indicators affecting tree and stand value include tree defects such deviations from straightness or branchiness (Uusitalo and Isotalo 2005; Price et al. 2017).
Since the measurement and estimation of external stem quality is difficult to perform in connection of forest inventory and operations, prediction models for saw log recovery reduction from the theoretical maximum are utilised (Mehtätalo 2002). Malinen et al. (2007) compared saw log reductions calculated by saw log reduction models with those obtained by bucking simulations including measured dimensions and external quality of the stems in forest stands. In that study, RMSE of the saw log recovery reduction of Scots pine calculated in the Mela96 version (Siitonen et al. 1996) was 13.91 percentage points (pp) and the corresponding RMSE calculated in the Mela05 version (Redsven et al. 2005) was 16.16 percentage points (pp), both presented against bucking simulation including dimensions and external quality. In our study, RMSE in the case of external quality prediction with measured stem groups (against the measured information of growing stock) was 9.12 pp, and it was 10.14 pp in the case of external quality prediction with predicted stem groups, hence, notably smaller than in the model-based approaches. For Norway spruce, RMSE of the saw log reduction against bucking simulation was 8.22 pp in Mela96 and 14.1 pp in Mela05 compared to 6.38 pp for the measured stem groups and 6.12 pp for the predicted stem groups in this study. However, especially the models of Mela05 were designed to consider also root rot (Mehtätalo 2002), which bucking simulation based on external quality is incapable to consider. The differences in the results between the MELA05 and ARVO methods are partly due to the different data sets in the saw log reduction models of MELA05 and in the stem quality database of ARVO. The models of MELA05 based on the 8th and 9th National Forest Inventory (NFI) sample trees present typical standing trees over Finland, while the stem quality database of ARVO contains dimension and quality data on harvested trees in selected thinning and final cutting stands in southern, central and southern part of northern Finland.
In the study, leave-one-stem-out cross-validation technique was utilized in predicting external stem quality. However, the most similar neighbouring tree could be retrieved from the same sample plot, which could lead to overly optimistic results if the dimension and quality observations are correlated between trees in the same plot. According to Malinen et al. (2005), sub-regional differences in stem and wood properties of Norway spruce grown in southern Finland are largely insignificant after considering the main effects of tree size, soil type and way of regeneration. Similar results of low between-stand and high within-stand variation were found, for example, by Moore et al. (2013) for Sitka spruce sawn timber properties, Björklund (1999) for Scots pine heartwood properties and Moberg (1999) for Scots pine knot size properties. Site fertility, stand age and silvicultural regime form the basis for the stem and wood properties of a stand, but individual trees are affected by the three-dimensional growing space and competition from other trees (Mitchell 1975; Kocher and Harris 2007), leading to large within-stand and within-plot variations compared to between-stand variations. Consequently, including the trees physically close to the target tree into the analysis has no significant biasing effect on the results of the study other than the finding that trees with same age, grown in similar fertility and silvicultural conditions tend to produce similar quality if the suppression factors of other trees are the same. This was also confirmed in this study by the closer analysis of the neighbouring trees; over 65.8% of the most similar trees used in the prediction came from different plots, although on average, there were over 21 candidate neighbouring trees in the same plot.
In general, the prediction methods for saw log recovery and reduction have limitations when internal defects of stems, such as cracks, checks, abnormal wood or biologically deteriorated wood, are to be considered (Malinen et al. 2003; Verkasalo et al. 2004, 2014; Verkasalo and Kilpeläinen 2004; Hautamäki et al. 2010). In particular, the methods are incapable to consider the effects of decay which is difficult to measure or evaluate. For example, Mattila and Nuutinen (2007) stated that the probability of butt rot damage for Norway spruce increases on fertile sites and in the stands where special or selective cuttings have been carried out. In their study, the average reduction of saw log volume of spruce was 26.3% from which the reduction caused by decay was 3.5%. In our study, where the internal quality was not evaluated, the total saw log reduction of spruce was considerably smaller, 11.7%.
External tree defects have effects on saw log recovery especially in Scots pine thinnings, because a lot of the stems in the thinning removal have crooks, excessive branchiness or other defects. For example, different defects lowered the proportion of saw and small-sized logs of the total recovery from the theoretical maximum of 49% down to 7% in first thinnings and from 65% to 13% in later thinnings (Wall et. al 2005).
The ARVO software includes routines to save the user’s own stm-data collected by harvesters, enabling locally tuned stem databases and providing more accurate bucking results. As a method, the user’s own stm-data and non-parametric k-MSN have been proven to be a flexible and adapting approach to update stem databases continuously (Malinen et al. 2001; Malinen 2003). As non-parametric nearest neighbour methods are as good as the reference data is, the accuracy of the predicted dimensions depends in the end on the data that the user has collected. In addition to the availability and amount of suitable data, estimation errors concerning predictor variables affect the results as well. However, non-parametric prediction of stand characteristics has been found robust against moderate estimate errors unless they are systematic for all predictor variables (Malinen et al. 2001). In our study, the stem group prediction of ARVO did not induce any error in the saw log recovery, reduction or value when Scots pine was considered. For Norway spruce, the RMSE of saw log recovery increased from 6.38% to 10.06%, which was explained solely by the prediction error in stem volume and size distribution generated by the ARVO software.
Although the personnel collecting data on stem dimensions and external quality were highly experienced forest professionals of Finnish Forest Research Institute METLA, the possibility of measurement errors is not excluded. Estimates of breast height diameter and tree height are within the tolerance of measurement devices, but the subjective analysis of stem defects and their effective lengths may vary. However, also in practice, identification of external quality in bucking by the harvester operator is subjective. In this study, the personnel collecting the data had no productive goals and they could use enough time to measure stems and evaluate possible defects, whilst in practice, the harvester head feeds stems to processing with the speed of up to 4 m s–1 and the operator has to observe the quality and make the bucking decision of each stem only in few seconds. Thus, in the given circumstances, the dimension and external quality data in the database is the best possible that could be acquired.
The presented methodology provides the user with opportunities to predict timber assortment recovery in different stands with given bucking objectives, that is, the targeted timber assortments and allowable dimensions. There exists some uncertainty of the accuracy in individual stands, but regardless of that, the ARVO software can be utilized in “what if” analyses considering both dimensions and external quality: what if one timber assortment is added to or removed from bucking objectives, what if allowable dimensions (minimum top diameter, number of diameter classes, acceptable lengths) change, what if unit prices of any timber assortment in the price matrix change.
The bucking simulator of ARVO software is capable to buck stems into logs using bucking-to-value approach, that is, maximize the value of stems by given product values through price matrices. In practice, many cut-to-length harvesters utilize bucking-to-demand approach, where, in addition to value maximization, log length-diameter distribution is steered towards desired output. The prediction of length-diameter distribution through bucking simulation is nevertheless difficult (Ovaskainen 2002); therefore, bucking-to-demand is not used in the ARVO software. Bucking-to-demand approach can affect timber assortment recoveries (Tikkanen et al. 2009), but the magnitude can be controlled using adaptation percentages. According to Santamäki (2017), the decrease in saw log recovery from the maximum was at the most 1.97 pp for Scots pine and 2.34 pp for Norway spruce, respectively, when the adaptation percentage was increased from 0% to 10%.
In this study, bucking simulator was utilized in the analysis of bucking outcome, but the effect of a harvester operator on saw log recovery was not considered. The productivity of individual harvester operators varies considerably according to their age and work experience (Malinen et al. 2018). This may also affect their observations and considerations of stem defects, hence, the recovery of timber assortments and value (Murphy 2003), especially at the fast operating speeds of CTL harvesters (Carey and Murphy 2005). The optimization of the most valuable timber assortments, where targets of high quality do apply, is mainly the responsibility of a harvester operator, stressing the impact of the variability in competence and attitude between individual operators.
As a conclusion, the presented MSN based approach together with the utilization of the external stem quality database included in the ARVO software could provide dimension and external quality predictions usable for pre-harvest assessment of timber stock at a stand level. As it is typical for non-parametric prediction, the results show no systematic bias. The ability to include variance considerations in the prediction is the strength of non-parametric methodology, as it showed up in this study as well. However, the methodology introduces some errors compared with average predictions in model-based approaches. The general performance of the presented methodology is anyway at a good level. This prediction methodology is usable especially in conditional analyses where timber assortment recovery, value and unit price considerations should be done thoughtfully in individual forest stands. In the future, the approach could be used with open databases, cloud services and big data produced by new measuring technology of forest mensuration or in connection of stem bucking with CTL harvesters.
References
Barth A., Holmgren J. (2013). Stem taper estimates based on airborne laser scanning and cut-to-length harvester measurements for pre-harvest planning. International Journal of Forest Engineering 24(3): 161–169. https://doi.org/10.1080/14942119.2013.858911.
Björklund L. (1999). Identifying heartwood-rich stands or stems of Pinus sylvestris by using inventory data. Silva Fennica 33(2): 119–129. https://doi.org/10.14214/sf.662.
Bosela M., Redmond J., Kučera M., Marin G., Adolt R., Gschwantner T., Petráš R., Korhonen K., Kuliešis A., Kulbokas G., Fischer C., Lanz A. (2016). Stem quality assessment in European National Forest Inventories: an opportunity for harmonised reporting? Annals of Forest Science 73(3): 635–648. https://doi.org/10.1007/s13595-015-0503-8.
Cajander A.K. (1926). The theory of forest types. Acta Forestalia Fennica 29. 108 p. https://doi.org/10.14214/aff.7193.
Carey P.B., Murphy G.E. (2005). Mechanised versus manual log-making in two Chilean Pinus radiata stands. New Zealand Journal of Forestsry Science 35(1): 25–34.
Deng Z., Zhu X., Cheng D., Zong M., Zhang S. (2016). Efficient kNN classification algorith for big data. Neurocomputing 195: 143–148. https://doi.org/10.1016/j.neucom.2015.08.112.
Hautamäki S., Kilpeläinen H., Kannisto K., Wall T., Verkasalo E. (2010). Factors affecting the appearance quality and visual strength grade distributions of Scots pine and Norway spruce sawn timber in Finland and north-western Russia. Baltic Forestry 16(2): 217–234.
Heinimann H.R., Breschan J. (2012). Pre-harvest assessment based on LiDAR data. Croatian Journal of Forest Engineering 33(2): 169–180.
Holmgren J., Barth A., Larsson H., Olsson H. (2012). Prediction of stem attributes by combining airborne laser scanning and measurements from harvesters. Silva Fennica 46(2): 227–239. https://doi.org/10.14214/sf.56.
Hou Z., Xu Q., Vauhkonen J., Maltamo M., Tokola T. (2016). Species-specific combination and calibration between area-based and tree-based diameter distributions using airborne laser scanning. Canadian Journal of Forest Research 46(6): 753–765. https://doi.org/10.1139/cjfr-2016-0032.
Hyyppä J., Inkinen M. (1999). Detecting and estimating attributes for single trees using laser scanning. The photogrammetric Journal of Finland 16(2): 27–42.
Jaakkola A., Hyyppä J., Yu X., Kukko A., Kaartinen H., Liang X., Hyyppä H., Wang Y. (2017). Autonomous collection of forest field reference – the outlook and a first step with UAV laser scanning. Remote sensing 9(8): 785. https://doi.org/10.3390/rs9080785.
Jylhä P., Dahl O., Laitila J., Kärhä K. (2010). The effect of suppply system on the wood paying capability of a kraft pulp mill using Scots pine harvester from first thinnings. Silva Fennica 44(4): 695–714. https://doi.org/10.14214/sf.454.
Kankare V., Joensuu M., Vauhkonen J., Holopainen M., Tanhuanpää T., Vastaranta M., Hyyppä J., Hyyppä H., Alho P., Rikala J., Sipi M. (2014). Estimation of the timber quality of Scots pine with terrestrial laser scanning. Forests 5(8): 1032–1052. https://doi.org/10.3390/f5081879.
Kankare V., Puttonen E., Holopainen M., Hyyppä J. (2016). The effect of TLS point cloud sampling on three detection and diameter measurement accuracy. Remote Sensing Letters 7(5): 495–502. https://doi.org/10.1080/2150704X.2016.1157639.
Kiviluoma P., Uusitalo J. (1997). Männyn kuivaoksa- ja latvusrajan silmävaraisen arvioinnin tarkkuus. [The accuracy of visual observation of the dead branch and crown heights for Scots pine]. Metsätieteen aikakauskirja – Folia Forestalia 4/1997: 505–512. https://doi.org/10.14214/ma.6236.
Kivinen V.-P. (2006). A forest-level genetic algorithm based control system for generating stand-specific log demand distributions. Canadian Journal of Forest Research 36(7): 1705–1722. https://doi.org/10.1139/x06-055.
Kocher S.D., Harris R. (2007). Tree growth and competition. University of California, Forest Stewardship Series 5, publication 8235.
Laasasenaho J. (1982). Taper curve and volume functions for pine, spruce and birch. Communicationes Instituti Forestalis Fenniae 108. 74 p. http://urn.fi/URN:ISBN:951-40-0589-9.
Luke’s statistical services (2017). Natural Resources Institute Finland (Luke). Volumes and prices in industrial roundwood trade. http://stat.luke.fi/en/volumes-and-prices-roundwood-trade. [Cited 5 July 2017].
Luke’s statistical services (2018). Natural Resources Institute Finland (Luke). Volumes and prices in industrial roundwood trade. http://stat.luke.fi/en/volumes-and-prices-roundwood-trade. [Cited 14 Auqust 2018].
Mahalanobis P.C. (1936). On the generalized distance in statistics. Proceedings of National Institute of Sciences (India) 2: 49–55.
Malinen J. (2003). Locally adaptable non-parametric methods for estimating stand characteristics for wood procurement planning. Silva Fennica 37(1): 109–120. https://doi.org/10.14214/sf.514.
Malinen J., Maltamo M., Harstela P. (2001). Application of most similar neighbour inference for estimating marked stand characteristics using harvester and inventory generated stem databases. International Journal of Forest Engineering 12(2): 33–41. https://doi.org/10.1080/14942119.2001.10702444.
Malinen J., Maltamo M., Verkasalo E. (2003). Predicting the internal quality and value of Norway spruce trees. Forest Product Journal 53(4): 85–94.
Malinen J., Maltamo M., Verkasalo E. (2005). Stem and wood properties of Norway spruce on drained peatlands and mineral forest lands in Southern Finland. Baltic Forestry 11(1): 21–37.
Malinen J., Kilpeläinen H., Wall T., Verkasalo E. (2006). Variation in the value recovery when bucking to alternative timber assortments and log dimensions. Forestry studies 45: 89–100.
Malinen J., Kilpeläinen H., Piira T., Redsven V., Wall T., Nuutinen T. (2007). Comparing model-based and bucking simulation based approaches in the prediction of timber assortment recovery. Forestry 80(3): 309–321. https://doi.org/10.1093/forestry/cpm012.
Malinen J., Kilpeläinen H., Ylisirniö K. (2014). Description and evaluation of the Prehas software for pre-harvest assessment of timber assortments. International Journal of Forest Engineering 25(1): 66–74. https://doi.org/10.1080/14942119.2014.902686.
Malinen J., Taskinen J., Tolppa T. (2018). Productivity of cut-to-length harvesting by operators’ age and experience. Croatian Journal of Forest Engineering 39(1): 15–22.
Maltamo M., Malinen J., Packalén P., Suvanto A., Kangas J. (2006). Nonparametric estimation of stem volume using airborne laser scanning, aerial photography, and stand-register data. Canadian Journal of Forest Research 36(2): 426–436. https://doi.org/10.1139/x05-246.
Maltamo M., Peuhkurinen J., Malinen J., Vauhkonen J., Packalén P., Tokola T. (2009). Predicting tree attributes and quality characteristics of Scots pine using airborne laser scanning data. Silva Fennica 43(3): 507–521. https://doi.org/10.14214/sf.203.
Mattila U., Nuutinen T. (2007). Assessing the incidence of butt rot in Norway spruce in southern Finland. Silva Fennica 41(1): 29–43. https://doi.org/10.14214/sf.473.
McRoberts R.E., Tomppo E.O., Næsset E. (2010). Advances and emerging issues in national forest inventories. Scandinavian Journal of Forest Research 25(4): 368–381. https://doi.org/10.1080/02827581.2010.496739.
Mehtätalo L. (2002). Valtakunnalliset puukohtaiset tukkivähennysmallit männylle, kuuselle, koivuille ja haavalle. [National tree-level saw log reduction models for pine, spruce, birch and aspen]. Metsätieteen aikakauskirja 4/2002: 575–591. https://doi.org/10.14214/ma.6196.
Mitchell K.J. (1975). Dynamics and simulated yield of Douglas-fir. Forest Science Monographs 17. 39 p.
Moberg L. 1999. Variation in knot size of Pinus sylvestris in two initial spacing trials. Silva Fennica 33(2): 131–144. https://doi.org/10.14214/sf.663.
Moeur M., Stage A.R. (1995). Most similar neighbour: an improved sampling inference procedure for natural resource planning. Forest Science 41(2): 337–359.
Moore J.R., Lyon A.J., Searles G.J., Lehneke S.A., Ridley-Ellis D.J. (2013). Within- and between-stand variation in selected properties of Sitka spruce sawn timber in the UK: implications for segregation and grade recovery. Annals of Forest Science 70(4): 403–415. https://doi.org/10.1007/s13595-013-0275-y.
Murphy G. (2003). Mechanization and value recovery: worldwide experiences. In: Proceedicngs of the Wood for Africa Forest Engineering Conference, July 2002, Pietermaritzburg, South Africa. p. 23–32.
Nakajima T., Hirata Y., Hiroshima T., Furuya N., Tatsuhara S. (2008). An analysis of the relationships between tree growth and crown information derived from airborne LiDAR data. Proceedings of SilviLaser 2008: 8th International Conference on LiDAR Applications in Forest Assessment and Inventory, September 17–19, 2008, Heriot-Watt University, Edinburgh, UK. p. 105–112.
Næsset E., Gobakken T., Holmgren J., Hyyppä H., Hyyppä J., Maltamo M., Nilsson M., Olsson H., Persson Å., Söderman U. (2004). Laser scanning of forest resources: the nordic experience. Scandinavian Journal of Forest Research 19(6): 482–499. https://doi.org/10.1080/02827580410019553.
Ovaskainen H. (2002). Apteeraussimulaattoreiden tiedostojen yhteensopivuus ja simulaattoreiden katkontatulosten vertailu. [Bucking simulators, compatibility of files and comparison of bucking outcomes.] Unpublished research report, University of Joensuu. 26 p.
Packalén P., Maltamo M. (2007). The k-MSN method for the prediction of species-specific stand attributes using airborne laser scanning and aerial photographs. Remote Sensing of Environment 109(3): 328–341. https://doi.org/10.1016/j.rse.2007.01.005.
Peuhkurinen J., Maltamo M., Malinen J., Pitkänen J., Packalén P. (2007). Pre-harvest measurement of marked stand using airborne laser scanning. Forest Science 53(6): 653–661.
Price A., Hapca A., Gardiner B., Macdonald E., Mclean P. (2017). Assessing the stem straightness of trees. Forestry Commission, Technical Note. 6 p.
Redsven V., Anola-Pukkila A., Haara A., Hirvelä H., Härkönen K., Kettunen L., Kiiskinen A., Kärkkäinen L., Lampinen R., Muinonen E., Nuutinen T., Salminen O., Siitonen M. (2005). MELA2005 Reference Manual. The Finnish Forest Research Institute. 621 p. http://mela2.metla.fi/mela/julkaisut/oppaat/mela2005.pdf.
Santamäki S. (2017). Arvomatriisin adaptiivisuusprosentin vaikutus katkontatulokseen jakauma-apteerauksessa. [The effect of adaptation percentage to bucking outcome when utilizing bucking-to-demand approach]. Bachelor’s thesis, University of Eastern Finland. 32 p.
Sanz B., Malinen J., Leppänen V., Valbuena R., Kauranne T., Tokola T. (2018). Valuation of growing stock by multisource GIS data, stem quality database and bucking simulation. Canadian Journal of Forest Research 48(8): 888–897. https://doi.org/10.1139/cjfr-2017-0172.
Siitonen M., Härkönen K., Hirvelä H., Jämsä J., Kilpeläinen H., Salminen O., Teuri M. (1996). MELA Handbook – 1996 Edition. The Finnish Forest Research Institute, Research Papers 622. 455 p. http://urn.fi/URN:ISBN:951-40-1543-6.
Tikkanen L., Ovaskainen H., Palander T. (2009). Adaptive tree bucking using group-guiding of harvesters: a simulation approach. Scandinavian Journal of Forest Research 24(3): 258–263. https://doi.org/10.1080/02827580902932811.
Tommola M., Tynkkynen M., Lemmetty J., Harstela P., Sikanen L. (1999). Estimating the characteristics of a marked stand using k-nearest-neighbor regression. Journal of Forest Engineering 10(2): 75–81.
Uusitalo J., Isotalo J. (2005). Predicting knottiness of Pinus sylvestris for use in tree bucking procedures. Scandinavian Journal of Forest Research 20(6): 521–533. https://doi.org/10.1080/02827580500407109.
Verkasalo E., Kilpeläinen H. (2004). Saw timber recovery and selected physical and mechanical properties of wood from Scots pine on drained peatlands in Finland. In: Päivänen J. (ed.). Proceedings of the 12th International Peat Congress “Wise Use of Peatlands”. Volume 1. Oral presentations. Tampere, Finland. 6–11 June 2004. International Peat Society. p. 521–530.
Verkasalo E., Sairanen P., Kilpeläinen H., Maltamo M. (2004). Modelling the end-use based value of Norway spruce trees and logs by using predictors of stand and tree levels. In: Nepveu G. (ed.). IUFRO WP S5.01-04 Fourth Workshop “Connection between Forest Resources and Wood Quality: Modelling Approaches and Simulation Software”, Harrison Hot Springs, British Columbia, Canada, September 8–15, 2002. IUFRO WP S5.01-04. Proceedings. Publication LERFoB/2004. INRA-ENGREF, Nancy-France. p. 474–488.
Verkasalo E., Kilpeläinen H., Ihalainen A., Ropponen T. (2014). Wood processing properties of plantation-grown Norway spruce for saw milling in Finland. In: Petutschnigg A., Barbu M.C. (eds.). Processing Technologies for the Forest and Biobased Product Industries. PTF BPI 2014 at the Salzburg University of Applied Sciences Kuchl/Austria. p. 50–57.
Wall T., Fröblom J., Kilpeläinen H, Lindblad J., Heikkilä A., Song T., Stöd R., Verkasalo E. (2005). Harvennusmännyn hankinnan ja sahauksen kehittäminen. WOOD WISDOM -tutkimusohjelman hankekonsortion loppuraportti. [Development of procurement and sawmilling of Scots pine from thinnings. Final report of the joint-research consortium in the Wood Wisdom Research Programme 1998–2001]. The Finnish Forest Research Institute, Research Papers 943: 129 p. + appendix 13 p. ISBN 951-40-1977-6.
Total of 57 references.
