Ninni Saarinen  ,
Joanne C. White,
Michael A. Wulder,
Annika Kangas,
Sakari Tuominen,
Ville Kankare,
Markus Holopainen,
Juha Hyyppä,
Mikko Vastaranta
,
Joanne C. White,
Michael A. Wulder,
Annika Kangas,
Sakari Tuominen,
Ville Kankare,
Markus Holopainen,
Juha Hyyppä,
Mikko Vastaranta
Landsat archive holdings for Finland: opportunities for forest monitoring
Saarinen N., White J. C., Wulder M. A., Kangas A., Tuominen S., Kankare V., Holopainen M., Hyyppä J., Vastaranta M. (2018). Landsat archive holdings for Finland: opportunities for forest monitoring. Silva Fennica vol. 52 no. 3 article id 9986. https://doi.org/10.14214/sf.9986
Highlights
- The 45-year Landsat archive contained 30 076 images for Finland by December 31, 2017
- 16.3% of these were acquired within ±30 days of August 1 (northern hemisphere summer), have <70% cloud cover, and a 30 m spatial resolution
- Using time series analyses, these data provide unique information that complements other datasets available for forest monitoring and assessment in Finland.
Abstract
There is growing interest in the use of Landsat data to enable forest monitoring over large areas. Free and open data access combined with high performance computing have enabled new approaches to Landsat data analysis that use the best observation for any given pixel to generate an annual, cloud-free, gap-free, surface reflectance image composite. Finland has a long history of incorporating Landsat data into its National Forest Inventory to produce forest information in the form of thematic maps and small area statistics on a variety of forest attributes. Herein we explore the spatial and temporal characteristics of the Landsat archive in the context of forest monitoring in Finland. The United States Geological Survey Landsat archive holds a total of 30 076 images (1972–2017) for 66 scenes (each 185 km by 185 km in size) representing the terrestrial area of Finland, of which 93.6% were acquired since 1984 with a spatial resolution of 30 m. Approximately 16.3% of the archived images have desired compositing characteristics (acquired within August 1 ±30 days, <70% cloud cover, 30 m spatial resolution). Data from the Landsat archive can augment forest monitoring efforts in Finland, provide new information for science and applications, and enable retrospective, systematic analyses to characterize the development of Finnish forests over the past three decades. The capacity to monitor trends based upon this multi-decadal record with the addition of new measurements is of benefit to multisource inventories and offers nationally comprehensive spatially-explicit datasets for a wide range of stakeholders and applications.
Keywords
National Forest Inventory;
satellite;
Landsat time series
-
Saarinen,
Department of Forest Sciences, University of Helsinki, P.O. Box 27, FI-00014 University of Helsinki, Finland; School of Forest Sciences, University of Eastern Finland, P.O. Box 111, FI-80101 Joensuu, Finland
 https://orcid.org/0000-0003-2730-8892
E-mail
ninni.saarinen@helsinki.fi
https://orcid.org/0000-0003-2730-8892
E-mail
ninni.saarinen@helsinki.fi
-
White,
Department of Forest Sciences, University of Helsinki, P.O. Box 27, FI-00014 University of Helsinki, Finland; Canadian Forest Service, (Pacific Forestry Center), Natural Resources Canada, 506 West Burnside Road, Victoria, BC, V8Z 1M5, Canada
http://orcid.org/0000-0003-4674-0373
E-mail
joanne.white@canada.ca
-
Wulder,
Canadian Forest Service, (Pacific Forestry Center), Natural Resources Canada, 506 West Burnside Road, Victoria, BC, V8Z 1M5, Canada
https://orcid.org/0000-0002-6942-1896
E-mail
mike.wulder@canada.ca
- Kangas, Natural Resources Institute Finland (Luke), Bioeconomy and environment, Yliopistokatu 6, FI-80100 Joensuu, Finland E-mail annika.kangas@luke.fi
- Tuominen, Natural Resources Institute Finland (Luke), Bioeconomy and environment, Latokartanonkaari 9, FI-00790 Helsinki, Finland E-mail sakari.tuominen@luke.fi
- Kankare, Department of Forest Sciences, University of Helsinki, P.O. Box 27, FI-00014 University of Helsinki, Finland E-mail ville.kankare@helsinki.fi
- Holopainen, Department of Forest Sciences, University of Helsinki, P.O. Box 27, FI-00014 University of Helsinki, Finland E-mail markus.holopainen@helsinki.fi
- Hyyppä, Department of Remote Sensing and Photogrammetry, Finnish Geospatial Research Institute, National Land Survey of Finland, Geodeetinrinne 2, FI-02431 Masala, Finland E-mail juha.hyyppa@nls.fi
-
Vastaranta,
School of Forest Sciences, University of Eastern Finland, P.O. Box 111, FI-80101 Joensuu, Finland
https://orcid.org/0000-0001-6552-9122
E-mail
mikko.vastaranta@uef.fi
Received 28 March 2018 Accepted 13 June 2018 Published 15 June 2018
Views 101726
Available at https://doi.org/10.14214/sf.9986 | Download PDF

1 Introduction
The Landsat program has been acquiring data of the Earth’s surface since 1972, and since 1982 the data has been acquired at a spatial resolution of 30 m. The Landsat program hitherto utilized three 30-m sensors: Landsat Thematic Mapper (TM; Landsats 4 and 5), Enhanced Thematic Mapper Plus (ETM+; Landsat 7), and Operational Land Imager (OLI; Landsat 8). Data from the Multi-Spectral Scanner (MSS) sensor is available with a 60 m spatial resolution. In 2008, all newly acquired and archived Landsat images in the United States Geological Survey (USGS) archive were made freely and openly available (Woodcock et al. 2008), advancing the accessibility of all countries to use Landsat data to generate information relevant for science, policy, and reporting needs (Wulder et al. 2012). The spectral and spatial properties of Landsat make it particularly useful for forest monitoring (Cohen and Goward 2005) and the advent of time series analyses has further strengthened this capacity (Banskota et al. 2014). The spatial and temporal nature of the Landsat archive is not uniform globally, and not all acquired data is found within the central archive. Through the Landsat Global Archive Consolidation initiative, the USGS and International Cooperators have combined to ensure all previously acquired data, downloaded and stored regionally, are added to the central archive (Wulder et al. 2016).
The generation of image composites with Landsat time series (LTS) has become increasingly common (Hansen and Loveland 2012). Compositing approaches use a rule-based approach to select from available observation for any given pixel, generally determined from within a desired temporal window to address seasonality and to meet specified information needs (Griffiths et al. 2013; White et al. 2014). These best-available-pixel (BAP) composites overcome issues resulting from clouds, haze, and related shadows, which can otherwise prevent assembly of an annually representative coverage of imagery. Moreover, a frequent LTS data allows for the generation of proxy pixel values in years when there is no best observation for a given pixel (i.e. filling data gaps; Hermosilla et al. 2015). The result is a cloud-free, gap-free, wall-to-wall, annual surface reflectance BAP composite. Consecutively, a stack of these annual BAP composites, representing several decades, may be used for time series analyses (Zhu 2017), supporting the characterization of forest disturbance and recovery over vast areas (Senf et al. 2017; White et al. 2017).
International forest monitoring programs and agreements related to climate change require national-level information about forest resources. The Finnish National Forest Inventory (NFI) has been providing information on Finland’s forests since the 1920s (Tomppo et al. 2010; Kangas et al. 2018). The NFI is based on statistical sampling of field measurements including characteristics related to forest health and biodiversity, along with traditional forest inventory attributes. Information provided by the NFI is used as the basis for national and regional-level strategic forest-planning scenarios for timber procurement, harvests, and silvicultural treatments, as well as for estimating forest carbon budgets and assessing the sustainability of forest management.
Based on the need to obtain reliable forest resource information for areas smaller than would be achievable with NFI field data only, the development of multisource-NFI (MS-NFI) started in 1989. In the MS-NFI, Landsat data (also Sentinel and SPOT imagery) are used together with digital maps and measurements from NFI field plots for producing wall-to-wall thematic maps of forest attributes and municipal-level forest statistics. Although estimates of the MS-NFI and NFI (based on field plots only) are similar at the regional level, the prediction error at the level of individual pixel is generally relatively high (Tomppo et al. 2014; Tuominen et al. 2017). As the methods used to generate the MS-NFI are under continuous development (Tomppo et al. 2008) and the attributes have not been predicted using consistent approach, the comparability between thematic maps at pixel or stand level from different MS-NFIs can be challenging.
Detailed spatial and temporal analyses of the Landsat archive for specific applications are uncommon, particularly for areas outside North America (White and Wulder 2013). Moreover, the capacity of the Landsat archive to retrospectively support the development of a historic record of forest change and analyses in the context of forest monitoring information needs in northern European boreal forests has heretofore not been documented. To better understand the development and impacts of natural disturbances and management activities on Finnish forests through time, spatially-explicit forest change information is required. The Landsat program provides a valuable long-term record for science and applications. However, the comprehensiveness of the Landsat archive for Finland has not yet been documented and the potential of LTS for spatially-explicit forest monitoring in Finland remains to be determined. Therefore, the aim of this study was to investigate the spatial and temporal extensiveness of the USGS Landsat archive for the support of long-term forest monitoring in Finland.
2 Data and methods
Metadata for all images acquired since the beginning of the Landsat program in 1972 until December 31, 2017 and held in the USGS Landsat archive were downloaded. Metadata were provided separately for Landsats 1–3 (MSS), Landsats 4–5 (MSS and TM), Landsat 7 (ETM+), and Landsat 8 (OLI). All Landsat metadata for Landsat 4–5 TM, Landsat 7 ETM+, Landsat 8 OLI and Pre-Collection metadata for Landsat 1–5 MSS are available at https://landsat.usgs.gov/landsat-bulk-metadata-service. In this analysis, we included the unique scene identification number, sensor, acquisition date, Worldwide Reference System (WRS) path and row, as well as percent cloud coverage from the metadata. The WRS is the reference system used to partition the Earth into Landsat scenes, each with dimensions of 185 km × 185 km; Landsats 1–3 used WRS-1 whereas Landsat 4 and subsequent Landsat satellites have used WRS-2. The number of images acquired is analogous to the number of observations for each scene.
Landsat imagery acquired within ±30 days of August 1 (northern hemisphere summer; Julian date 213) has been considered suitable for BAP compositing and forest monitoring (Griffiths et al. 2013; White and Wulder 2013; White et al. 2014; Hermosilla et al. 2015). Based upon similar seasonality and expectation of peak photosynthesis mid-summer, the temporal distribution of images was analyzed within this time window to characterize the potential of the Landsat archive holdings for forest monitoring purposes. Furthermore, MSS era images were excluded from these analyses because of the current challenges in incorporating the different spatial and spectral properties of these data into time series analyses (Pflugmacher et al. 2012; Braaten et al. 2015). Thus, we have only included the images acquired from 1984 onwards for forest monitoring purposes. Additionally, a threshold for cloud cover was set to 70% based on previous studies (Griffiths et al. 2013; White and Wulder 2013). The 70% maximum cloud cover is selected to ensure some minimum level of clear pixels and sufficient ground visibility to aid in geometric rectification procedures (White et al. 2014). Our analyses also incorporated the regional variability of the Landsat archive suitable for BAP compositing and forest monitoring (i.e. a compositing window of August 1 ±30 days and cloud cover <70%), by characterizing archive holdings for the 13 Public Service Units of the Finnish Forest Centre.
We calculated the average number of images per scene and per year currently in the archive (as of December 31, 2017) meeting the BAP compositing criteria. These numbers were then summed in the overlapping areas between scenes, to demonstrate the theoretical impact on observation yield resulting from Landsat scene overlap. To demonstrate the realized potential of the archive for image compositing, we created annual BAP composites for a 5.3 Mha area (representing 11 unique WRS-2 path/rows) in southern Finland for 1984–2017 following the approach described in White et al. (2014) and Hermosilla et al. (2016). We then calculated the total number of observations (i.e. the number of years with clear pixels used in the composites). As a result, we demonstrate the theoretical impact of Landsat scene overlap on the generation of BAP image composites in Finland.
3 Results
As of December 31, 2017, there were a total of 30 076 images in the Landsat data archive of Finland. Most of the images were acquired with the TM (42.8%) and ETM+ (31.8%) sensors (combined 74.6%), followed by OLI (19.1%) and MSS (6.4%) (Fig. 1). The distribution of available data through time is not consistent: the number of images is limited prior to 1984 and for 1991–1993, and 1995–1997. More than two-thirds (68.5%) of the archived images were acquired after the launch of Landsat-7 ETM+, enabled by a systematic long-term acquisition plan (Arvidson et al. 2001). Image acquisitions increased markedly with the launch of Landsat 8 (OLI) in February 2013; after only 5 years of operation, OLI data represent 20% of the archived holdings for Finland. Moreover, the annual rate at which OLI has accrued data in the archive since 2013 is more than double that of TM and ETM+ (Fig. 1).
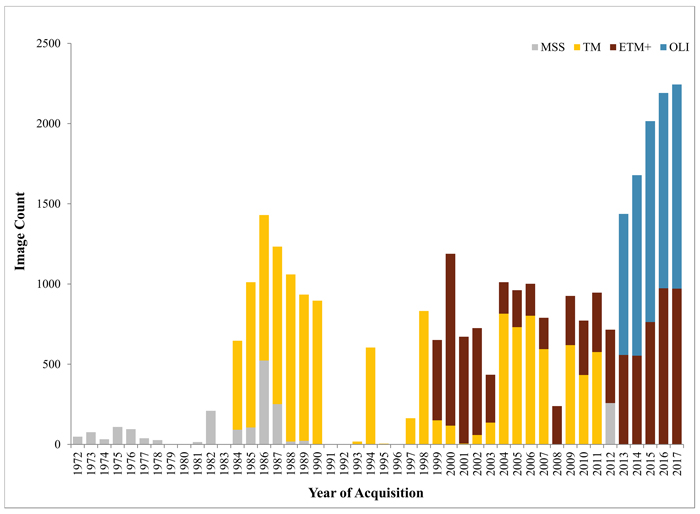
Fig.1. Total number of archived Landsat images acquired for Finland, by year and sensor. MSS = Multi-Spectral Scanner, TM = Thematic Mapper, ETM+ = Enhanced Thematic Mapper Plus, and OLI = Operational Land Imager.
The total number of archived Landsat images for Finland acquired within ±30 days of August 1 (Julian date 213) was 8901, of which 8121 images (or 27.0% of the total archive holdings) were acquired with a sensor other than MSS (Fig. 2A). For the BAP compositing scenario (i.e. August 1 ±30 days with <70% cloud cover) there were 4897 images from TM, ETM+, and OLI, representing 16.3% of the total archive holdings (Fig. 2B).
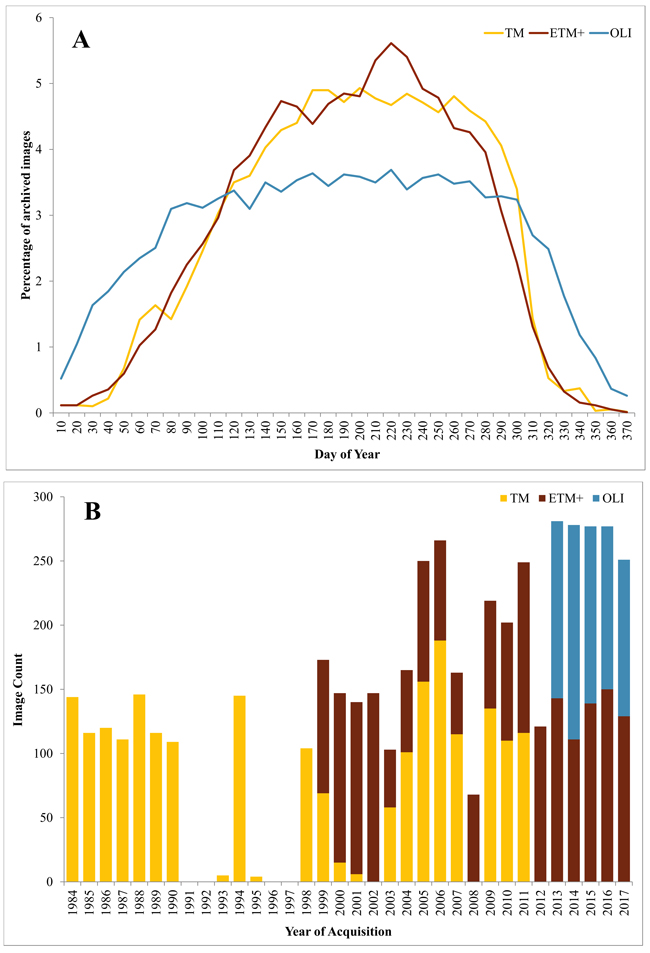
Fig. 2. Percentage of all archived Landsat images acquired for Finland and their acquisition day of year (A) as well as number of archived Landsat images acquired for Finland within ±30 days from the target day of year (August 1) and with cloud cover < 70%, by year and sensor (B). MSS = Multi-Spectral Scanner, TM = Thematic Mapper, ETM+ = Enhanced Thematic Mapper Plus, and OLI = Operational Land Imager..
All the Public Service Units of the Finnish Forest Centre, with exception of Lapland, have a minimum of 76 images per Landsat scene acquired since 1984 meeting the BAP compositing criteria, corresponding 72.3% of the land area of Finland (Fig. 3). The Southwest Finland and Åland regions have the greatest number of archived Landsat images per scene (>100).
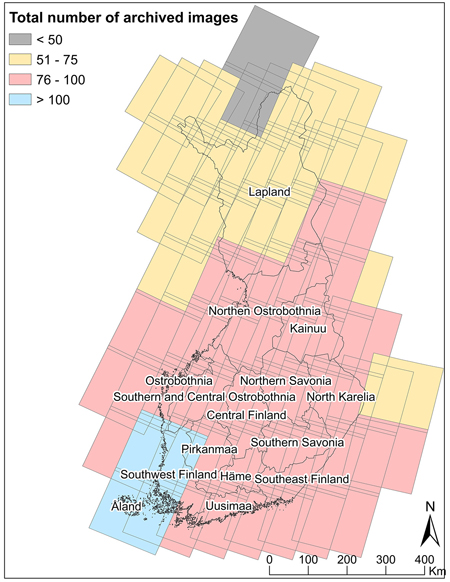
Fig. 3. Total number of images (1984–2017) for WRS-2 Landsat scenes covering Finland that were acquired within ±30 days from the target day of year (August 1) and <70% cloud cover, by Public Service Units of the Finnish Forest Centre.
The mean number of archived images per year was greater in overlap areas between adjacent scenes (Fig. 4A). Increased observational density in overlap areas further enables BAP compositing approaches, as these areas will have more potential observations for BAP compositing. This potential for increase observations is realized when composites are generated, as shown in Fig. 4B representing annual BAP composites generated for 1984–2017. Overlap areas have more images per year and more years with observations in the final BAP composites.
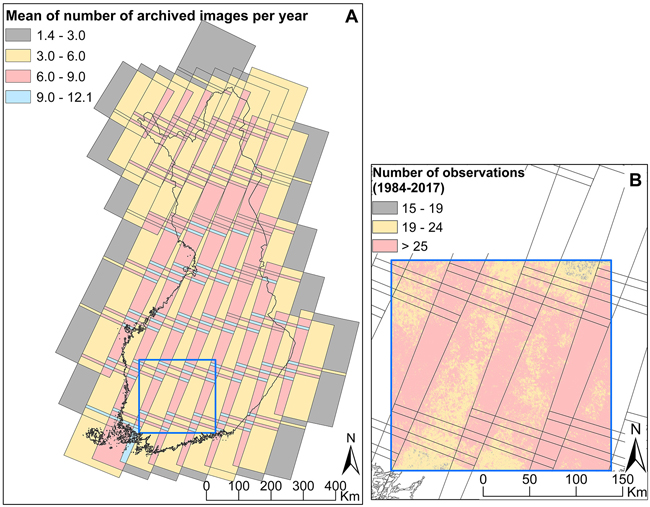
Fig. 4. Mean number of images (1984–2017) per year for WRS-2 Landsat scenes covering Finland that were acquired within ±30 days from the target day of year (August 1) and with <70% cloud cover (A). Realized number of observations (i.e. number of years with clear pixels for compositing) from best-available pixel (BAP) composites (1984–2017) for a sample area in southern Finland (B).
4 Discussion
LTS offer a unique opportunity for long-term forest monitoring. Although the archive holdings for Finland are not as extensive as for North America (Wulder et al. 2016), they do provide possibilities for increasing knowledge about development of Finnish forests both spatially and temporally. The NFI has provided statistics about Finnish forests since the 1920s, and MS-NFI from the early 1990s. However, the thematic maps between different MS-NFIs are not comparable thus, direct change detection using them is challenging. Utilization of LTS could therefore enhance spatially-explicit and retrospective analyses for explorations of changes in land use (i.e. forested area) to support greenhouse gas reporting, for example. However, if detailed information about the amount of removed wood is of interest, data from field measurements would be required.
The 1980s and 1990s represented a period of instability in the Landsat program, with Landsat data priced for cost recovery by NOAA, and programmatic control of Landsats 4 and 5 (and development of Landsat 6) transferred from the United States government (NOAA) to the private sector (EOSAT) from 1985 until 2001. Simultaneously, costs for Landsat data increased dramatically and demand fell. The Landsat archive holdings suffered most significantly during this time. In the absence of a long-term acquisition plan, and faced with substantial data downlink costs, acquisitions became increasingly US-centric and were demand-driven (Goward et al. 2017). Although International Cooperators continued to downlink data, they were also applying the same cost-recovery model as EOSAT, with a similar data pricing structure. Faced with significant funding shortfalls from the US Government, EOSAT ceased processing Landsat data by the end of 1992 and did not resume processing until 1994. The MS-NFI was first introduced during the eighth NFI (carried out between 1986 and 1994). Concurrently, the coverage of the Landsat archive in Finland is very limited, particularly for 1991–1997 (except for 1994).
Despite spatial gaps in archive holdings, overlap between adjacent scenes ensures adequate spatial and temporal coverage to enable BAP compositing (Griffiths et al. 2013; White et al. 2014). Furthermore, approaches for change detection, among others (Hermosilla et al. 2016; Zhu 2017), enable a spatially-explicit historic record of forest change to be constructed from the LTS, which can enhance the characterization of the development of Finnish forests over time. Consequently, estimates of harvested or burned areas can be identified as well as when land use class from forest has changed. In addition to the capture and documentation of forest disturbances, LTS surface reflectance values have demonstrated utility for monitoring and quantification of vegetation recovery following fire and harvest (White et al. 2017). As assessments of forest recovery using field plots are typically spatially and temporally constrained (Bartels et al. 2016), the capacity to assess both disturbance and recovery over large areas with LTS data can augment plot-based analyses with both temporally and spatially exhaustive information on recovery.
The “always on” status of OLI has resulted in an increase in the number and seasonal distribution of images for Finland. This increased data collection offers enhanced possibilities for the future of forest monitoring (i.e. from annual to within year BAPs). Moreover, the relatively short turnaround time between acquisition and availability of the images in the Landsat archive as analysis ready data enables the development of near-real time applications (Zhu and Woodcock 2014). However, the strength of LTS is long-term forest monitoring with the unique time frame of observations.
In combination with Sentinel-2 satellites, acquiring data with similar characteristics to OLI data and are being made openly and freely available (Li and Roy 2017), compositing algorithms can become more robust, buttressing the complementary role of optical satellite imagery to expand support Finnish forest monitoring activities. Due to spatial and spectral complementarity between Landsat and Sentinel-2 (Drusch et al. 2012), and given progress towards cross-calibration of these data (Zhang et al. 2018), Landsat archival imagery can provide a baseline against which trends derived from Sentinel-2 observations can be compared (Wulder et al. 2015, 2018). Moreover, synergies between Landsat and Sentinel-2 provide opportunities for shorter revisit times and improve the likelihood of cloud-free observations to support compositing approaches (Li and Roy 2017).
5 Conclusions
Global coverage of Landsat data has fluctuated over time due to logistical and programmatic factors. The USGS Landsat archive holdings for Finland represent more than three-decades of data acquired since 1984 with a 30 m spatial resolution. These archive holdings are sufficiently dense to support the development of annual image composites that can consecutively be used for long-term forest monitoring. Retrospectively, these data provide a useful source of baseline information for forest monitoring in the context of climate change, and moreover, could support a broad suite of information needs and scientific applications, such as spatially-explicit investigations of changes in forest connectivity and composition over time, and variation in regional trends in forest recovery. These data complement the dense network of NFI field plots and provide new information for forest monitoring at regional and national levels.
Acknowledgements
This research was undertaken with support from the Academy of Finland through the Centre of Excellence in Laser Scanning Research (project number 272195) and the ‘Earth Observation to Inform Canada’s Climate Change Agenda (EO3C)’ project jointly funded by the Canadian Space Agency (CSA), Government Related Initiatives (GRI) program, and the Canadian Forest Service (CFS) of Natural Resources Canada. T. Hermosilla and G. Hobart are thanked for acquiring the Landsat data and processing the annual best-available pixel and proxy (BAP) image composites used in the example shown in Fig. 4B.
References
Arvidson T., Gasch J., Goward S.N. (2001). Landsat 7’s long-term acquisition plan – an innovative approach to building a global imagery archive. Remote Sensing of Environment 78(1–2): 13–26. https://doi.org/10.1016/S0034-4257(01)00263-2.
Banskota A., Kayastha N., Falkowski M.J., Wulder M.A., Froese R.E., White J.C. (2014). Forest monitoring using Landsat time series data: a review. Canadian Journal of Remote Sensing 40(5): 362–384. https://doi.org/10.1080/07038992.2014.987376.
Bartels S.F., Chen H.Y.H., Wulder M.A., White J.C. (2016). Trends in post-disturbance recovery rates of Canada’s forests following wildfire and harvest. Forest Ecology and Management 361: 194–207. https://doi.org/10.1016/j.foreco.2015.11.015.
Braaten J.D., Cohen W.B., Yang Z. (2015). Automated cloud and cloud shadow identification in Landsat MSS imagery for temperate ecosystems. Remote Sensing of Environment 169: 128–138. https://doi.org/10.1016/j.rse.2015.08.006.
Cohen W.B., Goward S.N. (2004). Landsat’s role in ecological applications of remote sensing. BioScience 54(6): 535–545. https://doi.org/10.1641/0006-3568(2004)054[0535:LRIEAO]2.0.CO;2.
Drusch M., Del Bello U., Carlier S., Colin O., Fernandez V., Gascon F., Hoersch B., Isola C., Laberinti P., Martimort P. (2012). Sentinel-2: ESA’s optical high-resolution mission for GMES operational services. Remote Sensing of Environment 120: 25–36. https://doi.org/10.1016/j.rse.2011.11.026.
Goward S.M., Williams D.L., Arvidson T., Rochchio L.E.P., Irons J.R., Russel C.A., Johnston S.S. (2017). Landsat’s enduring legacy: pioneering global land observations from space. American Society for Photogrammetry and Remote Sensing, Bethesda, Maryland. 586 p. ISBN 1-57083-101-7.
Griffiths P., van der Linden S., Kuemmerle T., Hostert P. (2013). A pixel-based Landsat compositing algorithm for large area land cover monitoring. IEEE Journal of Selected Topics in Applied Earth Observations and Remote Sensing 6(5): 2088–2101. https://doi.org/10.1109/JSTARS.2012.2228167.
Hansen M.C., Loveland T.R. (2012). A review of large area monitoring of land cover change using Landsat data. Remote Sensing of Environment 122: 66–74. https://doi.org/10.1016/j.rse.2011.08.024.
Hermosilla T., Wulder M.A., White J.C., Coops N.C., Hobart G.W. (2015). Regional detection, characterization, and attribution of annual forest change from 1984 to 2012 using Landsat-derived time-series metrics. Remote Sensing of Environment 170: 121–132. https://doi.org/10.1016/j.rse.2015.09.004.
Hermosilla T., Wulder M.A., White J.C., Coops N.C., Hobart G.W., Campbell L.B. (2016). Mass data processing of time series Landsat imagery: pixels to data products. International Journal of Digital Earth 9(11): 1035–1054. https://doi.org/10.1080/17538947.2016.1187673.
Kangas A., Astrup R., Breidenbach J., Fridman J., Gobakken T., Korhonen K.T., Maltamo M., Nilsson M., Nord-Larsen T., Næsset E., Olsson H. (2018). Remote sensing and forest inventories in Nordic countries – roadmap for the future. Scandinavian Journal of Forest Research 33(4): 397–412. https://doi.org/10.1080/02827581.2017.1416666.
Li J., Roy D.P. (2017). A global analysis of Sentinel-2A, Sentinel-2B and Landsat-8 data revisit intervals and implications for terrestrial monitoring. Remote Sensing 9(9): 902. https://doi.org/10.3390/rs9090902.
Pflugmacher D., Cohen W.B., Kennedy R.E. (2012). Using Landsat-derived disturbance history (1972–2010) to predict current forest structure. Remote Sensing of Environment 122: 146–165. https://doi.org/10.1016/j.rse.2011.09.025.
Senf C., Pflugmacher D., Hostert P., Seidl R. (2017). Using Landsat time series for characterizing forest disturbance dynamics in the coupled human and natural systems of Central Europe. ISPRS Journal of Photogrammetry and Remote Sensing 130: 453–463. https://doi.org/10.1016/j.isprsjprs.2017.07.004.
Tomppo E., Haakana M., Katila M., Peräsaari J. (2008). Combining national forest inventory field plots and remote sensing data for forest databases. Remote Sensing of Environment 112(5): 1982–1999. https://doi.org/10.1016/j.rse.2007.03.032.
Tomppo E., Gschwantner T., Lawrence M., McRoberts R.E. (2010). National forest inventories – pathways for common reporting. Springer. 612 p. ISBN 978-90-481-3232-4.
Tomppo E., Katila M., Mäkisara K., Peräsaari J. (2014). The multi-source national forest inventory of Finland – methods and results 2011. Working Paper of the Finnish Forest Research Institute 319. http://urn.fi/URN:ISBN:978-951-40-2516-7. [Cited 12 Feb 2018].
Tuominen S., Pitkänen T., Balázs A., Kangas A. (2017). Improving Finnish multi-source national forest inventory by 3D aerial imaging. Silva Fennica 51(4) article 7743. https://doi.org/10.14214/sf.7743.
White J.C., Wulder M.A. (2013). The Landsat observation record of Canada: 1972 – 2012. Canadian Journal of Remote Sensing 39(6): 455–467. https://doi.org/10.5589/m13-053.
White J.C., Wulder M.A., Hobart G.W., Luther J.E., Hermosilla T., Griffiths P., Coops N.N., Hall R.J., Hoster P., Dyk A., Guindon L. (2014). Pixel-based image compositing for large-area dense time series applications and science. Canadian Journal of Remote Sensing 40(3): 192–212. https://doi.org/10.1080/07038992.2014.945827.
White J.C., Wulder M.A., Hermosilla T., Coops N.C., Hobart G.W. (2017). A nationwide annual characterization of 25 years of forest disturbance and recovery for Canada using Landsat time series. Remote Sensing of Environment 194(1): 303–321. https://doi.org/10.1016/j.rse.2017.03.035.
Woodcock C.E., Allen R., Anderson M., Belward A., Bindschadler R., Cohen W., Gao F., Goward S.N., Helder D., Helmer E., Nemani R., Oreopoulos L., Schott J., Thenkabail P.S., Vermote E.F., Vogelmann J., Wulder M.A., Wynne R. (2008). Free access to Landsat imagery. Science 320(5879): 1011. https://doi.org/10.1126/science.320.5879.1011a.
Wulder M.A., Masek J.G., Cohen W.B., Loveland T.R., Woodcock C.E. (2012). Opening the archive: how free data has enabled the science and monitoring promise of Landsat. Remote Sensing of Environment 122: 2–10. https://doi.org/10.1016/j.rse.2012.01.010.
Wulder M.A., Hilker T., White J.C., Coops N.C., Masek J.G., Pflugmacher D., Crevier Y. (2015). Virtual constellations for global terrestrial monitoring. Remote Sensing of Environment 170: 62–76. https://doi.org/10.1016/j.rse.2015.09.001.
Wulder M.A., White J.C., Loveland T.R., Woodcock C.E., Belward A.S., Cohen W.B., Fosnight E.A., Shaw J., Masek J.G., Roy D.P. (2016). The global Landsat archive: status, consolidation, and direction. Remote Sensing of Environment 185: 271–283. https://doi.org/10.1016/j.rse.2015.11.032.
Wulder M.A., Coops N.C., Roy D.P., White J.C., Hermosilla T. (2018). Land cover 2.0. International Journal of Remote Sensing 39(12): 4254–4284. https://doi.org/10.1080/01431161.2018.1452075.
Zhang H.K., Roy D.P., Yan L., Li Z., Huang H., Vermote E., Skakun S., Roger J.-C. (2018). Characterization of Sentinel-2A Landsat-8 Top of atmosphere, surface, and nadir BRDF sdjusted, reflectance and NDVI differences. Remote Sensing of Environment, in Press. https://doi.org/10.1016/j.rse.2018.04.031.
Zhu Z. (2017). Change detection using Landsat time series: a review of frequencies, preprocessing, algorithms, and applications. ISPRS Journal of Photogrammetry and Remote Sensing 130: 370–384. https://doi.org/10.1016/j.isprsjprs.2017.06.013.
Zhu Z., Woodcock C.E. (2014). Continuous change detection and classification of land cover using all available Landsat data. Remote Sensing of Environment 144: 152–171. https://doi.org/10.1016/j.rse.2014.01.011.
Total of 30 references.
