Mulualem Tigabu  ,
Mostafa Farhadi,
Lars-Göran Stener,
Per C. Odén
,
Mostafa Farhadi,
Lars-Göran Stener,
Per C. Odén
Visible + Near Infrared Spectroscopy as taxonomic tool for identifying birch species
Tigabu M., Farhadi M., Stener L.-G., Odén P. C. (2018). Visible + Near Infrared Spectroscopy as taxonomic tool for identifying birch species. Silva Fennica vol. 52 no. 4 article id 9996. https://doi.org/10.14214/sf.9996
Highlights
- Multivariate modelling of visible + near infrared (NIR) reflectance spectra of single seeds distinguished Betula pubescens and B. pendula with 100% and 99% accuracy, respectively
- The results demonstrate the feasibility of NIR spectroscopy as taxonomic tool for classification of species that have morphological resemblance.
Abstract
The genus Betula L. is composed of several species, which are difficult to distinguish in the field on the basis of morphological traits. The aim of this study was to evaluate the taxonomic importance of using visible + near infrared (Vis + NIR) spectra of single seeds for differentiating Betula pendula Roth and Betula pubescens Ehrh. Seeds from several families (controlled crossings of known parent trees) of each species were used and Vis + NIR reflectance spectra were obtained from single seeds. Multivariate discriminant models were developed by Orthogonal Projections to Latent Structures – Discriminant Analysis (OPLS-DA). The OPLS-DA model fitted on Vis + NIR spectra recognized B. pubescens with 100% classification accuracy while the prediction accuracy of class membership for B. pendula was 99%. However, the discriminant models fitted on NIR spectra alone resulted in 100% classification accuracies for both species. Absorption bands accounted for distinguishing between birch species were attributed to differences in color and chemical composition, presumably polysaccharides, proteins and fatty acids, of the seeds. In conclusion, the results demonstrate the feasibility of NIR spectroscopy as taxonomic tool for classification of species that have morphological resemblance.
Keywords
Betula;
silver birch;
downy birch;
seeds;
NIRS;
OPLS;
multivariate modelling
-
Tigabu,
Swedish University of Agricultural Sciences, Southern Swedish Forest Research Centre, Box 49, SE-230 52 Alnarp, Sweden
E-mail
mulualem.tigabu@slu.se
- Farhadi, Swedish University of Agricultural Sciences, Southern Swedish Forest Research Centre, Box 49, SE-230 52 Alnarp, Sweden E-mail mostafa.farhadi@gmail.com
- Stener, The Forestry Research Institute of Sweden, Ekebo 2250, SE-268 90 Svalöv, Sweden E-mail lars-goran.stener@skogforsk.se
- Odén, Swedish University of Agricultural Sciences, Southern Swedish Forest Research Centre, Box 49, SE-230 52 Alnarp, Sweden E-mail per.christer.oden@slu.se
Received 30 April 2018 Accepted 25 September 2018 Published 18 October 2018
Views 69329
Available at https://doi.org/10.14214/sf.9996 | Download PDF

1 Introduction
The genus Betula L., commonly known as birch, is composed of several species and natural interspecific hybrids, which are distributed throughout the northern temperate and boreal ecosystems (Atkinson 1992). They are light-demanding pioneer species that can establish in early successional phase following clear-cuttings and gaps created by fire owing to their vigorous seed production and fast juvenile growth capacities (Fischer et al. 2002). They also serve as nurse-trees for other late-successional species with more economic traits (Renou-Wilson et al. 2010). The two most commercially important birch species in northern Europe are silver birch (Betula pendula Roth) and downy birch (Betula pubescens Ehrh.), accounting, for example, 11% of the total growing stock in Sweden and 17% in Finland (Hynynen et al. 2010). Although both species are valuable as raw material for pulp and for mechanical wood-manufacturing, silver birch is preferred for planting owing to its higher yield.
There is a large regional variation among the two birch species. For instance, downy birch dominates in the northern parts of Sweden, while they often form mixed stands of variable proportions, depending on the site conditions, in central and southern Sweden. Morphological differences, such as occurrence of resin granules and hair on young twigs, and bark structure on the lower trunk, leaf shape and branch orientation on older trees (Fries 1964), are the most used methods for differentiation of the two species. However, there are often individuals showing intermediate characteristics and the species may also hybridize, making the differentiation in field unreliable. Previously, several studies have been made to differentiate among birch species based on leaf traits (Atkinson and Codling 1986); phenolic contents in the bark (Lundgren et al. 1995), leaves (Keinänen et al. 1999; Laitinen et al. 2005; Raal et al. 2015) and chemical composition of bud exudates (Isidorov et al. 2014). Atkinson et al. (1997) evaluated the feasibility of using near infrared (NIR) spectroscopy to separate Betula pendula, Betula pubescens and their hybrids based on leaf samples. As the authors admitted, the concentration of chemical compounds in a sample of dried and ground leaves from a tree can be influenced by several factors, including the partial shading of the tree, the weather conditions during growth, the site quality, the state of senescence, and the activities of leaf predators. As a result, the NIR spectra of several samples of a given species may vary considerably as absorbance is a function of concentration and hence disturbing the model stability. On the contrary, reproductive structures, such as fruits and/or seeds, are less susceptible to changes due to growth conditions.
Seed mixtures of birch from various stands are many times used for establishing field trials aiming at studies of yield or stem quality among specific birch species. Plant material from such seed can also be used in the first step of the breeding process where individual birch trees are tested in field aiming at selection of the most well performing trees. There is a large variation among individuals in morphological characteristics, which makes differentiation between seed trees of B. pendula and B. pubescens unreliable. Thus, to avoid mistakes that may result in wrong conclusions and other costly consequences, it would be beneficial to have a method that for sure could distinguish seed from the different birch species. Thus, the aim of this study was to evaluate the potential of single seed visible (Vis) and Near Infrared (NIR) spectroscopy as a rapid and non-destructive technique for differentiating the two birch species, B. pendula and B. pubescens. Near infrared spectroscopy is a versatile analytical technique that can detect and measure chemical compounds and moisture in biological samples based on absorption of near infrared radiation by bonds between light atoms (C – H, O – H and N – H). The molecular bond vibration yields overtones and combination bands that are detectable in the 780–2500 nm wavelength region (Workman and Weyer 2012). The technique has demonstrated and confirmed its strength in identification of biological samples, such as authentication of Picea abies (L.) Karst. seed provenances (Farhadi et al. 2017), parental identification of Pinus sylvestris L. (Tigabu et al. 2005), authentication of origin of olive oil (Bevilacqua et al. 2012) and pistachio (Vitale et al. 2013) and identification of the parental species Larix decidua Mill. and L. kaempferi (Lamb.) Carrière from their hybrid, L. × eurolepis Herny (Farhadi et al. 2016). To our knowledge, no attempt has been made to differentiate birch species based on single seed Vis + NIR spectra. Reliable identification of the species is of great concern in practical tree breeding since the two species are supposed to be treated separately. Identification of seeds is also important to ensure consistency in planting of the desired species, particularly when open-pollinated seeds from stands are used as seed sources (at least in Sweden).
2 Methods and materials
2.1 Seed samples
Seeds of B. pendula and B. pubescens were obtained from a clonal archive of the Swedish Forest Research Institute at Ekebo, Sweden. Seeds were produced by controlled crossings of known maternal and paternal parents in year 2000 for B. pubescens and in 2009/2010 for B. pendula. The samples were kept in a freezer at –4 °C until the study was conducted. The parental material were all selected as plus-trees from stands in southern Sweden and Finland, to be used for long-termed breeding, and were at that time (1989–1991) differentiated among the two species by morphological characters. The B. pubescens parents were later on also checked by chemical markers using phenolic bark contents (Lundgren et al. 1995). For this study, seeds were sampled from 15 and 13 families of B. pubescens and B. pendula, respectively due to limited availability. From each family, 50 seeds were randomly drawn as a working sub-sample. Thus, a total of 750 seeds for B. pubescens and 650 seeds for B. pendula were used for Vis + NIR spectroscopic analysis.
2.2 Sample presentation and collection of NIR spectra
Single seed reflectance spectra were collected with XDS Rapid Content Analyzer (FOSS NIRSystems, Inc., Hilleroed, Denmark) from 400 to 2498 nm at 0.5 nm resolution. Individual seeds were directly placed at the center of the scanning glass window of the instrument with 9 mm aperture at stationary module and then covered with the instrument’s lid that had black background. Prior to collecting single seed reflectance spectra, reference measurement was acquired on standard built-in reference of the instrument. To reduce the effects of possible instrumental drift during scanning, reference measurements were also taken after every 20 scans. For every seed, 32 scans were made and the average value recorded. The spectral data were then exported from Vision Software (FOSS NIRSytems, Inc. VISION 3.5) as NSAS file and imported into Simca-P+ software (Version 13.0.0.0, Umetrics AB, Sweden) for developing multivariate discriminant models.
2.3 Multivariate discriminant modelling
Prior to modelling, Principal Component Analysis (PCA) was performed to get an overview of the raw spectral data set. The PCA revealed four strong outliers that fell outside the 95% confidence interval, which were removed from the final data set (Table 1). The outliers were insect-damaged seeds that had reflectance values well below the average reflectance values of the other seeds. Families were randomly divided into two groups, and one group used for developing the calibration model and the other was kept aside for validation of the fitted calibration model. The calibration set was composed of seeds from 10 families of B. pubescens (n = 497 seeds) and 8 families of B. pendula (n = 399 seeds). The validation set was composed of seeds from five families that were randomly selected and excluded during model fitting (n = 250 seeds for each species). Multivariate discriminant models were derived by Orthogonal Projection to Latent Structures-Discriminant Analysis (OPLS-DA) using corrected absorbance values as regressor and a Y-matrix of dummy variables (1.0 for member of a given class, 0.0 otherwise) as regressand. The OPLS-DA modelling approach integrates both spectral filtering and subsequent modeling steps. The spectral filtering step in OPLS-DA removes more general types of interferences in the spectra by removing components orthogonal to the response variable calibrated against (Trygg and Wold 2003). Components orthogonal to the response variable containing unwanted systematic variation are then subtracted from the original spectral data to produce a filtered descriptor matrix. The final discriminant models were then computed using the filtered spectra in the visible + NIR, visible and NIR regions.
| Table 1. Data sets used for developing discriminant model to distinguish seeds of two birch species (Betula spp.), together with number of families included in each species, total number of seeds per species, validation sets and number of outliers excluded during model development. | ||
| Data sets | Betula pubescens | Betula pendula |
| No. of families | 15 | 13 |
| Total No. seeds | 750 | 650 |
| Calibration set | 497 | 399 |
| External test set* | 250 | 250 |
| Outliers | 3 | 1 |
| * External test set is composed of samples from five families that were not part of the calibration model. | ||
All calibrations were developed on mean-centered data sets and the number of significant model components was determined by cross validation. A component was considered significant if the ratio of the prediction error sum of squares (PRESS) to the residual sum of squares of the previous dimension (SS) was statistically smaller than 1.0 (Eriksson et al. 2006). Finally, the computed models were used to classify samples in the validation set, and seeds were considered as member of a given class if the predicted value was greater than the classification threshold (Ypred ≥ 0.5) and all others were considered as non-members. The performances of the classification models were evaluated using the following classification parameters: sensitivity (Sn), specificity (Sp), classification error rate (ER), Mean classification ER (MER), classification accuracy (CA) and Mean classification accuracy (MCA) following Ballabio and Consonni (2013). The equations used for calculating classification parameters were:


, where TP (True Positive) is the number of samples of a given species correctly recognized as member, FN (False Negative) is the number of samples of a given species incorrectly classified as non-member, TN (True Negative) the number of non-member samples correctly classified as non-member of a given species, and FP (False Positive) is the number of non-member samples incorrectly classified as member of a given species, and n is the number of classes.
While sensitivity describes the model’s ability to correctly recognize samples belonging to that class, specificity describes the model’s ability to reject samples of all other classes. The values for both sensitivity and specificity range from 0to 1; for example, if none of the samples in a given class was classified as member of other classes (FN = 0), the sensitivity for that class would be equal to 1. Similarly, if none of the non-member samples of a given class was classified as member of that class (FP = 0), the specificity for that class would be equal to 1.
Absorption bands that accounted for discriminating between birch species were determined by a parameter called Variable Influence on Projection (VIP). The VIP for predictive components (PRED_VIPOPLS) was computed using the following formula (Galindo-Prieto et al. 2015):
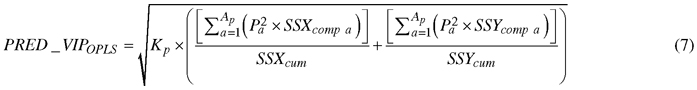
, where Kp is the total number of variables in the model; P is the normalized loadings; a and Ap are the number of each predictive component and the total number of predictive components, respectively; SSXcomp and SSYcomp represent the explained sum of squares of ath component for X and Y data matrices, respectively; and SSXcum and SSYcum represent the cumulative explained sum of squares by all A components in the model for X and Y data matrices, respectively.
Since the sum of squares of all VIP values is equal to the number of spectral X matrix variables contributed in each calibration model, the average VIP value would be 1. Thus, predictors with VIP value greater than 1.0 have a strong influence on the model, but a cut-off around 0.7–0.8 has been suggested to discriminate between relevant and irrelevant predictors (Eriksson et al. 2006).
3 Results
3.1 Spectral profile and model overview
The average raw absorbance values for B. pendula and B. pubescens seeds showed a similar spectral profile with two major peaks at 415 nm and 1920 nm (Fig. 1). The absorbance values were larger for B. pubescens than B. pendula across the entire wavelength region, one major peak in the visible region and several small shoulder peaks in the NIR region. As a whole, the spectra contained sufficient information to distinguish B. pubescens from B. pendula based on single seed spectra.
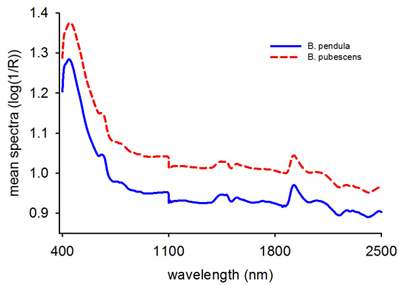
Fig. 1. Mean raw reflectance spectra (log 1/R) of Betula pendula and B. pubescens seeds.
OPLS-DA models were developed to distinguish between B. pubescens and B. pendula based on VIS + NIR, visible and NIR spectra of single seed (Table 2). The model developed using the VIS + NIR region had one predictive and 9 Y-orthogonal components (A = 1 + 9). The total spectral variation described by the model was 98.7%; of which the predictive spectral variation (R2XP) accounted for 30.2% and the spectral variation uncorrelated to the classes (R2Xo) constituted 68.4%. This small proportion of predictive spectral variation modelled 90.1% of the variation between species (R2Y) with 89.5% predictive power (Q2cv) according to cross validation. When the model was fitted on visible spectra alone, both the proportion of modelled variation between species and the predictive power according to cross-validation were decreased, but the model fitted on NIR spectra resulted in slightly higher proportion of modelled variation between species and the predictive power than the full or visible spectra model.
| Table 2. A statistical summary of discriminant models computed to identify Betula pubescens and B. pendula seeds using full (400–2500 nm), visible (400–780 nm) and near infrared (780–2500 nm) reflectance spectral region. | |||
| Model Statistics | Wavelength region (nm) | ||
| 400–2500 | 400–780 | 780–2500 | |
| Number of significant components (A)* | 1 + 11 | 1 + 7 | 1 + 16 |
| Predictive spectral variation (R2Xp) | 0.125 | 0.138 | 0.114 |
| Y-orthogonal spectral variation (R2Xo) | 0.875 | 0.861 | 0.886 |
| Modelled class variation (R2Y) | 0.884 | 0.833 | 0.924 |
| Predictive power of a model (Q2) | 0.877 | 0.828 | 0.917 |
| * The first and second values represent the number of components for predictive and orthogonal variations, respectively. | |||
The score plot for the first predictive and orthogonal components (tp[1] versus to[1]) showed symmetrical separation of B. pubescens and B. pendula (Fig. 2) in the calibration set (X-axis) while the orthogonal scores revealed within species variation (Y-axis). There were few samples of both species that fell outside the 95% confidence ellipse according to Hotelling’s T2 test (a multivariate generalization of Student’s t-test), but these samples were moderate outliers and excluding them from the calibration set did not improve the model. Thus, they were kept during model fitting.
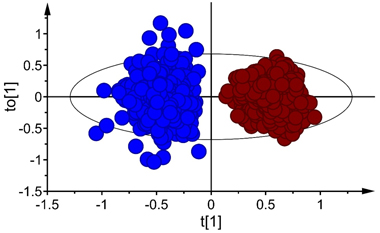
Fig. 2. Score plot for the first predictive (tp[1]) and orthogonal (to[1]) components of OPLS-DA model developed in Vis+ NIR range, depecting clear-cut separation of seeds of Betula pubescens (●) and B. pendula (●). Note that the ellipse shows 95% confidence interval according to Hotelling’s test.
3.2 Classification performance
The model fitted on Vis + NIR spectral region (400–2500 nm) assigned B. pubescens and B. pendula to their respective classes except for two B. pendula samples that was misclassified as B. pubescens (Fig. 3A). The overall prediction accuracy of class membership was 100% for B. pubescens and 99% for B. pendula. The discriminant model developed using the visible region alone fully recognized B. pendula but misclassified three samples of B. pubescens (Fig. 3B), while the model developed in the NIR region alone completely distinguished B. pubescens from B. pendula (Fig. 3C). The ability of the NIR-model to assign seeds to their respective species classes (sensitivity) as well as its ability to reject seeds of other species (specificity) was very high with 100% mean classification accuracy and 0.0% mean error rate (Table 3).
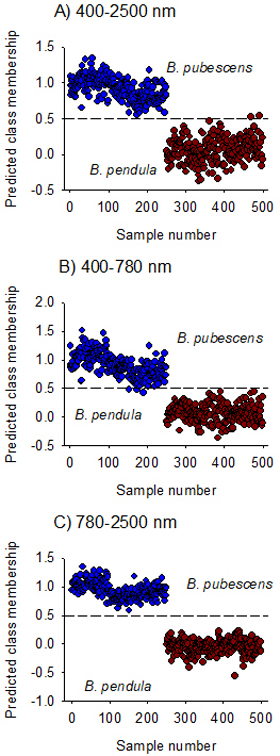
Fig. 3. Predicted Class membership of samples in the test set for seeds of Betula pendula and B. pubescens by OPLS-DA models fitted on Vis + NIR (panel A), visible (panel B) and NIR (panel C) regions. Note that the dashed line is threshold for classification (Ypred > 0.5).
| Table 3. Performance of classification model developed for identifying seeds of two birch species (Betula spp.) by multivariate discriminant analysis of NIR reflectance spectra. Sn is class sensitivity, Sp is class specificity, CA and ER are classification accuracy and error rate, respectively. | |||||
| Species | test set | Sn | Sp | CA | ER |
| Betula pubescens | Seedlot-1 | 1.0 | 1.0 | 1.0 | 0.0 |
| Seedlot-2 | 1.0 | 1.0 | 1.0 | 0.0 | |
| Seedlot-3 | 1.0 | 1.0 | 1.0 | 0.0 | |
| Seedlot-4 | 1.0 | 1.0 | 1.0 | 0.0 | |
| Seedlot-5 | 1.0 | 1.0 | 1.0 | 0.0 | |
| Mean CA | 1.0 | ||||
| Mean ER | 0.0 | ||||
| Betula pendula | Seedlot-1 | 1.0 | 1.0 | 1.0 | 0.0 |
| Seedlot-2 | 1.0 | 1.0 | 1.0 | 0.0 | |
| Seedlot-3 | 1.0 | 1.0 | 1.0 | 0.0 | |
| Seedlot-4 | 1.0 | 1.0 | 1.0 | 0.0 | |
| Seedlot-5 | 1.0 | 1.0 | 1.0 | 0.0 | |
| Mean CA | 1.0 | ||||
| Mean ER | 0.0 | ||||
3.3 Absorption bands relevant for discrimination of birch species and their families
The absorption band in 400–750 nm, with one major absorption peak centered at 674 nm and one shoulder peak at 613 nm were highly relevant for distinguishing B. pendula and B. pubescens (VIP > 1; Fig. 4A). In the NIR region, absorption peaks centered at 860 nm, 1944 nm, 2211 nm and 2336 nm were highly relevant for discrimination of the species (Fig. 4B). Other absorption peaks in the NIR region which were relevant for species discrimination appeared at 1458 nm, 1509 nm, and 1848 nm (VIP = 0.8–1.0).
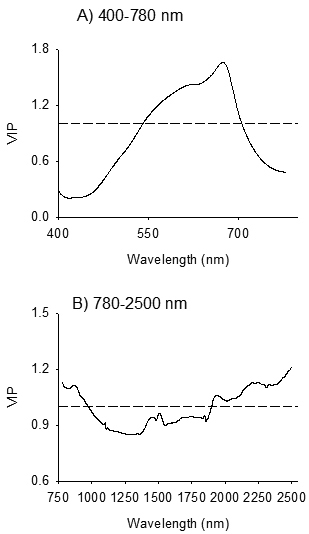
Fig. 4. Variable influence on Projection (VIP) plots depicting absorption bands accounted for identification of seeds of Betula pendula and B. pubescens by discriminant modelling of VIS (Panel A) and NIR (Panel B) spectral regions. The dashed line shows the threshold of significant contribution in model (VIP = 1).
4 Discussion
The results demonstrate that Vis + NIR spectroscopy has great taxonomic importance for distinguishing seeds of morphologically similar Betula spp. The computed OPLS-DA models efficiently utilized the spectral variation (R2X) to substantially describe between-species variations with few significant components to build the model and with overall excellent predictive power according to cross validation (Table 2). The model in the visible or NIR region alone also resulted in comparably similar prediction accuracy of class membership of the validation set as the model fitted on full spectra (Fig. 3). The OPLS-DA modelling approach results in parsimonious models with few components by extracting irrelevant spectral variations that are not useful for class discrimination (Trygg and Wold 2003; Daneshvar et al. 2015; Farhadi et al. 2015). The proportion of spectral variation that was uncorrelated to species discrimination was larger than the predictive spectral variation (Table 2). As the absorbance values were recorded at 0.5 nm wavelength resolution, it is legitimate to expect a high degree of redundancy in the absorbance values at this scale of resolution that have no relevance for species discrimination (Farhadi et al. 2016). In addition, individual seeds within each species could vary in color, moisture content and chemical composition that influence the homogeneity of the classes. This is further evidenced from the Y-orthogonal score plot where B. pendula had more tight class than B. pubescens (Fig. 2) while the orthogonal loading plot (data not shown)) shows one major peak at 691 nm that correlates with the grouping tendency observed in the score plot. Apparently, color variation among individual families within species would be the major source of Y-orthogonal spectral variation.
In the visible region, absorption maxima that were highly relevant for discriminating B. pendula and B. pubescens appeared at 613 nm and 674 nm (Fig. 4A). The observed absorption peaks correlated positively with B. pubescens; thus seeds of B. pubescens appeared to be more red-brownish than B. pendula seeds, which in turn vary among families within each species. Genotypic variations in seed physical traits, such as surface structure of seeds, seed size and germinability, as well as quantitative color characteristics of the seed coat are common in many tree seeds. Thus, it is legitimate to expect color variation between-species that was detected in the present study. Our finding is consistent with previous studies that have demonstrated the usefulness of reflectance spectra in the visible region for identification of seed origin and parents of Scots pine (Tigabu et al. 2005) as well as for seeds of hybrid larch and its’ parental species (Farhadi et al. 2016).
In NIR region, absorption bands in 780–970 nm, 1410–1570 nm, 1610–1860 nm and 1890–2000 nm and 2050–2500 nm were highly relevant for discriminating B. pendula from B. pubescens (Fig. 4B), and the spectral signature was dominantly emanated from B. pubescens seeds as evidenced from the positive loadings in these regions. The absorption band in 780–1100 nm, with a major peak at 860 nm, is characteristic of the third overtone of C – H stretching vibration and second overtone N – H and C – H stretching vibrations due to absorption by lipid and protein moieties such as CH3, CH2, ArNH2 (aromatic amino acids) and NH2. This region was useful to identify seed provenances of P. abies (Farhadi et al. 2017). The 1410–1570 nm regions of the NIR reflectance spectra presents peaks at 1458 nm and 1509 nm, which corresponds to first overtone of O – H and combination band of C – H vibration of various functional groups; notably ROH, and starch (Workman and Weyer 2012). The absorption band in 1610–1860 nm with absorption peak centered at 1848 nm arises mainly from O – H stretching and C – O combinations. The absorption band in 1890–2000 nm with absorption peak centered at 1944 nm arises from combination of O – H stretch and HOH deformation, and O – H bend second overtone and C = O stretch second overtone. Molecular moieties of alcohol, esters and acids show overlapping absorption peaks in this region (Shenk et al. 2001; Workman and Weyer 2012). The absorption band in 2050–2500 nm is characteristic of CH2 stretch-bend combinations as well as N – H combination bands and C – H stretch and CH2 deformation (Workman and Weyer 2012). Several compounds, such as polysaccharides, proteins and lipids, exhibit characteristic absorption peaks in these regions. Several fatty acids in several oil crops have shown positive correlation to absorption bands in these regions (Hourant et al. 2000; Osborne et al. 1993). Farhadi et al. (2016) also found these spectral regions useful for discrimination of pure and hybrid larch seeds. Thus, NIR spectroscopy appears to have detected differences in chemical compounds between the two species, probably polysaccharides, proteins and lipids, as a basis to distinguish between birch species.
The technique can be used to authenticate seed lots of the two species as there is a large variation among individuals in morphological characteristics, which makes differentiation between seed trees of B. pendula and B. pubescens unreliable. In addition, it can be used as a first step in the breeding program to objectively authenticate seeds of individual trees of the two species before establishing in the field aiming at selection of the most well performing trees. The advantages with this technique is that it is rapid and thereby cost-efficient as it takes ca. two minutes to scan a single seed, and non-destructive as there is no need for sample preparation.
5 Conclusions
Identification of birch species based on single seed Vis + NIR spectroscopy was successful. Thus, the results demonstrate the feasibility of NIR spectroscopy as taxonomic tool for classification of species that have morphological resemblance. Furthermore, the OPLS-DA modelling approach results in parsimonious models with additional information to examine within-class variation and its cause to better understand the modelling process.
Acknowledgements
The study was financially supported by Karl Erik Önnesjös Foundation. We thank Ana Mariscal for assistance in scanning the seeds. We extend our gratitude to the associate editor and the anonymous reviewers for valuable and constructive comments.
References
Atkinson M.D. (1992). Biological flora of the British Isles: Betula pendula Roth (B. verrucosa Ehrh.) and B. pubescens Ehrh. Journal of Ecology 80(4): 837–870. https://doi.org/10.2307/2260870.
Atkinson M.D., Codling A.N. (1986). A reliable method for distinguishing between Betula pendula and B. pubescens. Watsonia 16: 75–76.
Atkinson M.D., Jervis A.P., Sangha R.S. (1997). Discrimination between Betula pendula, Betula pubescens and their hybrids using near-infrared spectroscopy. Canadian Journal of Forest Research 27(11): 1896–1900. https://doi.org/10.1139/x97-141.
Ballabio D., Consonni V. (2013). Classification tools in chemistry. Part 1: linear models. PLS-DA. Analytical Methods 5(16): 3790–3798. https://doi.org/10.1039/c3ay40582f.
Bevilacqua M., Bucci R., Magrì A.D., Magrì A.L., Marini F. (2012). Tracing the origin of extra virgin olive oils by infrared spectroscopy and chemometrics: a case study. Analytica Chimica Acta 717: 39–51. https://doi.org/10.1016/j.aca.2011.12.035.
Daneshvar A., Tigabu M., Karimidoost A., Oden P.C. (2015). Single seed Near Infrared Spectroscopy discriminates viable and non-viable seeds of Juniperus polycarpos. Silva Fennica 49(5) article 1334. https://doi.org/10.14214/sf.1334.
Eriksson L., Johansson E., Kettaneh-Wold N., Trygg J., Wikström C., Wold S. (2006). Multi- and megavariate data analysis. Basic principles and applications. Second revised and enlarged edition, Umetrics Academy, Umeå, Sweden. 425 p.
Farhadi M., Tigabu M., Odén P.C. (2015). Near Infrared Spectroscopy as non-destructive method for sorting viable, petrified and empty seeds of Larix sibirica. Silva Fennica 49(5) article 1340. https://doi.org/10.14214/sf.1340.
Farhadi M., Tigabu M., Stener L.-G., Odén P.C. (2016). Feasibility of Vis + NIR spectroscopy for non-destructive verification of European × Japanese larch hybrid seeds. New Forests 47(2): 271–285. https://doi.org/10.1007/s11056-015-9514-4.
Farhadi M., Tigabu M., Pietrzykowski M., Danusevičius D., Odén P.C. (2017). Application of near infrared spectroscopy for authentication of Picea abies seed provenance. New Forests 48(5): 629–642. https://doi.org/10.1007/s11056-017-9589-1.
Fischer A., Lindner M., Abs C., Lasch P. (2002). Vegetation dynamics in central European forest ecosystems (near-natural as well as managed) after storm events. Folia Geobotanica 37(1): 17–32. https://doi.org/10.1007/BF02803188.
Fries J. (1964). Vårtbjörkens produktion I Svealand och södra Norrland. [Summary: Yield of Betula verrucosa Ehrh. in Middle Sweden and southern North Sweden]. Studia Forestalia Suecia 14. 303 p.
Galindo-Prieto B., Eriksson L., Trygg J. (2015). Variable influence on projection (VIP) for OPLS models and its applicability in multivariate time series analysis. Chemometrics and Intelligent Laboratory Systems 146: 297–304. https://doi.org/10.1016/j.chemolab.2015.05.001.
Hynynen J., Niemistö P., Viherä-Aarnio A., Brunner A., Hein S., Velling P. (2010). Silviculture of birch (Betula pendula Roth and Betula pubescens Ehrh.) in northern Europe. Forestry 83(1): 103–119. https://doi.org/10.1093/forestry/cpp035.
Isidorov V., Szczepaniak L., Wróblewska A., Piroznikow E., Vetchinnikova L. (2014). Gas chromatographic-mass spectrometric examination of chemical composition of two Eurasian birch (Betula L.) bud exudates and its taxonomical implication. Biochemical Systematics and Ecology 52: 41–48. https://doi.org/10.1016/j.bse.2013.12.008.
Keinänen M., Julkunen-Tiitto R., Rousi M., Tahvanainen J. (1999). Taxonomic implications of phenolic variation in leaves of birch (Betula L.) species. Biochemical Systematics and Ecology 27(3): 243–354. https://doi.org/10.1016/S0305-1978(98)00086-6.
Laitinen M.-L., Julkunen-Tiitto R., Tahvanainen J., Heinonen J., Rousi M. (2005). Variation in birch (Betula pendula) shoot secondary chemistry due to genotype, environment and ontogeny. Journal of Chemical Ecology 31(4): 697–717. https://doi.org/10.1007/s10886-005-3539-7.
Lundgren L.N., Pan H., Theander O., Eriksson H., Johansson U., Svenningsson M. (1995). Development of a new chemical method for distinguishing between Betula pendula and Betula pubescens in Sweden. Canadian Journal of Forest Research 25(7): 1097–1102. https://doi.org/10.1139/x95-121.
Osborne B.G., Fearn T., Hindle P.H. (1993). Theory of near infrared spectrophotometry. In: Osborne B.G., Fearn T., Hindle P.H. (eds.). Practical NIR spectroscopy: with applications in food and beverage analysis. 2nd edition, Longman Scientific and Technical, Harlow, UK. p. 13–35.
Raal A., Boikov T., Püssa T. (2015). Content and dynamics of polyphenols in Betula spp. leaves naturally growing in Estonia. Records of Natural Products 9: 41–48.
Renou-Wilson F., Pöllänen M., Byrne K., Wilson D., Farrell E.P. (2010). The potential of birch afforestation as an after-use option for industrial cutaway peatlands. Suo – Mires and peat 61: 59–76.
Shenk J.S., Workman J.J., Westerhaus M.O. (2001). Application of NIR spectroscopy to agricultural products. In: Burns D.A., Ciurczak E.W. (eds.). Handbook of near-infrared spectroscopy. 2nd edition, Marcel Dekker Inc., New York. p. 419–474.
Tigabu M., Oden P.C., Lindgren D. (2005). Identification of seed sources and parents of Pinus sylvestris L. using visible–near infrared reflectance spectra and multivariate analysis. Trees 19(4): 468–476. https://doi.org/10.1007/s00468-005-0408-5.
Trygg J., Wold S. (2003). O2-PLS, a two-block (X-Y) latent variable regression (LVR) method with an integral OSC filter. Journal of Chemometrics 17(1): 53–64. https://doi.org/10.1002/cem.775.
Vitale R., Bevilacqua M., Bucci R., Magrì A.D., Magrì A.L., Marini F. (2013). A rapid and non-invasive method for authenticating the origin of pistachio samples by NIR spectroscopy and chemometrics. Chemometrics and Intelligent Laboratory Systems 121: 90–99. https://doi.org/10.1016/j.chemolab.2012.11.019.
Workman J., Weyer L. (2012). Practical guide and spectral atlas for interpretive near-infrared spectroscopy. 2nd edition, CRC Press. Taylor & Francis, Boca Raton, Florida. 326 p.
Total of 26 references.
