Lele Lu,
Sophan Chhin,
Jianguo Zhang,
Xiongqing Zhang 
Modelling tree height-diameter allometry of Chinese fir in relation to stand and climate variables through Bayesian model averaging approach
Lu L., Chhin S., Zhang J., Zhang X. (2021). Modelling tree height-diameter allometry of Chinese fir in relation to stand and climate variables through Bayesian model averaging approach. Silva Fennica vol. 55 no. 2 article id 10415. https://doi.org/10.14214/sf.10415
Highlights
- Bayesian model averaging (BMA) and stepwise regression (SR) were compared for modelling tree height-diameter allometry
- The model acquired by SR was equal to the model with the third highest posterior probability of the BMA models
- BMA produced estimates of the model parameters with slightly narrower ranges around the estimate of the population parameter
- Temperature was the dominant climate variable shaping the allometry.
Abstract
Tree height-diameter allometry reflects the response of specific species to above and belowground resource allocation patterns. However, traditional methods (e.g. stepwise regression (SR)) may ignore model uncertainty during the variable selection process. In this study, 450 trees of Chinese fir (Cunninghamia lanceolata (Lamb.) Hook.) grown at five spacings were used. We explored the height-diameter allometry in relation to stand and climate variables through Bayesian model averaging (BMA) and identifying the contributions of these variables to the allometry, as well as comparing with the SR method. Results showed the SR model was equal to the model with the third highest posterior probability of the BMA models. Although parameter estimates from the SR method were similar to BMA, BMA produced estimates with slightly narrower 95% intervals. Heights increased with increasing planting density, dominant height, and mean annual temperature, but decreased with increasing stand basal area and summer mean maximum temperature. The results indicated that temperature was the dominant climate variable shaping the height-diameter allometry for Chinese fir plantations. While the SR model included the mean coldest month temperature and winter mean minimum temperature, these variables were excluded in BMA, which indicated that redundant variables can be removed through BMA.
Keywords
Cunninghamia lanceolata;
Bayesian model averaging;
height-diameter allometry;
stand and climate variables;
stepwise regression
- Lu, Key Laboratory of Tree Breeding and Cultivation of the National Forestry and Grassland Administration, Research Institute of Forestry, Chinese Academy of Forestry, Beijing 100091, P. R. China; Collaborative Innovation Center of Sustainable Forestry in Southern China, Nanjing Forestry University, Nanjing, 210037, P. R. China E-mail 18556439861@163.com
- Chhin, Division of Forestry and Natural Resources, West Virginia University, 322 Percival Hall, 1145 Evansdale Dr, Morgantown, West Virginia, 26506, USA E-mail steve.chhin@mail.wvu.edu
- Zhang, Key Laboratory of Tree Breeding and Cultivation of the National Forestry and Grassland Administration, Research Institute of Forestry, Chinese Academy of Forestry, Beijing 100091, P. R. China E-mail xqzhang85@caf.ac.cn
-
Zhang,
Key Laboratory of Tree Breeding and Cultivation of the National Forestry and Grassland Administration, Research Institute of Forestry, Chinese Academy of Forestry, Beijing 100091, P. R. China; Collaborative Innovation Center of Sustainable Forestry in Southern China, Nanjing Forestry University, Nanjing, 210037, P. R. China
E-mail
xqzhang85@yahoo.com
Received 8 July 2020 Accepted 2 April 2021 Published 8 April 2021
Views 105024
Available at https://doi.org/10.14214/sf.10415 | Download PDF

1 Introduction
Tree height-diameter allometry is a critical structure relationship and widely used in forest growth and yield models (Curtis 1966; Fang and Bailey 1998). The relationship can be used for estimating biomass and carbon storage (Hulshof et al. 2015). Errors in tree height prediction may lead to large errors when estimating carbon stocks. In addition, height-diameter relationships are also used for evaluating mechanical stability and timber quality (King 1990; Mensah et al. 2018). Accounting for both diameter and height provides a flexible perspective to understand differences in growth allocation of species or functional groups (Mensah et al. 2018).
Precise prediction of tree height-diameter allometry is crucial in forest growth and yield systems. A number of models have been developed. For instance, Tewari and Gadow (1999) used a bivariate height-diameter distribution which included the SBB distribution (the bivariate distribution) to develop height-diameter relationships. The power law, logistic, Richards, Gompertz, and Weibull equations have also been tested (Curtis 1966; Huang et al. 1992; Zeide 1993; Fang and Bailey 1998; Sánchez et al. 2003).
When there are a large number of variables in the models, we should choose the subset of independent variables which are strongly associated with the dependent variable for model development (Raftery et al. 1995; Wang et al. 2004). Usually, the variables with statistical significance are selected using stepwise regression (SR). However, little or no attention is given to the imprecision arising from the variable selection procedure, since the final single model is implicitly assumed to be “optimal”. In addition, a small change in the size of the sample data set may lead to a different set of selected variables (Prost et al. 2008). If there are n variables, the number of possible models will be 2n. Actually, we do not know the model with which variables is the optimal one before we analyze the data. These problems are commonly known as model uncertainty (Draper 1995; Raftery et al. 1997). Neglecting model uncertainty may lead to overconfident predictions and reduce reliability (Raftery et al. 1995; Wintle et al. 2003).
Bayesian model averaging (BMA) developed by Kass and Raftery (1995) is a method that provides an efficient tool for data analysts to discover promising models and obtain estimates of their posterior probabilities. In BMA models, the probabilities are used as weights for averaged model predictions and parameter estimates (Lipkovich 2002). The BMA approach has been commonly used in hydrological and ecological studies (Verbeeck et al. 2006; Dong et al. 2011). Additionally, BMA has been used to model diameter distributions (Bullock and Boone 2007), tree aboveground biomass (Picard et al. 2012), and tree mortality (Lu et al. 2019).
As shade intolerant species, Chinese fir (Cunninghamia lanceolata (Lamb.) Hook.) prefers to grow in warm and humid environments (Wu 1984). It is adapted to climate conditions that are characterized by annual average temperatures of 15–23 °C and precipitation amounts of 800–2000 mm. It is one of the most widely distributed and important tree species in southern China for timber production. Due to its high quality timber, the total planting area has reached 8.93 million hectares, accounting for 19.01% of all plantation area (SFA 2013). Prior studies have developed the height-diameter allometry of Chinese fir. Yuan and Li (2012) indicated that the height-diameter allometry was different in south versus north aspects. Li et al. (2015) developed height-diameter models and found the model including multiple stand variables performed better in height estimation than one-independent-variable models for Chinese fir. Zhang et al. (2019) determined that climate variables affected the height-diameter allometry of Chinese fir using data collected from four provinces. However, none of these studies have accounted for the uncertainty in the selection of the height-diameter allometry model.
The aim of this study is to model tree height-diameter allometry of Chinese fir plantations in relation to stand and climate variables using a BMA approach to address model uncertainty and identify the contributions of these variables on the allometry under five initial planting densities. In addition, we compared the BMA approach with a traditional method (SR) on selection of variables by predictive performance on the tree height-diameter allometry.
2 Materials and methods
2.1 Study area and data collection
The study site is in Shaowu city (27°05´N, 117°43´E), Fujian province, in southern China (Fig. 1). Chinese fir is widely distributed in Fujian. The region belongs to the subtropical monsoon climate zone with mean annual temperature of 17.7 °C, annual rainfall of 1768 mm, and annual sunshine duration of 1740.7 h. The soil type of the site is yellow-brown. The soil thickness is about 50–100 cm. The soil forming parent rock is mainly sandy shale and phyllite.
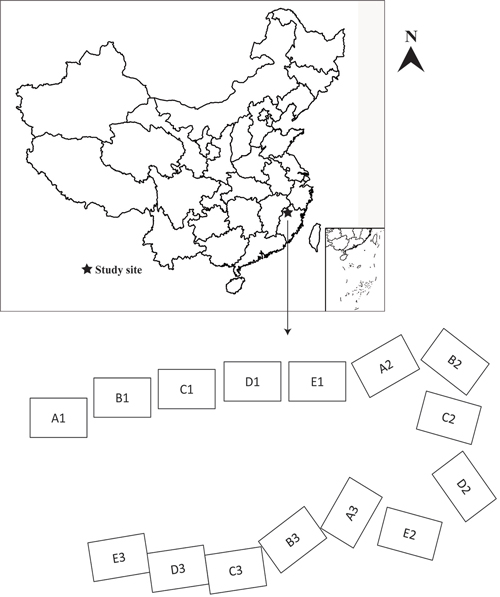
Fig. 1. Plot distributions and location of Chinese fir plantations used for modelling height-diameter allometry.
Data used in this study were from Chinese fir stands established with bare-root seedlings in 1982. Five initial planting densities were planted in a randomized block design: A: 2 m × 3 m (1667 trees/ha), B: 2 m × 1.5 m (3333 trees/ha), C: 2 m × 1 m (5000 trees/ha), D: 1 m × 1.5 m (6667 trees/ha), and E: 1 m × 1 m (10 000 trees/ha). There are 15 plots (20 m × 30 m /plot) in total with every treatment replicated three times. Every plot comprised a buffer zone including two lines of similar trees. The 15 plots were uniformly distributed in the middle slope position of the mountain (Fig. 1).
We tracked 450 trees which continued to survive from 1984 to 2010 in the 15 plots. We measured tree height (H) with a Vertex (Haglof, Sweden) hypsometer and diameter at breast height (DBH at 1.3 m) every year from 1984 to 1990, and every other year from 1992 to 2010, for a total of 17 sampling times. Here, 60% of the sampled tree data including the measurements at each sampling interval were randomly selected and used for model development and the remaining 40% were used for model validation.
2.2 Candidate stand and climate variables
Some reports indicated that stand basal area, number of trees per ha, and stand dominant height (a proxy of site index) were significant explanatory variables in height-diameter models (Huang and Titus 1994; Sharma and Parton 2007). Generally, age is regarded as a good proxy of tree size in even-aged stands. In this study, stand variables included the arithmetic mean diameter (Dm), stand basal area per ha (BA), stand dominant height (HD, the mean height of the five highest trees in the stand), tree age (A), and number of trees per ha (N). To determine the influence of initial planting density (PD) on height-diameter allometry, the planting density was also given consideration as a candidate variable. Statistics of stand and tree variables across all the planting density levels are shown in Table 1 in which means and standard deviations were calculated over the 17 sampling times from 1984–2010 (every year from 1984 to 1990, and every other year from 1992 to 2010).
| Table 1. Statistics of stand-and tree-level variables used for modelling height-diameter allometry of Chinese fir in this study. | ||||||||||
| Planting Density (PD) | BA (m2 ha–1) | N (tree/ha) | HD (m) | DBH (cm) | H (m) | |||||
| Mean | SD | Mean | SD | Mean | SD | Mean | SD | Mean | SD | |
| A (1667 trees/ha) | 33.03 | 19.84 | 1588.27 | 193.43 | 14.60 | 6.69 | 15.61 | 7.32 | 12.20 | 6.24 |
| B (3333 trees/ha) | 36.99 | 20.63 | 3094.15 | 513.69 | 13.14 | 6.12 | 12.59 | 5.86 | 10.94 | 5.51 |
| C (5000 trees/ha) | 40.47 | 21.95 | 4415.94 | 976.48 | 13.61 | 6.45 | 12.04 | 5.87 | 11.22 | 5.74 |
| D (6667 trees/ha) | 44.58 | 24.36 | 5705.04 | 1412.55 | 12.77 | 6.28 | 11.21 | 5.36 | 10.66 | 5.34 |
| E (10 000 trees/ha) | 42.21 | 19.97 | 7719.66 | 2794.09 | 12.27 | 5.94 | 9.87 | 5.13 | 9.41 | 4.87 |
| BA: Stand basal area, N: Number of trees per ha; HD: stand dominant height; DBH: diameter at breast height; H: Tree height. Mean and SD calculated over the 17 instances of field sampling measurements taken from 1984–2010 (with each sampling instance occurring every year from 1984 to 1990, and every other year from 1992 to 2010). | ||||||||||
Some studies reported that both precipitation and temperature influence growth processes of trees (Vizcaíno-Palomar et al. 2017; Fortin et al. 2019; Zhang et al. 2019). Eight climate variables including mean annual temperature (MAT), spring mean temperature (SMT), winter mean minimum temperature (WMMT), annual precipitation (AP), mean coldest month temperature (MCMT), summer mean maximum temperature (SMMT), annual heat moisture index (AHM), and mean warmest month temperature (MWMT), which are listed in Table 2, were incorporated to model height-diameter allometry. AHM was used to represent annual climatic water deficit, since MAT and AP were integrated into a single parameter: AHM = (MAT + 10)/(AP/1000) (Zhang et al. 2019). We used ClimateAP software to obtain the climate data. The software derives the spatially interpolated data based on latitude, longitude, and elevation of the site (Lu et al. 2019). Table 2 lists the statistics of climate variables of the study site for the years 1984–2010. We pre-selected each variable through the variance inflation factor (VIF) test before regressing to avoid multicollinearity using package DAAG in R (Maindonald and Braun 2015). A common rule is that there is no multicollinearity when the VIF < 5 (Zhang et al. 2019).
| Table 2. Summary statistics of climate variables for the years 1984–2010 used for modelling height-diameter allometry. Values in parentheses are minimum and maximum values. | ||
| Climate variable | Description | Mean |
| MAT (°C) | Mean annual temperature | 18.96 (18.10, 19.80) |
| MWMT (°C) | Mean warmest month temperature | 28.26 (26.50, 30.30) |
| MCMT (°C) | Mean coldest month temperature | 8.34 (5.20, 10.20) |
| AP (mm) | Annual precipitation | 1795.79 (1390.00, 2416.00) |
| AHM | Annual heat-moisture index | 16.45 (11.90, 21.40) |
| SMMT (°C) | Summer mean maximum temperature | 32.10 (30.30, 33.80) |
| WMMT (°C) | Winter mean minimum temperature | 4.95 (2.50, 6.60) |
| SMT (°C) | Spring (Mar.–May) mean temperature | 18.53 (16.90, 19.60) |
2.3 Height-diameter allometry model
Mensah et al. (2018) found that the power function had excellent performance in terms of fitting the height-diameter model for 45 species in South Africa. The allometry model including the selected variables had the following structure:
![]()
where H is tree height, DBH is diameter at breast height, a and b are the parameters to be estimated, x is an independent variable vector containing stand and climate variables, β is the parameter vector, and ε is the residual error term. In height-diameter allometry, the parameter b also referred to scale parameter (Niklas 1993). For estimating the model under the BMA framework (Raftery et al. 2005) and to deal with model heteroscedasticity, Eq. 1 can be linearized using logarithms:
![]()
It should be noted that the log-transformation of the data results in a minor bias in height estimation. Baskerville (1972) gave an approximation of the estimate that is corrected for this bias:
![]()
where ![]() is the estimated variance of Ln(ε), n is the sample size, Ln(H) is the natural log of the observation values, and
is the estimated variance of Ln(ε), n is the sample size, Ln(H) is the natural log of the observation values, and ![]() is the predicted values from Eq. 2.
is the predicted values from Eq. 2.
2.4 The theory of BMA
Let θ represent a quantity of interest; here, it denotes the Log transform of tree height, i.e., Ln(H). y is independent variable vector including DBH, stand and climate variables. In general, model uncertainty is large because there are many variables that could affect tree height. For example, the number of candidate models will be 2p, if there are p variables. Actually, we are rarely totally confident about which model best represents our data (Raftery et al. 1995). The BMA method provides a way of selecting a subset of possible models (each submodel contains a unique combination of the variables) and using the posterior probabilities of these models to estimate key influential variables (Kass and Raftery 1995). Based on the probability model (Raftery 1996), the posterior distribution of θ is listed as follows:
![]()
where P(θ | y, Mi) represents the posterior distribution of the prediction of θ under model Mi, P(Mi | y) is the probability of model Mi, and k is the number of candidate models.
Based on Bayes rule, the posterior probability of the model Mi can be given by:

where P(Mi) is the prior probability in model Mi. P(y | Mi) is the integrated likelihood function of model Mi:

where βi is the vector of regression parameters for model Mi.
The posterior probability shown in equation (4) gives a method to calculate the estimates and credible intervals given the uncertainty of the model. An uninformative prior was used for the parameter prior (Box and Tiao 1973). The influence of a specific variable on the likelihood of affecting tree height can be interpreted as follows using the posterior probability P(βj ≠ 0 | y):
![]()
where βj ≠ 0means the predictor has an effect on the height growth, G is the model space, IMi is a 0/1 indicator variable. IMi = 1 when βj of the jth variable is in the model Mi, and 0when it is not. A common set of rules for making inferences using the BMA posterior probability (Kass and Raftery 1995; Wang et al. 2004; Lu et al. 2019) is shown in Table 3. If the variable xj affects height growth, then the posterior mean of its parameter βj is shown as:

where ![]()
| Table 3. Inference rules for determining if variables have an effect on tree height using the Bayesian model averaging (BMA) posterior probability. | |
| Probability | Effect of xj on tree height |
| P(βj ≠ 0 | y) < 0.5 | no effect |
| 0.5 ≤ P(βj ≠ 0 | y) < 0.75 | weak effect |
| 0.75 ≤ P(βj ≠ 0 | y) < 0.95 | positive effect |
| P(βj ≠ 0 | y) ≥ 0.95 | strong effect |
To fit the BMA models, we used the function bicreg in the BMA package (Raftery et al. 2005) in R software (R Development Core Team 2018). The SR method was performed in SAS software (SAS Institute 2011). Independent variables were selected using bidirectional elimination (P-value < 0.05). Therefore P-values significant at P < 0.05 for the traditional SR approach and mean of βj > 75% for BMA were used, which is equivalent to P < 0.05 in the traditional SR approach (Viallefont et al. 2001; Mu et al. 2019). The algorithm for BMA modeling needs to compute the integrated likelihoods for all models (Eq. 6) and averaged over all models. In the function bicreg, the integrated likelihood is approximated through the BIC (Bayesian Information Criterion) approximation (Raftery et al. 2005). The following BIC approximation in the BMA package was used for calculating the integrated likelihood function of model Mi:
![]() where di = dim(βi) is the number of independent variables in Mi, and
where di = dim(βi) is the number of independent variables in Mi, and ![]() is the maximum likelihood estimate vector. The models with high posterior probabilities are found through the fast leaps and bounds algorithm to approximate the sum over all the models (Raftery et al. 2005), which was introduced by Furnival and Wilson (1974) and Raftery (1995).
is the maximum likelihood estimate vector. The models with high posterior probabilities are found through the fast leaps and bounds algorithm to approximate the sum over all the models (Raftery et al. 2005), which was introduced by Furnival and Wilson (1974) and Raftery (1995).
2.5 Model performance evaluation
Both BMA and SR methods (bidirectional elimination) were used to model height-diameter allometry. The evaluation statistics including R2, mean difference (MD), and mean absolute difference (MAD) were used to evaluate the model performance. In general, models with higher R2, and lower MD and MAD are better.


where ![]() denotes the mean value of observed H, and
denotes the mean value of observed H, and ![]() is the predicted value after log-transfomation correction at tree i.
is the predicted value after log-transfomation correction at tree i.
3 Results
Based on the VIF test, multicollinearity did not exist among PD, HD, BA, MAT, MCMT, AHM, SMMT, and WMMT (VIF < 5). Therefore, these eight variables were included in modelling height-diameter allometry of Chinese fir.
3.1 Comparison of the models output from SR and BMA approaches
Table 4 shows the top five models and their posterior probabilities of the tree height-diameter allometry model derived through BMA and this model development was carried out with the training data set. The model fitted using the SR method was the same as the third highest model determined by BMA (Table 4). In the BMA models, the posterior probability of the highest probability model was 0.454, which was much higher than the third highest one that had a value of 0.127 (which had the same variables as the SR model). Fig. 2 shows the model space of the height-diameter models determined by BMA. It clearly indicated that the model performance changes with different combinations of the variables.
| Table 4. The top five models selected and their posterior probabilities (post prob) of tree height-diameter allometry through Bayesian model averaging (BMA) and the model selected by stepwise approach (SR). The BMA model that has same variables as the SR model is in bold. | |||
| BMA models | SR Model | ||
| Models | Post prob | DBH, PD, HD, BA, MAT, MCMT, SMMT, WMMT | |
| Model 1 | (0.454) | DBH, PD, HD, BA, MAT, MCMT, SMMT | |
| Model 2 | (0.312) | DBH, PD, HD, BA, MAT, SMMT, WMMT | |
| Model 3 | (0.127) | DBH, PD, HD, BA, MAT, MCMT, SMMT, WMMT | |
| Model 4 | (0.082) | DBH, PD, HD, BA, MAT, MCMT, AHM, SMMT | |
| Model 5 | (0.016) | DBH, PD, HD, BA, MCMT, SMMT | |
| BA: Stand basal area, HD: stand dominant height; DBH: diameter at breast height; H: Tree height; PD: planting density; MAT: mean annual temperature; MCMT: mean coldest month temperature; SMMT: Summer mean maximum temperature; WMMT: Winter mean minimum temperature; AHM: Annual heat-moisture index. | |||
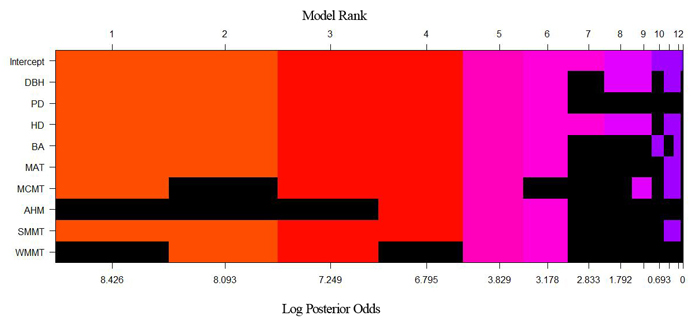
Fig. 2. Height-diameter model space through Bayesian model averaging (BMA). Each column represents one of the candidate models. The variables in black and other colors for each column are excluded and included in a model, respectively. The different colors of each column included in a model were used to help visually contrast differences in model ranking. The width of the column is proportional to the model’s posterior probability on the axis. View larger in new window/tab.
Based on the validation data set, there were negligible differences in R2, MD, and MAD between the BMA and SR model. Consequently, these statistics showed that the methods have no significant difference in model performance. Nonetheless, we found the BMA method performed well in modelling height-diameter allometry of Chinese fir (Table 5, Fig. 3).
| Table 5. Evaluation statistics of model prediction determined by Bayesian model averaging (BMA) and stepwise (SR) methods for modelling height-diameter allometry. | ||
| Statistics | BMA | SR |
| R2 | 0.9541 | 0.9540 |
| MD | 0.0018 | –0.0078 |
| MAD | 0.9042 | 0.9043 |
| MD: mean difference; MAD: mean absolute difference. | ||
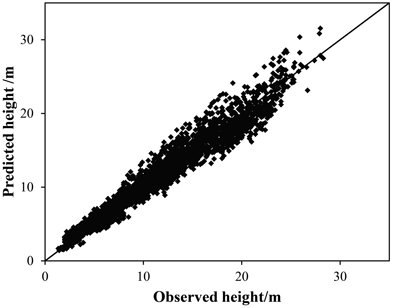
Fig. 3. Relationship between predicted height from Bayesian model averaging (BMA) and observed height based on the validation dataset.
3.2 Parameter estimates and P-values (or posterior probability) from SR and BMA approaches
Via the BMA approach, there was strong evidence to indicate that tree height increased with increasing DBH, PD, HD, and MAT, while tree height decreased with increasing BA, MCMT, and SMMT (Table 6). There was weak evidence to indicate that MCMT had a negative effect on tree height. In addition, there was no evidence to support that AHM and WMMT affected tree height. Comparing the two methods, the SR method selected more variables than BMA. In addition to the same variables that were deemed to strongly affect tree height using the BMA approach, it was observed that in the SR model, tree height decreased significantly with increasing MCMT and WMMT (P < 0.01) (Table 6).
| Table 6. The parameter estimates determined by Bayesian model averaging (BMA) and stepwise (SR) methods for modelling height-diameter allometry. | ||||||
| Variable | SR | BMA | ||||
| Mean | 95%CI | P-value | Mean | 95% CI | PP | |
| Intercept | 0.599 | –0.177, 1.574 | >0.05 | 2.263 | 2.260, 2.266 | 1.000 |
| DBH | 0.540 | 0.526, 0.664 | <0.01 | 0.540 | 0.527, 0.554 | 1.000 |
| PD | 0.106 | 0.099, 0.114 | <0.01 | 0.106 | 0.099, 0.113 | 0.999 |
| HD | 0.678 | 0.664, 0.695 | <0.01 | 0.678 | 0.661, 0.690 | 0.999 |
| BA | –0.099 | –0.107, –0.091 | <0.01 | –0.099 | –0.107, –0.089 | 1.000 |
| MAT | 0.563 | 0.341, 0.784 | <0.01 | 0.498 | 0.241, 0.648 | 0.991 |
| MCMT | –0.059 | –0.099, –0.018 | <0.01 | –0.056 | –0.123, –0.055 | 0.714 |
| AHM | - | - | >0.05 | 0.002 | 0.000, 0.032 | 0.098 |
| SMMT | –0.989 | –1.250, –0.728 | <0.01 | –0.974 | –1.275, –0.670 | 1.000 |
| WMMT | –0.037 | –0.064, –0.010 | <0.01 | –0.024 | –0.070, 0.000 | 0.413 |
| BA: Stand basal area, HD: stand dominant height; DBH: diameter at breast height; PD: planting density; MAT: mean annual temperature; MCMT: mean coldest month temperature; SMMT: Summer mean maximum temperature; WMMT: Winter mean minimum temperature; AHM: Annual heat-moisture index; CI: confidence interval for SR, and credible interval for BMA. PP: Posterior probability from BMA and values in bold indicate that variables have a strong effect on tree height. | ||||||
We also found most of the intervals of parameter estimates from BMA were narrower than those of the SR model (Table 6). In addition, stand variables generally had greater influences on tree height than climate variables according to the posterior probabilities of the parameters (Table 6). The scale parameter b1 of the height-diameter allometry of Chinese fir was 0.54 (Table 7).
| Table 7. Summary of the scale of height-diameter allometry. | |||||
| Scale | Study by Mcmahon and Kronauer (1976) | Study by Zhang et al. (2019) | This study | ||
| Stress similarity | Elastic similarity | Geometric similarity | |||
| 0.50 | 0.66 | 1.00 | Close to 0.5 | 0.54 | |
4 Discussion
4.1 SR and BMA approaches
In this study, the BMA and SR methods were compared for modeling tree height-diameter allometry in relation to stand and climate variables. The SR method selects variables according to the significance of independent variables on the dependent variable (P-value). However, Freedman et al. (1988) said that the use of P-values during variable selection may be dramatically misleading. Furthermore, SR ignores the uncertainty of the models (Fig. 2). Choosing a single model and disregarding the others could distort our inference capabilities based on the quantities of interest of a single specific regression model (Zhang et al. 2007; Picard et al. 2012). In addition, Altman and Adersen (1989) concluded that small changes of sample size may lead to different sets of variables, and instability of variable selection.
In fact, we are rarely totally confident about which height-diameter model best simulates our data. Uncertainty must be taken into account, and BMA provides an elegant way to do so. The advantage of the BMA method is consideration of model uncertainty (Fig. 2), which has also been evaluated in several different kinds of models, such as survival analysis (Volinsky et al. 1997; Viallefont et al. 2001), linear modelling (Raftery 1996), and hazard modelling (Murphy and Wang 2001). Their results indicated that BMA enhanced model performance.
Here, the model fitted using the SR method had the same selection of variables as the third best model selected by BMA (Table 4). This showed that the selection procedure is simply different between the two methods and thus leads to different models. In addition, more variables (MCMT and WMMT) were incorporated in the SR model than BMA. These variables might be redundant variables. Generally, as the minimum temperature rose in winter, tree height of Chinese fir should increase. But the results of SR suggested that MCMT and WMMT had significantly negative effects on tree height growth. However, in BMA, there was no strong evidence to indicate that there were negative effects on tree height. In other words, the results showed that the parameter estimates of BMA yielded better interpretation than those of the SR model. Lu et al. (2019) used BMA and SR methods to model the relationships between tree mortality and stand and climate variables, and found that more redundant variables were included in the SR model. The SR method has the tendency to choose a redundant variable correlating with a true variable more often than choosing an uncorrelated variable, whereas BMA did not choose a redundant variable even if it was correlated with a true variable (Raftery et al. 1997; Viallefont et al. 2001; Wang et al. 2004). Furthermore, Genell et al. (2010), using simulated data, showed that BMA had a larger probability of not choosing a redundant variable compared with the SR method and the probability of choosing a true variable of two methods was similar. In our study, it appears that BMA has the capacity to develop more parsimonious models than the traditional SR approach. However, differences in model performance between the two methods were negligible in this study.
4.2 Variables affecting tree height
Tree height of Chinese fir increased with increasing HD (Table 6). Calama and Montero (2004) fitted an individual-tree height-diameter model of stone pine (Pinus pinea L.) in Spain. Crecente-Campo et al. (2010) developed a generalized height-diameter model of Eucalyptus globulus Labill. stands in Galicia (northwestern Spain). Both of these two studies found that HD was a good estimator for tree height. In height-diameter model, site index was traditionally used as a representative of site fertility (Sánchez et al. 2003). Better fertility accelerates tree height growth. BA, which can be regarded as a competition index, had negative effects on tree height (Table 6). Feldpausch et al. (2011) reported that BA was an important driver of variation in height-diameter allometry. For Chinese fir, BA had a negative effect on height, which suggested that trees tended to be shorter in height because of exposure to high competition (BA) (Zhang et al. 2019).
Previous studies have showed that stand density was the main biological variable affecting tree height-diameter allometry (Zeide and Vanderschaaf 2002; Crecente-Campo et al. 2010). When trees grow in a dense stand, they tend to be higher than those in a sparse stand to elevate their leaves above competitors in order to maximize light capture (Liu et al. 2003). In our study, planting density (PD) was positively correlated with height (Table 6). With less growth being allocated to height at lower densities, more open grown trees have a general tendency of allocating more growth to lower branches and fuller, lateral crown size.
For climate variables, tree height increased with increasing MAT, but decreased with increasing SMMT (Table 6), which was consistent with Zhang et al. (2019). With increasing temperature, additional carbon had higher priority to be allocated to height growth (Thornley 1999; Martínez and López-Portillo 2003; Vizcaíno-Palomar et al. 2017; Fortin et al. 2019). Vizcaíno-Palomar et al. (2017) reported that under a warmer climate, Pinus halepensis Mill. and Pinus pinaster Aiton trees would be taller which corresponded to what was found in our study which showed that MAT had a positive effect on tree height. Warm summers can prolong the growing season and lead to an increase in radial growth (Zhang et al. 2017). However, excessive high temperature in summer may lead to aridity, by aggravating evaporation and transpiration, which will lead to the decrease of soil water-use efficiency, thus inhibiting radial growth (Allen et al. 2015; Chen et al. 2018). Trees tend to allocate more resources to belowground growth rather than height growth when water is lacking (Schwinning and Ehleringer 2001). In addition, in the current study, variables associated with temperature were included in the model (Table 6), which was consistent with previous studies (Wang et al. 2006; Zhang et al. 2019) indicating that temperature was the key variable influencing height-diameter relationships in humid environments with sufficient moisture.
4.3 Scale parameter in height-diameter allometry
The scale parameter (b) in tree height-diameter allometry has been debated from theoretical and empirical perspectives (Niklas 1993; Henry and Aarssen 1999; Hulshof et al. 2015). McMahon and Kronauer (1976) discussed the three competing models to describe the scale parameter in plant height and diameter allometry (McMahon and Kronauer 1976) (Table 7). In this study, we found the estimated scale parameter value in height-diameter allometry was close to 0.5, and it almost remained constant in four study sites (Zhang et al. 2019). But other studies reported different sites because of different weather conditions may affect the estimated scale parameter value (Pilli et al. 2006; Vizcaíno-Palomar et al. 2017). Zeide and Vanderschaaf (2002) found that the scale was 0.7374 in normal height-diameter relationship for loblolly pine plantations. The large scale parameter value in the exponent confers comparatively small safety factors against elastic buckling due to the influence of gravity on plant mass. Niklas (1993) drew a conclusion that the estimated scale parameter value for gymnosperm trees was 0.43 and the scale parameter value of gymnosperm and dicotyledonous trees was 0.538. McMahon and Kronauer (1976) showed that stress similarity and elastic similarity was the representative strategy of woody plants (gymnosperm and dicotyledonous trees) and geometric similarity reflected the strategy of non-woody plants (pteridophytes). In this study, the estimated scale parameter value was 0.54 which was close to expectations from the stress-similarity model.
5 Conclusions
In our paper, BMA and SR methods were used to model tree height-diameter allometry of Chinese fir plantations. The SR model had the same set of variables as the model with the third highest posterior probability developed via BMA, and SR method included bigger number of variables in the model than the best BMA model, although the model performance was equal. The SR method does not consider the uncertainty associated with model selection. Compared with the SR method, BMA had a higher probability of not selecting potentially redundant variables (MCMT and WMMT) and therefore incorporated more parsimonious models. The difference in model performance was generally negligible. Nonetheless, BMA did noticeably produce estimates with narrower intervals around the parameter estimates.
Tree height was influenced by both stand and climate variables. Trees planted in higher density and better sites were taller than those planted in lower density and poor sites. Tree height increased with increasing MAT whereas decreased with increasing SMMT. Temperature was the pivotal climate variable in shaping height-diameter allometry of Chinese fir. In addition, the estimated scale parameter value was around 0.54 which was close to the expectations from the stress-similarity theory.
Acknowledgements
The study was supported by the National Natural Science Foundation of China (No. 31670634, 31971645) and the Young Elite Scientists Sponsorship Program of the National Forestry and Grassland Administration (2019132605). The authors also would like to thank Dr. Aiguo Duan for the field work.
References
Allen CD, Breshears DD, McDowell NG (2015) On underestimation of global vulnerability to tree mortality and forest die-off from hotter drought in the Anthropocene. Ecosphere 6: 1–55. https://doi.org/10.1890/ES15-00203.1.
Baskerville GL (1972) Use of logarithmic regression in the estimation of plant biomass. Can J For Res 2: 49–53. https://doi.org/10.1139/x72-009.
Box GEP, Tiao GC (1973) Bayesian inference in statistical analysis. Addison-Wesley, Reading, MA.
Bullock BP, Boone EL (2007) Deriving tree diameter distributions using Bayesian model averaging. For Ecol Manage 242: 127–132. https://doi.org/10.1016/j.foreco.2007.01.024.
Calama R, Montero G (2004) Interregional nonlinear height diameter model with random coefficients for stone pine in Spain. Can J For Res 34: 150–163. https://doi.org/10.1139/x03-199.
Chen B, Wen X, Zhang S, Chai S, Sun H, Wang X (2018) Growth responses of Larix olgensis forests to climatic drying-warming trend in the northern mountainous region of Jilin Province, northeastern China. Journal of Beijing Forestry University 40: 22–30. [in Chinese].
Crecente-Campo F, Tomé M, Soares P, Diéguez-Aranda U (2010) A generalized nonlinear mixed-effects height-diameter model for Eucalyptus globulus L. in northwestern Spain. For Ecol Manage 259: 943–952. https://doi.org/10.1016/j.foreco.2009.11.036.
Curtis RO (1966) Height-diameter and height-diameter-age equations for second-growth douglas-fir. Forest Sci 13: 365–375.
Dong L, Xiong L, Wan M (2011) Uncertainty analysis of hydrological modeling using the Bayesian model averaging method. J HydrauL Eng 42: 1065–1074. [in Chinese].
Draper D (1995) Assessment and propagation of model uncertainty. J R Stat Soc 57: 45–70. https://doi.org/10.1111/j.2517-6161.1995.tb02015.x.
Fang Z, Bailey RL (1998) Height-diameter models for tropical forests on Hainan Island in southern China. For Ecol Manage 110: 315–327. https://doi.org/10.1016/S0378-1127(98)00297-7.
Feldpausch TR, Banin L, Phillips OL, Baker TR, Lewis SL, Quesada CA, Affum-Baffoe K, Arets EJMM, Berry NJ, Bird M, Brondizio ES, de Camargo P, Chave J, Djagbletey G, Domingues TF, Drescher M, Fearnside PM, França MB, Fyllas NM, Lopez Gonzalez G, Hladik A, Higuchi N, Hunter MO, Iida Y, Salim KA, Kassim AR, Keller M, Kemp J, King DA, Lovett JC, Marimon BS, Marimon-Junior BH, Lenza E, Marshall AR, Metcalfe DJ, Mitchard ETA, Moran EF, Nelson BW, Nilus R, Nogueira EM, Palace M, Patiño S, Peh KS-H, Raventos MT, Reitsma JM, Saiz G, Schrodt F, Sonké B, Taedoumg HE, Tan S, White L, Wöll H, Lloyd J (2011) Height-diameter allometry of tropical forest trees. Biogeosciences 8: 1081–1106. https://doi.org/10.5194/bg-8-1081-2011.
Fortin M, Van Couwenberghe R, Perez V, Piedallu C (2019) Evidence of climate effects on the height-diameter relationships of tree species. Ann For Sci 76, article id 1. https://doi.org/10.1007/s13595-018-0784-9.
Freedman DA, Navidi WC, Peters SC (1988) On the impact of variable selection in fitting regression equations. In: Dijkstra TK (ed) On model uncertainty and its statistical implications. Lect Notes Econ Math 307. Springer, Berlin, Heidelberg. https://doi.org/10.1007/978-3-642-61564-1_1.
Furnival GM, Wilson RW (1974) Regressions by leaps and bounds. Technometrics 16: 499–511. https://doi.org/10.1080/00401706.1974.10489231.
Genell A, Nemes S, Steineck G, Dickman PW (2010) Model selection in medical research: a simulation study comparing Bayesian model averaging and stepwise regression. BMC Med Res Methodol 10, article id 108. https://doi.org/10.1186/1471-2288-10-108.
Henry HAL, Aarssen LW (1999) The interpretation of stem diameter-height allometry in trees: biomechanical constraints, neighbor effects or biased regression? Ecol Lett 3: 89–97. https://doi.org/10.1046/j.1461-0248.1999.22054.x.
Huang S, Titus SJ (1994) An age-independent individual tree height prediction model for boreal spruce-aspen stands in Alberta. Can J For Res 24: 1295–1301. https://doi.org/10.1139/x94-169.
Huang S, Titus SJ, Wiens DP (1992) Comparison of nonlinear height-diameter functions for major Alberta tree species. Can J For Res 22: 1297–1304. https://doi.org/10.1139/x92-172.
Hulshof CM, Swenson NG, Weiser MD (2015) Tree height-diameter allometry across the United States. Ecol Evol 5: 1193–1204. https://doi.org/10.1002/ece3.1328.
Kass RE, Raftery AE (1995) Bayes factors. J Am Stat Assoc 90: 773–795. https://doi.org/10.1080/01621459.1995.10476572.
King DA (1990) The adaptive significance of tree height. Am Nat 135: 809–828. https://doi.org/10.1086/285075.
Li Y, Deng X, Huang Z, Xiang W, Yan W, Lei P, Zhou X, Peng C (2015) Development and evaluation of models for the relationship between tree height and diameter at breast height for Chinese-fir plantations in subtropical China. PLoS One 10, articleid e0125118. https://doi.org/10.1371/journal.pone.0125118.
Lipkovich IA (2002) Bayesian model averaging and variable selection in multivariate ecological models. Thesis Doctor of Philosophy, Virginia Polytechnic Institute and State University, Blacksburg, Virginia.
Liu X, Silins U, Lieffers VJ, Man R (2003) Stem hydraulic properties and growth in lodgepole pine stands following thinning and sway treatment. Can J For Res 33: 1295–1303. https://doi.org/10.1139/x03-061.
Lu L, Wang H, Chhin S, Duan A, Zhang J, Zhang X (2019) A Bayesian Model Averaging approach for modelling tree mortality in relation to site, competition and climatic factors for Chinese fir plantations. For Ecol Manage 440: 169–177. https://doi.org/10.1016/j.foreco.2019.03.003.
Maindonald JH, Braun WJ (2015) Data analysis and graphics using R. Cambridge University Press, Cambridge, UK.
Martínez AJ, López-Portillo J (2003) Allometry of Prosopis glandulosa var. torreyana along a topographic gradient in the Chihuahuan desert. J Veg Sci 14: 111–120. https://doi.org/10.1111/j.1654-1103.2003.tb02133.x.
McMahon TA, Kronauer RE (1976). Tree structures: deducing the principle of mechanical design. J Theor Biol 59: 443–466. https://doi.org/10.1016/0022-5193(76)90182-X.
Mensah S, Pienaar OL, Kunneke A, Toit BD, Seydack A, Uhl E, Pretzsch H, Seifert T (2018) Height-diameter allometry in South Africa’s indigenous high forests: assessing generic models performance and function forms. For Ecol Manage 410: 1–11. https://doi.org/10.1016/j.foreco.2017.12.030.
Mu Y, See I, Edwards JR (2019) Bayesian model averaging: improved variable selection for matched case-control studies. Epidemiol Biostat Public Health 16, article id e13048.
Murphy M, Wang D (2001) Do previous birth interval and mother’s education influence infant survival? A Bayesian model averaging analysis of Chinese data. Popul Stud 55: 37–47. https://doi.org/10.1080/00324720127679.
Niklas KJ (1993) The scaling of plant height: a comparison among major plant clades and anatomical grades. Ann Bot 72: 165–172. https://doi.org/10.1006/anbo.1993.1095.
Pendry CA, Proctor J (1997) Altitudinal zonation of rain forest on Bukit Belalong, Brunei: soils, forest structure and floristics. J Trop Ecol 13: 221–241. https://doi.org/10.1017/S0266467400010427.
Picard N, Henry M, Mortier F, Trotta C, Saint-André L (2012) Using Bayesian model averaging to predict tree aboveground biomass in tropical moist forests. For Sci 58: 15–23. https://doi.org/10.5849/forsci.10-083.
Pilli R, Anfodillo T, Carrer M (2006) Towards a functional and simplified allometry for estimating forest biomass. For Ecol Manage 237: 583–593. https://doi.org/10.1016/j.foreco.2006.10.004.
Pretzsch H (2010) Re-evaluation of allometry: state-of-the-art and perspective regarding individuals and stands of woody plants. Prog Bot 77: 339–369. https://doi.org/10.1007/978-3-642-02167-1_13.
Prost L, Makowski D, Jeuffroy MH (2008) Comparison of stepwise selection and Bayesian model averaging for yield gap analysis. Ecol Modell 219: 66–76. https://doi.org/10.1016/j.ecolmodel.2008.07.026.
R Development Core Team (2018) R: a language and environment for statistical computing. R Foundation for Statistical Computing, Vienna, Austria. ISBN 3-900051-07-0.
Raftery AE (1995) Bayesian model selection in social research (with discussion). Sociol Methodol 25: 111–163. https://doi.org/10.2307/271063.
Raftery AE (1996) Approximate Bayes factors and accounting for model uncertainty in generalised linear models. Biometrika 83: 251–266. https://doi.org/10.1093/biomet/83.2.251.
Raftery AE, Madigan D, Hoeting JA (1997) Bayesian model averaging for linear regression models. J Am Stat Assoc: 179–191. https://doi.org/10.1080/01621459.1997.10473615.
Raftery AE, Painter IS, Volinsky CT (2005) BMA: an R package for Bayesian model averaging. R News 5: 2–8.
Sánchez CAL, Varela JG, Dorado FC, Alboreca AR, Soalleiro RR, González JGÁ, Rodríguez FS (2003) A height-diameter model for Pinus radiata D. Don in Galicia (Northwest Spain). Ann For Sci 60: 237–245. https://doi.org/10.1051/forest:2003015.
SAS Institute (2011) SAS/STAT 9.3 user’s guide. SAS Institute, Cary, NC.
Schwinning S, Ehleringer JR (2001) Water use trade-offs and optimal adaptations to pulse-driven arid ecosystems. J Ecol 89: 464–480. https://doi.org/10.1046/j.1365-2745.2001.00576.x.
SFA (2013) Reports of Chinese forestry resource, the 8th national forest resource inventory.Chinese Forestry Publishing House, Beijing. [in Chinese].
Sharma M, Parton J (2007) Height-diameter equations for boreal tree species in Ontario using a mixed-effects modeling approach. For Ecol Manage 249: 187–198. https://doi.org/10.1016/j.foreco.2007.05.006.
Tewari V, Gadow K (1999) Modelling the relationship between tree diameters and heights using SBB distribution. For Ecol Manage 119: 171–176. https://doi.org/10.1016/S0378-1127(98)00520-9.
Thornley JHM (1999) Modelling stem height and diameter growth in plants. Ann Bot 84: 195–205. https://doi.org/10.1006/anbo.1999.0908.
Verbeeck H, Samson R, Verdonck F, Lemeur AR (2006) Parameter sensitivity and uncertainty of the forest carbon flux model forug: a monte carlo analysis? Tree Physiol 26: 807–817. https://doi.org/10.1093/treephys/26.6.807.
Viallefont V, Raftery AE, Richardson S (2001)Variable selection and Bayesian model averaging in case-control studies. Stat Med 20: 3215–3230. https://doi.org/10.1002/sim.976.
Vizcaíno-Palomar N, Ibáñez I, Benito-Garzón M, González-Martínez SC, Zavala MA, Alía R (2017) Climate and population origin shape pine tree height-diameter allometry. New Forest 48: 363–379. https://doi.org/10.1007/s11056-016-9562-4.
Volinsky CT, Madigan D, Raftery AE, Kronmal RA (1997) Bayesian model averaging in proportional hazard models: assessing the risk of a stroke. J R Stat Soc C-appl 46: 433–448. https://doi.org/10.1111/1467-9876.00082.
Wang D, Zhang W, Bakhai A (2004) Comparison of Bayesian model averaging and stepwise methods for model selection in logistic regression. Stat Med 23: 3451–3467. https://doi.org/10.1002/sim.1930.
Wang T, Hamann A, Spittlehouse DL, Murdock TQ (2012) ClimateWNA-high-resolution spatial climate data for western North America. J Appl Meteorol Clim51: 16–29. https://doi.org/10.1175/JAMC-D-11-043.1.
Wang X, Fang J, Tang Z, Zhu B (2006) Climatic control of primary forest structure and DBH-height allometry in Northeast China. For Ecol Manage 234: 264–274. https://doi.org/10.1016/j.foreco.2006.07.007.
Wintle BA, McCarthy MA, Volinsky CT, Kavanagh RP (2003) The use of Bayesian model averaging to better represent uncertainty in ecological models. Conserv Biol 17: 1579–1590. https://doi.org/10.1111/j.1523-1739.2003.00614.x.
Wu Z (1984) Chinese fir. China Forestry Press, Beijing. [in Chinese].
Yuan X, Li J (2012) Height, DBH growth models of fir artificial foreston northern and southern slopes. Journal of Northwest Forestry University 27: 180–183. [in Chinese].
Zapata-Cuartas M, Sierra CA, Alleman L (2012) Probability distribution of allometric coefficients and Bayesian estimation of aboveground tree biomass. For Ecol Manage 277: 173–179. https://doi.org/10.1016/j.foreco.2012.04.030.
Zeide B (1993) Analysis of growth equations. For Sci 39: 594–616. https://doi.org/10.1093/forestscience/39.3.594.
Zeide B, Vanderschaaf C (2002) The effect of density on the height-diameter relationship. Proceedings of the eleventh biennial southern silvicultural research conference In: Outcalt KW (ed) Proceedings of the eleventh biennial southern silvicultural research conference. Gen Tech Rep SRS-48. U.S. Department of Agriculture, Forest Service, Southern Research Station,Asheville, NC.
Zhang X, Duan A, Zhang J, Xiang C (2014) Estimating tree height-diameter models with the Bayesian method. The Sciencetific World Journal, article id 683691. https://doi.org/10.1155/2014/683691.
Zhang X, Cao QV, Duan A, Zhang J (2017) Modeling tree mortality in relation to climate, initial planting density, and competition in Chinese fir plantations using a Bayesian logistic multilevel method. Can J For Res 47: 1278–1285. https://doi.org/10.1139/cjfr-2017-0215.
Zhang X, Chhin S, Fu L, Lu L, Duan A, Zhang J (2019). Climate-sensitive tree height-diameter allometry for Chinese fir in southern China. Forestry 92: 167–176. https://doi.org/10.1093/forestry/cpy043.
Zhang Z, Peng W, Zhou Y (2007) Bayesian model averaging and its application in logistic regression model. Chinese Journal of Health Statistics 24: 467–471. [in Chinese].
Total of 67 references.
