Blas Mola-Yudego  ,
Gianni Picchi,
Dominik Röser,
Raffaele Spinelli
,
Gianni Picchi,
Dominik Röser,
Raffaele Spinelli
Assessing chipper productivity and operator effects in forest biomass operations
Mola-Yudego B., Picchi G., Röser D., Spinelli R. (2015). Assessing chipper productivity and operator effects in forest biomass operations. Silva Fennica vol. 49 no. 5 article id 1342. https://doi.org/10.14214/sf.1342
Highlights
- A model is constructed to assess the productivity in chipping of wood biomass at roadside
- The data includes 172 trials and 67 operators in Italy
- The operator effect was included in a mixed model approach
- The R2 were 0.76 (fixed part) and 0.88 (incl. operator effects).
Abstract
The present research focuses on the productivity of energy wood chipping operations at several sites in Italy. The aim was to assess the productivity and specifically the effect attributed to the operator in the chipping of wood biomass. The research included 172 trials involving 67 operators across the country that were analysed using a mixed model approach, in order to assess productivity, and to isolate the operator effect from other potential variables. The model was constructed using different predictors aiming to explain the variability due to the machines and the raw-materials. The final model included the average piece weight of raw material chipped as well as the power of the machine. The coefficients of determination (R2) were 0.76 for the fixed part of the model, and 0.88 when the effects due to the operators were included. The operators’ performance compared to their peers was established, and it was compared to a subjective classification based on the operator’s previous experience. The results of this study can help to the planning and logistics of raw material supply for bioenergy, as well as to a more effective training of future forest operators.
Keywords
mixed models;
efficiency;
comminution;
operator effect;
raw material supply;
wood chippers
-
Mola-Yudego,
School of Forest Sciences, University of Eastern Finland, P.O. Box 111, FI-80101 Joensuu, Finland; NIBIO Norwegian Institute of Bioeconomy Research, P.O. Box 115, 1431 Ås, Norway
 http://orcid.org/0000-0003-0286-0170
E-mail
blas.mola@uef.fi
http://orcid.org/0000-0003-0286-0170
E-mail
blas.mola@uef.fi
- Picchi, CNR IVALSA, Via Madonna del Piano 10, I-50019 Sesto Fiorentino, Italy E-mail picchi@ivalsa.cnr.it
- Röser, Forest Feedstocks Group, FPInnovations, Vancouver, British Columbia, Canada E-mail dominik.roser@fpinnovations.ca
- Spinelli, CNR IVALSA, Via Madonna del Piano 10, I-50019 Sesto Fiorentino, Italy E-mail spinelli@ivalsa.cnr.it
Received 26 March 2015 Accepted 2 July 2015 Published 7 September 2015
Views 89620
Available at https://doi.org/10.14214/sf.1342 | Download PDF

Supplementary Files
1 Introduction
The use of forest and agricultural biomass for energy is an increasingly important topic, in light of the recent debate on climate change and climate change mitigation (IPCC 2007; EU 2009). In Europe, forest biomass has the largest potential for providing large amounts of renewable fuel on a sustainable basis (Alakangas 2007; Röser et al. 2008). At the current state of the forest biomass development, the ambitious targets set by the EU are a great challenge for the sector, which should sustain a three-fold increase of the volume of biomass obtained when harvesting the European forests (Verkerk et al. 2011).
One of the biggest challenges to increase the use of forest biomass is the availability and proper use of suitable harvesting technology to meet the growing demand for raw material. Existing and proven solutions to harvest forest biomass have to be adapted to new working environments across Europe (Röser 2012). In this context, chipping is a crucial cost factor in the entire supply chain, and economic success is largely dependent on an economic chipping operation (e.g. Angus-Hankin 1995; Laitila 2008; Röser 2012). The most common forest biomass supply chain in Europe is based on comminuting forest biomass at roadside (Diaz-Yáñez et al. 2013) where forest biomass is chipped with either a truck mounted or a tractor-based chipper directly into the chip truck. Alternatively chips can be blown onto a pile on the ground when interaction with the transportation fleet is likely to cause considerable delay (Kanzian et al. 2009). Chipping at a plant or terminal usually results in lower chipping cost, but also in increased transportation, storage and handling costs that outweigh the eventual savings. Furthermore, chipping near settled areas is often undesirable due to the high dust and noise emissions (Kanzian et al. 2009).
In Italy, fuel chip consumption exceeds 3 million green tons per year (Itabia 2008), which motivates many local companies to produce substantial amounts of wood chips. In most cases, chips are a side-product obtained from less valuable trees and tree sections. Chipping is an important way to attach some market value to low-quality trees, branches and tree-tops.
As in any forest operation, the performance of the operators have an important effect on the overall productivity, in addition to the type and conditions of the raw materials and specifications of the machines involved (e.g. Püfurst 2010). Italian chipper operators have a long experience: many companies started chipping already in the early 1980s, when particleboard factories were the main customer. The biomass boom of recent years has determined a further development of the sector, which now counts a large number of operators and a vast, international machine fleet (Spinelli et al. 2013).
In the context of optimizing the efficiency of biomass supply chains for bioenergy, this study investigates the overall productivity of wood chipping operations in Italy, by comparing and analyzing a large number of commercial chipping operations distributed across the country. We suspect that operator performance plays a significant role in the overall efficiency of the chipping operations. Therefore, the ultimate goal of the study is to identify and quantify key variables related to chipping productivity, with special emphasis on addressing the effects due to the operators in the final productivity of the chipping operations.
2 Material and methods
2.1 Description of the trials
Data were collected from 172 trials of chipping operations conducted in Italy, distributed in 114 locations (mostly distributed in the Arno River Valley, Po River valley, Alps and Apennines). The database included sources from previous compilations (including: Spinelli and Hartsough 2001; Spinelli and Magagnotti 2010; Spinelli and Magagnotti 2011; Costa et al, 2012). Most of the trials were measured in 1996–1999, and the latest were performed in February, 2011. Data collection consisted of a classic time study, where time consumption was determined with conventional stop watches or hand-held field computers (Magagnotti and Spinelli 2012). The effective chipping time (E0) was recorded with an accuracy of 1 s. The chipping time was allocated to different activities as follows:
Chipping: time when the engine is operating, the orifice is full, comminuting wood or waiting for the next piece to be fed
Reposition: moving the chipper from different stations
Maneuvering: time used in other operations, such maneuvering the chip container or bunching material to be chipped
The raw material represented a wide array of tree species grown in Italy and included different assortments of tops and branches, un-merchantable trees and whole trees from thinning operations. An estimated total of 13 840 tonnes (t) were chipped; on average 72 green t were chipped at each trial, with a standard deviation of 71 green t (minimum 1.3 green t, maximum 318.3 green t). The total number of wood pieces chipped was also estimated for each load. The average piece size was estimated as described in Spinelli and Hartsough (2001) and it was included as one of the variables considered in the study. Other variables possibly affecting performance were also recorded including the type of assortment, location, operations involved, type and specifications of the machine, wood conditions and moisture, lay out of the wood piles, etc (Table 1). The histograms for the continuous variables (average piece size and machine power) are showed in Fig. 1 (see Appendix for a complete list of chipper models used in the trials).
| Table 1. Variables considered in the analysis and modelling stage. | ||
| Variable name | Definition and classes | |
| Size (green t) | average piece size of the raw material | |
| Power (kW) | net engine power of the chipper | |
| Season | season of the year when the trial was performed | |
| Moisture | wet ( < 40% – 60%), semi-dry ( > 30% – 40%), dry ( < 30%) | |
| Species | Pinus pinaster, P. pinea, P. adiate, P. nigra, Picea abies, Pseudotsuga menziesii, Populus sp, Quercus cerris, Q. ilex, Castanea sativa, Eucalyptus globulus, E. camaldulensis, E. occidentalis. | |
| Tree part | tops, whips, whole trees, slash | |
| Crew (N) | number of operators working at the same time, divided in 1, 2, or more than 2 | |
| Lay out of the material to be chipped | aligned, bunched, loads, stacked | |
| In feed device | multi-, rollers, table | |
| Comminuter type | discs, drums | |
| Chipper propulsion | self-propulsion, towed, tractor, truck | |
| Feeding | built-in loader, excavator-base loader, manual, self-propelled loader, tractor-mounted loader | |
| Point of comminution | at the landing, on the terrain | |
| Chip discharge | into container, onto a heap, into a trailer, into a truck or into a built-in surge bin | |
| Operator Skills | beginner | limited experience in dealing with chipper operations |
| part-time professional | the involvement of chipper operations is a secondary activity | |
| full time professional | the operator is fully qualified for chipping operations, and those conform their main activity | |
| top professional | the operator is considered to be well above the average after a subjective evaluation in situ | |
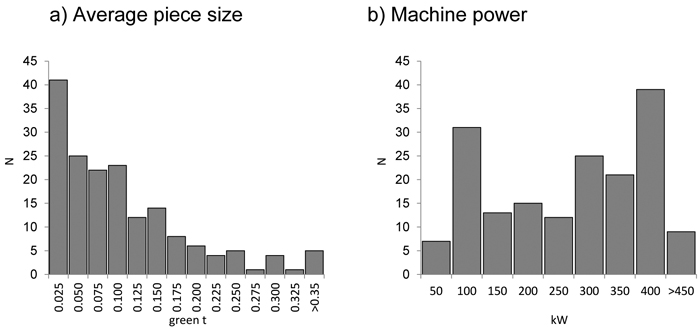
Fig. 1. Distribution of the number of trials (N) concerning a) the average piece size and b) machine power. The upper thresholds of each category are represented in the axis.
The trials involved 67 operators with different skills and experience. In general, each operator was using a specific chipper model, (N = 56), and only in a few cases the operator was using two different chipper models (N = 11). Therefore, the potential operator effect would refer to the interaction operator-machine, since most of the operators were familiar with their own machines. A subjective evaluation of the operators involved was established based on their stated experience (years on the job) and the work intensity (days of work per year). Operators were then divided into the following categories: beginner (8 operators and 14 trials), part time professional (8 operators and 10 trials), full time professional (34 operators and 70 trials) and top professional (18 operators and 78 trials) (Table 1).
2.2 Statistical methods
In a first step, the different independent variables considered were tested (ANOVA test) in order to find valid predictors for chipper productivity. After the first selection, meaningful variables were used to construct a productivity model (Table 1). The predicted variable was chipper productivity, expressed as green tonnes per hour (green t h–1). The independent variables (predictors) were chosen to reflect the type of chipper and the conditions of the raw material. All predictors had to be significant at the 0.05 level, and the residuals had to indicate a non-biased model. Alternative combinations of predictors and their transformations were evaluated.
In order to assess the effect of the operator, the chipper measurements were grouped by individual operator. The hierarchical structure of the data was addressed using a mixed model with fixed and random factors. The residual variation was therefore divided into between-operators and between-trials. Alternative combinations of the model structure were tested, with the random effect in the intercept as well as in the predictors. The Akaike and Bayesian Information Criteria (AIC and BIC) were calculated for each model combination, and were also used in the model assessment. The linear models were estimated using the restricted maximum likelihood (RSME) procedure of the statistical software SPSS v13.0.
The predicted variable was the productivity of the machine and operator expressed in green t h–1. The models made use of logarithms for both the predicted and predictor. The logarithm predictions were then converted to the arithmetic scale by using an empirical ratio estimator for bias correction in logarithmic regression proposed by Snowdon (1991), based on the mean observed value (P, productivity) and the mean of the back-transformed predicted values resulting from the logarithmic regression.
The equations tested were evaluated quantitatively by examining the magnitude and distribution of the residuals for all possible combinations of variables, aiming at detecting obvious dependencies or patterns that indicate systematic discrepancies. The residues were grouped in tiles to facilitate the visual analysis. In order to determine the accuracy of the predictions, absolute and relative biases and root mean square errors (RMSEs) were calculated.
The error terms (the random factor based on the operator μo, and the remaining variability eoj) were tested against the variables considered in the first step, also using ANOVA.
3 Results
The average productivity of the chippers ranged from 1 to 91.04 green t h–1 (Table 2). Although most of the variables evaluated showed significance levels to explain the productivity at various degrees, there were evident confounding factors (Table 3).
| Table 2. Mean, standard error (S.E.) and range of the variables included in the model. (Ntrials = 172, Noperators = 70). P is expressed in pmh (productive machine hours). Size: Average piece size, Power: Chipper power, P: Productivity. | ||||
| Minimum | Maximum | Mean | S.E. | |
| Size (green t) | 0.002 | 0.70 | 0.10 | 0.01 |
| Power (kW) | 22 | 1074 | 251.97 | 11.55 |
| P (green t h–1) | 0.97 | 91.04 | 16.37 | 0.91 |
| Table 3. Resulting p-values based on ANOVA test for the effect of the variables considered on chipper productivity (P), and on the resulting between-operator (μo) and between-trial random factor (eot), as calculated in the model constructed. | |||
| P | μo | eot | |
| Season | 0.005 | 0.862 | 0.301 |
| Moisture | 0.185 | 0.081 | 0.140 |
| Species | <0.001 | <0.001 | 0.810 |
| Tree part | <0.001 | 0.094 | 0.621 |
| Operator Skills | <0.001 | <0.001 | 0.339 |
| Crew (N) | <0.001 | 0.608 | 0.398 |
| Lay Out | <0.001 | 0.378 | 0.189 |
| In feed | 0.002 | 0.002 | 0.081 |
| Comminuter | <0.001 | 0.378 | 0.189 |
| Propulsion | <0.001 | 0.027 | 0.686 |
| Feeding | <0.001 | 0.024 | 0.184 |
| Point of comminution | 0.322 | 0.013 | 0.253 |
| Chip discharge | <0.001 | <0.001 | 0.581 |
After the preliminary analysis, the performance of the chippers was modeled according to:
where P was the productivity of the machine used by operator o in trial t, (green t h–1), β0- β2 are parameters, Power is the net power of the machine used by operator o in trial t (kW), Size is the average size of raw material fed to the chipper (green t). Subscripts o, and t refer to operator and trial, respectively. μo, is the between-operator random factor, independent and identically distributed with mean = 0and constant variance (σ2operator). Finally, eot is the between-trial random factor for the machine managed by operator o in trial t, with mean equal to 0and variance equal to σ2trial.
After the models were fitted using the variables selected in each case, no other additional variable was significant or improved significantly the prediction power of the models. An interaction between both variables was tested, having no significant effects. Finally, alternative model structures with additional random effects in the predictors were tested. When the random factor was included in the slope, it proved significant and presented a lower AIC (125 vs 130) and BIC (131 vs 136). However, it did not improve the predictive power of the model (R2 0.85 to 0.88). The rest of the combinations resulted in all cases in higher AIC and BIC and lower predictive power.
The variables selected were highly significant (Table 4) and did not show strong collinearity (R = 0.684, VIF = 1.880). The model explained most of the variability as the coefficients of determination (R2) of the back transformed data were 0.76 for the fixed part of the model, and 0.88 when the effects due to the operators were included (Table 5). The estimated bias for the back-transformed estimates was 1.0056.
| Table 4. Estimates, standard error (S.E.) and significance level of the parameters and variance components of the model constructed. | |||||
| Parameter | S.E. | df | t | p value | |
| Model 1 | |||||
| Intercept | –1.079 | 0.386 | 153.1 | –2.792 | 0.006 |
| lnPOWER | 0.829 | 0.064 | 118.1 | 13.012 | <0.001 |
| lnSIZE | 0.308 | 0.032 | 150.4 | 9.701 | <0.001 |
| (Wald Z) | |||||
| σtrial | 0.070 | 0.010 | 7.062 | <0.001 | |
| σoperator | 0.086 | 0.024 | 3.606 | <0.001 | |
| Table 5. Absolute and relative bias and RMSEs, of the fixed part of the model. Coefficient of determination (R2) of the data transformed and back-transformed for the fixed part and including the operator effect. | ||
| parameter | value | |
| bias (green t h–1) | –0.006 | |
| bias (%) | –0.221 | |
| RMSE | 0.386 | |
| RMSE (%) | 15.414 | |
| Ln scale | back-transformed | |
| R2(fixed part) | 0.85 | 0.76 |
| R2 | 0.94 | 0.88 |
A significant part of the variability was explained by the operator effect included in the random term. This random effect was partially explained by the operator skills, the species, the chip discharge (Table 3). The estimated standard deviations were 0.293 and 0.265 for between-operator and between-trial error terms.
The bias of the fixed part of the model was examined by plotting the residuals as a function of the predicted variable and predictors of the model (Fig. 2). Small deviations or lack of fit were observed for the lowest and highest productivity ranges, which are made of fewer observations. Concerning the variables, no obvious dependencies or patterns that indicate systematic trends among the residuals and the independent variables were found in the intermediate productivity ranges. It should be taken into account, however, that part of the residual variation of the fixed part of the model is explained by the variability due to the operators included in the random factor. Fig. 3 shows the measured and predicted values from the model.
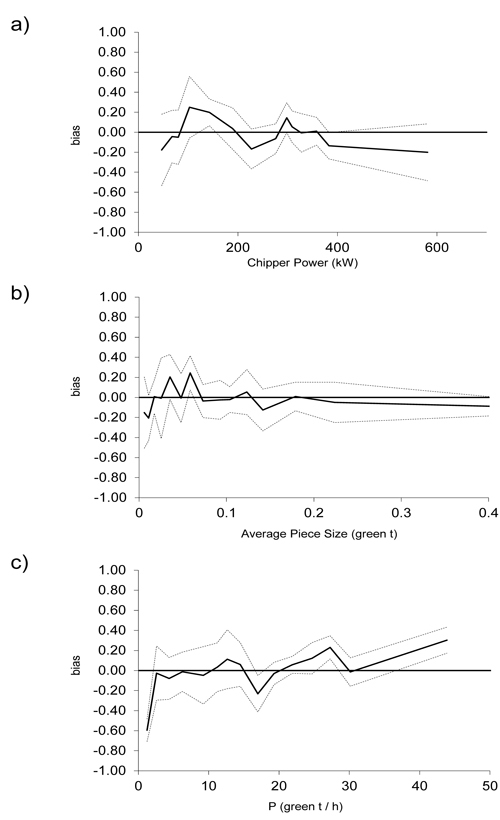
Fig. 2. Mean residuals of the fixed part of the chipper productivity (P) model in green tonnes chipped per hour, as a function of the predicted values, and the variables included: chipper power and average piece size. The mean residuals were grouped in 15 tiles of equal number of observations and dotted lines indicate the 2 x standard error of the mean. The data has been back-transformed and corrected.
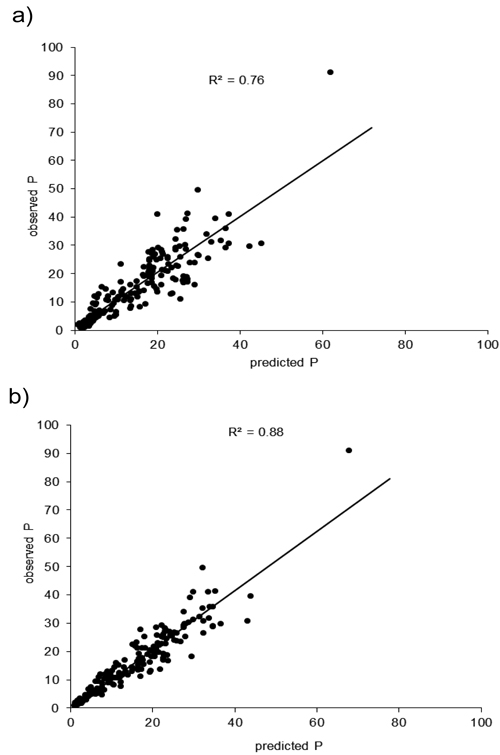
Fig. 3. Predicted and observed estimates resulting from the suggested chipper productivity model, for the fixed effects part a) and the total estimates b). The data was back-transformed and corrected for possible bias. Productivity (P) is measured in green t h–1.
Including the operator effect in the simulations (Fig. 4) can result in great differences in the performance of the operators. The estimated between-operators random factor μo was compared to the classification of the operators according to their previous experience. The ANOVA test was significant (p-value 0.001) and the subsequent Duncan test found differences between the group “beginner” and the rest of the groups half-time, full-time, and top professionals (Fig. 5).
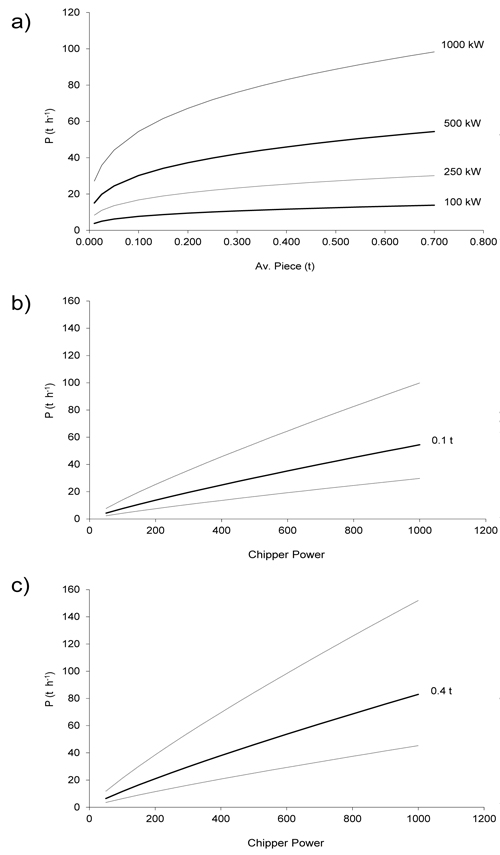
Fig. 4. a) Estimated chipper productivity (P) as a function of average piece size (green t), b) and c) as a function of chipper power (kW). Dotted lines include the operator effect for a given piece size (0.1 or 0.4 green t / piece) and chipper power. This effect was treated as a random effect and the lines include the 95% of the variability due to the operators. The data was back-transformed.
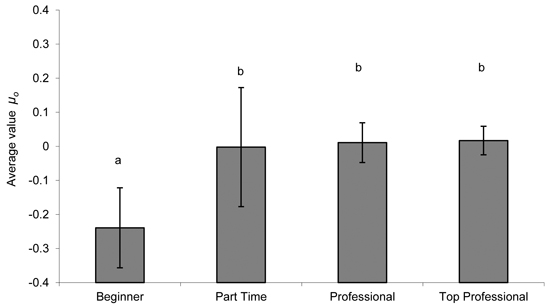
Fig. 5. xAverage values of the operator random factor (µo), compared to their previous experience with chipping. (Values of µo are not back transformed. Lines represent 2 x standard errors of the means. Letters represent the grouping subset resulting of a Duncan test).
4 Discussion
The paper deals with a comprehensive productivity analysis of energy wood chipping operations conducted at several sites in Italy. In general, the productivity figures in this study are comparable with those reported in other studies in Italy, (Spinelli et al. 2011) and in other parts of Europe (Asikainen and Pulkkinen 1998; Lechner et al. 2007; Cremer 2009; Röser et al. 2012). Chipping operations are affected by many factors that often interact, making analysis difficult. These factors include the raw material type, the machine characteristics and the operator proficiency. The purpose of this study was to generate a valid model that would focus mainly on the most relevant variables to explain productivity in order to simplify the analysis and to isolate the effect of the operators’ efficiency as much as possible. There were, however, some limitations in the data used, as not all the possible variables that could affect productivity were properly recorded, and there were differences in the set-up of the trials that required standardization. For instance, the moisture content was only calculated with precision in some cases, whereas in other it was provided in a qualitative value. This, on the other hand, was used in the same way in previous research (e.g. Spinelli and Hartsough 2001; Costa et al, 2012) and the large dataset of operations and time studies used in the analysis can to a certain extent compensate those limitations and provide a solid basis for modelling.
Our analysis indicated that tree species may have only a minor effect on chipping productivity, as was also noted by Spinelli et al. (2011) and Röser et al. (2012). In contrast, it highlighted the crucial role of piece size, which was already addressed by Asikainen et al. (2001), Spinelli and Hartsough (2001) and Röser et al, (2012) as one of the key elements of chipping productivity. The piece size characterizes the different tree parts (i.e. stems vs. branches or whole trees), which is a relevant variable that explains differences in the productivity as observed in Magagnotti and Spinelli (2011) and Spinelli et al. (2011). On a similar note, Van Belle (2006) concluded that raw material characteristics have a significant effect on chipping productivity. In Finland Röser et al, (2012) explained the large differences of chipping productivity among different chippers as partly due to the differences in raw material. Finally, the predictions based on the model proposed in this study offer similar results to Asikainen et al. (2001).
Concerning the particle size of the chips produced was not recorded in the different trials, and could not therefore be included in the analysis. Röser et al. 2012 observed important effects in the chipper productivities concerning the use of different sieves between Finland and Austria. In the Finnish case, the sieves were 80 × 80 mm, resulting in larger chips and in higher producitivies. In the case of Austria and southern Germany, the demand of fine sized chips by the district heating plants resulted in lower productivities. In this case, however, the data comes from a single country and it is expected the use of similar sieves and similar chip size standards. Spinelli at al. (2005) made an analysis of chip size distribution for district plants in Italy, testing machines from 80 to 331 kw. The results showed that 95–99% of the chips were in the 3–45 mm range. Although the addition of variables related to the chip distribution could help explain the productivity, the performance of the models suggests that their contribution can be limited in this case.
In general, it is assumed that productivity has a non-linear relationship with piece size (e.g. Spinelli et al. 2002; Jirousek et al, 2007). This relationship has been modeled using the logarithm transformation, which has improved the predictive power of the model, and reduced the effect of outliers. However, there was noticed a small lack of fit in the predictions concerning the lowest and highest productivity ranges, which could be attributed to outliers, as there are fewer observations in those ranges. At the same time, logarithm transformations can produce a bias in the estimates and in the random effect used to model operator proficiency, due to the back-transformation of the predictions. Nevertheless, it can be assumed that both the magnitudes and the relative positions between-operators would be preserved.
In fact, the estimation of a between-operator random factor in the overall efficiency is of great interest. Previous studies have assumed that “operator effect” has a strong impact on operational performance, due to individual differences in technique, motor skills, work-planning capacity, decision-making abilities and general experience (Ovaskainen et al. 2004). Research conducted in Finland on forest harvesters showed that the standard deviation between different operators accounted for 11.8% of the mean, and that productivity could vary by as much as 18.7% when processing 100 dm3 trees (processed data from Ovaskainen et al. 2004). A similar study on Finnish harvester operations observed maximum productivity differences between individual operators in the range of 20–40%, depending of the complexity of the methods used (Kärhä et al. 2004). These figures are to a certain extent compatible with those obtained in our study for chipping operations. At the same time, while previous studies identified and quantified the operator effect on the productivity, the present study adds the advantage of explicitly including this effect in the modeling approach.
The modeling approach includes the general variability due to operators expressed as an error term, which can only be estimated given a large sample of trials and operators. In this study, we combine data from previous studies (e.g. Spinelli and Hartsough 2001; Spinelli and Magagnotti 2010; Costa et al, 2012) as well as new records, making it an interesting database for study. Since only trials from the same country are considered, it reduces the potential effect of the operational environment attributed in other studies (Röser et al 2010; Röser, 2012) as deals with similar procedures, quality standards and overall conditions along the trials. This facilitates the estimation of the operator random effects, which in fact explains many variables traditionally included in performance studies (e.g. Spinelli and Hartsough 2001; Spinelli and Magagnotti 2010) as none of them contributed to explain the residual variation of the model. The resulting estimate of the operator effect as an error term can have important applications in stochastic simulation and in realistic estimates of productivity ranges in specific conditions.
It must be considered, however, that most of the operators were using only one or two machines, and therefore, the operator effect includes some between-machine variability. This is a limitation of the study, although it is a reasonable assumption to investigate the operator effect with operators that are familiar with a limited number of machines, as it reflects conventional practices in reality. At the same time, many machines were used by different operators, which would demand further analysis. Although the dataset used was large, the inclusion of an additional between-machine random factor would result in more complex modelling approach that would require a larger dataset (i.e. same operator using different machines, and same machine used by different operators). The operator effect modelled has to be considered to a certain extent as an operator-machine interface, as it includes potential differences in the performance of the machines, in addition to the skills and experience of the operators. Arguably, the absolute differences between machine performance (i.e. differences in performance between machines with the same power) would be smaller. In addition, since the operators take care of the maintenance of their machines, this effect would be included in the between-operator variability and should not essentially affect the main findings of the study.
The modeling approach can realize the specific productivity ranking for a given operator with its usual machine, and can estimate individual performance (whereas above or below the average) for a given machine power and tree size while using very few observations. The following analysis of the specific operator values revealed that there were no significant differences between operator groups concerning their overall experience, as long as they had been professionally trained. The main differences were found between non-professional operators (beginners) and the rest, underlining the difficulty of judging performance a priori.
A direct outcome of this study could be the development of guidelines for successful chipper operations, especially what concerns operation layout, rate setting and operator training. A model that integrates operator effect could be used to make a first distinction between above-average and below-average operators, and then use this distinction to conduct detailed observation of above-average operators in order to define what makes a proficient chipper operator. This information could then be transferred to the other operators through courses and publications. Further studies conducted under controlled conditions may help gauging with more accuracy the magnitude of the operator effect in chipping operations, and to develop better explanatory models concerning their productivity.
5 Conclusions
The study presents a large dataset of chipping trials, to model the productivity of the chipping operations. The main variables used to model the productivity are the power of the machines, the average size of the raw materials and the operator skills, which encapsulate most of the variability. Alternative variables considered (included other raw material and site conditions, or machine parameters) did not significantly add to the explicability nor the predictability power of the model.
The operator effect accounts for a significant part of the variability, and therefore is a crucial factor to be included in the analysis. Mixed models show that are fundamental tools to include the operator effect in the modeling approach, and in their application in this study result in the parametrization of the operator effect that can be used in e.g. simulation studies. The following analysis of the resulting operator values revealed that there were not differences between operator groups concerning their overall experience, as long as they had been professionally trained.
Acknowledgements
We would like to thank the funding received from the STSM programme of Action COST FP0902.
References
Alakangas E., Heikkinen A., Lensu T., Vesterinen P. (2007). Biomass fuel trade in Europe – summary report. VTT-R-03508-07. EUBIONET II-project. VTT Technical Research Centre of Finland, Jyväskylä.
Angus-Hankin C., Stokes B., Twaddle A. (1995). The transportation of fuel wood from forest to facility. Biomass and Bioenergy 9(1–5): 191–203. http://dx.doi.org/10.1016/0961-9534(95)00091-7.
Asikainen A., Pulkkinen P. (1998). Comminution of logging residues with Evolution 910R chipper, MOHA chipper truck, and Morbark 1200 tub grinder. International Journal of Forest Engineering 9: 47–53. http://dx.doi.org/10.1080/08435243.1998.10702711.
Asikainen A., Laitila J., Ranta T., Hämäläinen J. (2001). Hakkutähdehakkeen kustannustekijät ja suurimittakaavainen hankinta. University of Joensuu, Faculty of Forestry. Research Notes 131. 107 p.
Costa C., Menesatti P., Spinelli R. (2012). Performance modelling in forest operations through partial least square regression. Silva Fennica 46(2): 241–252. http://dx.doi.org/10.14214/sf.57.
Cremer T. (2008). Bereitstellung von Holzhackschnitzeln durch die Forstwirtschaft: Produktivitätsmodelle als Entscheidungsgrundlage über Verfahren und Aushaltungsvarianten, entwickelt auf der Basis einer Metaanalyse. Doctoral dissertation, Universitätsbibliothek Freiburg. [In German].
Díaz-Yáñez O., Mola-Yudego B., Anttila P., Röser D., Asikainen A. (2013). Forest chips for energy in Europe: current procurement methods and potentials. Renewable and Sustainable Energy Reviews. 21: 562–571. http://dx.doi.org/10.1016/j.rser.2012.12.016.
European Commission (2009). EU action against climate change – leading global action to 2020 and beyond. Office for Official Publications of the European Communities, Luxembourg. 32p.
IPCC (2007). IPCC Fourth assessment report: Climate change 2007 (AR4). Intergovernmental Panel on Climate Change. Cambridge University Pres.
Itabia (2008). I traguardi dell bioenergia in Italia. Rapporto 2008. Ministero dell’Ambiente e della Tutela del Territorio e del Mare, Roma. 111 p. http://www.itabia.it/pdf/rapporto2008ita.pdf. [Cited 16 December 2010].
Jiroušek R., Klvač R., Skoupý A. (2007). Productivity and costs of the mechanised cut-to-length wood harvesting system in clear-felling operations. Journal of Forest Science 53(10): 476–482.
Kanzian C., Holzleitner F., Stampfer K., Ashton S. (2009). Regional energy wood logistics – optimizing local fuel supply. Silva Fennica 43(1): 113–128. http://dx.doi.org/ 10.14214/sf.46.
Kärhä K., Rönkkö E., Gumse S.I. (2004). Productivity and cutting costs of thinning harvesters. International Journal of Forest Engineering 15(2): 3–55. http://dx.doi.org/10.1080/14942119.2004.10702496.
Laitila J. (2008). Harvesting technology and the cost of fuel chips from early thinnings. Silva Fennica 42(2): 267–283. http://dx.doi.org/10.14214/sf.256.
Lechner H., Cremer T., Becker G., Willems S. (2007). Die Qual der Wahl: Hacken im Bestand oder an der Waldstrasse? (Being spoilt for choice: chipping in the stand or along the forest road?) AFZ-Der Wald, 6 Stuttgart, Germany. p. 290–293.
Magagnotti N., Spinelli R. (2012). Good practice guidelines for biomass production system. COST Action FP-0902, WG 2 Operations research and measurement methodologies. 50 p. ISBN:978-88-901660-4-4.
Ovaskainen H., Uusitalo J., Väätäinen K. (2004). Characteristics and significance of a harvester operators’ working technique in thinnings. International Journal of Forest Engineering 15(2): 67–77. http://dx.doi.org/10.1080/14942119.2004.10702498.
Purfürst F.T. (2010). Learning curves of harvester operators. Croatian Journal of Forest Engineering 31(2): 89–97.
Röser D. (2012). Operational efficiency of forest energy supply chains in different operational environments. Dissertationes Forestales 146. 83 p. http://dx.doi.org/10.14214/df.146.
Röser D., Asikainen A., Raulund-Rasmussen K., Stupak I. (eds.) (2008). Sustainable use of forest biomass for energy: a synthesis with focus on the Baltic and Nordic Region. Springer, Dordrecht, the Netherlands. 274 p. ISBN 978-1-4020-5054-1.
Röser D., Mola-Yudego B., Prinz R., Emer B., Sikanen L. (2012). Chipping operations and efficiency in different operational environments. Silva Fennica 46(2): 275–286. http://dx.doi.org/10.14214/sf.60.
Snowdon P. (1991). A ratio estimator for bias correction in logarithmic regressions. Canadian Journal of Forest Research 21(5): 720–724. http://dx.doi.org/10.1139/x91-101.
Spinelli R., Hartsough B. (2001). A survey of Italian chipping operations. Biomass and Bioenergy 21(6): 433–444. http://dx.doi.org/10.1016/S0961-9534(01)00050-2.
Spinelli R., Hartsough B.R., Owende P.M., Ward S.M. (2002). Productivity and cost of mechanized whole-tree harvesting of fast-growing eucalypt stands. International Journal of Forest Engineering 13(2): 49–60. http://dx.doi.org/10.1080/14942119.2002.10702462.
Spinelli R., Magagnotti N. (2010). A tool for productivity and cost forecasting of decentralised wood chipping. Forest Policy and Economics 12(3): 194–198. http://dx.doi.org/10.1016/j.forpol.2009.10.002.
Spinelli R., Magagnotti N. (2011). The effects of introducing modern technology on the financial, labour and energy performance of forest operations in the Italian Alps. Forest Policy and Economics 13: 520–524. http://dx.doi.org/10.1016/j.forpol.2011.06.009.
Spinelli R., Magagnotti N., Paletto G., Preti C. (2011) Determining the impact of some wood characteristics on the performance of a mobile chipper. Silva Fennica 45(1): 85–95. http://dx.doi.org/10.14214/sf.33.
Spinelli R., Magagnotti N., Facchinetti D. (2013). Logging companies in the European mountains: an example from the Italian Alps. International Journal of Forest Engineering 24(2): 109–120. http://dx.doi.org/10.1080/14942119.2013.838376.
Van Belle J. (2006). A model to estimate fossil CO2 emissions during the harvesting of forest residues for energy - with an application on the case of chipping. Biomass and Bioenergy 30: 1067–1075. http://dx.doi.org/10.1016/j.biombioe.2005.12.019.
Verkerk P., Anttila P., Eggers J., Lindner M., Asikainen A. (2011). The realisable potential supply of woody biomass from forests in the European Union. Forest Ecology and Management 261: 2007–2015. http://dx.doi.org/10.1016/j.foreco.2011.02.027.
Total of 30 references.
