Jürgen Aosaar  ,
Ülo Mander,
Mats Varik,
Hardo Becker,
Gunnar Morozov,
Martin Maddison,
Veiko Uri
,
Ülo Mander,
Mats Varik,
Hardo Becker,
Gunnar Morozov,
Martin Maddison,
Veiko Uri
Biomass production and nitrogen balance of naturally afforested silver birch (Betula pendula Roth.) stand in Estonia
Aosaar J., Mander Ü., Varik M., Becker H., Morozov G., Maddison M., Uri V. (2016). Biomass production and nitrogen balance of naturally afforested silver birch (Betula pendula Roth.) stand in Estonia. Silva Fennica vol. 50 no. 4 article id 1628. https://doi.org/10.14214/sf.1628
Highlights
- Leafless aboveground biomass of the 17-year-old natural silver birch stand growing in abandoned agricultural land reached 94 Mg ha–1
- The largest fluxes in N budget were net nitrogen mineralization and gaseous N2-N emission
- Nitrogen leaching was low
- Soil N content increased with the stand age, soil C content remained stable
- N2O and N2 fluxes in boreal deciduous forest were analysed.
Abstract
Silver birch (Betula pendula Roth.) is one of the main pioneer tree species occupying large areas of abandoned agricultural lands under natural succession in Estonia. We estimated aboveground biomass (AGB) dynamics during 17 growing seasons, and analysed soil nitrogen (N) and carbon (C) dynamics for 10 year period in a silver birch stand growing on former arable land. Main N fluxes were estimated and nitrogen budget for 10-year-old stand was compiled. The leafless AGB and stem mass of the stand at the age of 17-years were 94 and 76 Mg ha–1 respectively. The current annual increment (CAI) of stemwood fluctuated, peaking at 10 Mg ha–1 yr–1 at the age of 15 years; the mean annual increment (MAI) fluctuated at around 4–5 Mg ha–1. The annual leaf mass of the stand stabilised at around 3 Mg ha–1 yr–1. The stand density decreased from 11600 to 2700 trees ha–1 in the 8- and 17-year-old stand, respectively. The largest fluxes in N budget were net nitrogen mineralization and gaseous N2-N emission. The estimated fluxes of N2O and N2 were 0.12 and 83 kg ha–1 yr–1, respectively; N leaching was negligible. Nitrogen retranslocation from senescing leaves was approximately 45 kg ha–1, N was mainly retranslocated into stembark. The N content in the upper 0–10 cm soil layer increased significantly (145 kg ha–1) from 2004 to 2014; soil C content remained stable. Both the woody biomass dynamics and the N cycling of the stand witness the potential for bioenergetics of such ecosystems.
Keywords
aboveground biomass;
birch;
afforestation;
soil carbon;
land use change;
agricultural land;
nitrogen budget
-
Aosaar,
Estonian University of Life Sciences, Institute of Forestry and Rural Engineering, Kreutzwaldi 1, 51014 Tartu, Estonia
E-mail
jyrgen.aosaar@emu.ee
- Mander, University of Tartu, Institute of Ecology and Earth Sciences, Ülikooli 18, 50090 Tartu, Estonia E-mail ulo.mander@ut.ee
- Varik, Estonian University of Life Sciences, Institute of Forestry and Rural Engineering, Kreutzwaldi 1, 51014 Tartu, Estonia E-mail mats.varik@emu.ee
- Becker, Estonian University of Life Sciences, Institute of Forestry and Rural Engineering, Kreutzwaldi 1, 51014 Tartu, Estonia E-mail hardo.becker@emu.ee
- Morozov, Estonian University of Life Sciences, Institute of Forestry and Rural Engineering, Kreutzwaldi 1, 51014 Tartu, Estonia E-mail gunnar.morozov@emu.ee
- Maddison, University of Tartu, Institute of Ecology and Earth Sciences, Ülikooli 18, 50090 Tartu, Estonia E-mail martin.maddison@ut.ee
- Uri, Estonian University of Life Sciences, Institute of Forestry and Rural Engineering, Kreutzwaldi 1, 51014 Tartu, Estonia E-mail veiko.uri@emu.ee
Received 26 April 2016 Accepted 18 August 2016 Published 6 September 2016
Views 190688
Available at https://doi.org/10.14214/sf.1628 | Download PDF

Supplementary Files
1 Introduction
Silver birch (Betula pendula Roth.) has a huge natural habitat in Europe and Asia (Laas 1987) and it is economically the most important deciduous tree species in the Nordic countries and the Baltic States (Hynynen et al. 2010). In Estonia the growing stock of birch stands is over 125 million m3 which is more than 25% of the total Estonian forest growing stock (Yearbook forest 2013). After the collapse of the USSR, one third of arable land was abandoned in Estonia (Peterson and Aunap 1998). These areas were rapidly occupied by fast-growing pioneer tree species, among them silver birch. More intensive use of birch timber along the softwood has affected its price and therefore managing birch stands for commercial purposes is economically feasible. In northern climate, silver birch may be very productive on fertile sites (Hytönen et al. 1995; Johansson 1999; Uri et al. 2012; Rosenvald et al. 2014; Lutter et al. 2015) and birch stands growing on former farmland can be relevant timber source. Therefore it is essential to give relevant estimations of the aboveground biomass production ability of such stands. However, only a limited number of studies have considered birch stands as potential bioenergy sources (Christen and Dalgaard 2013).
Due to the land use change from grassland to forest the nutrient and carbon (C) cycling of the ecosystem may change significantly. Thus it is crucial to understand the functioning and development of such new forest ecosystems in the context of nutrient and C cycling at regional and global level. Forest biomass studies make it possible to assess the amount of nutrients and C accumulated in trees which is indispensable for compiling the respective budgets of the ecosystem. It is well known that nitrogen (N) is the main growth-limiting nutrient in boreal forest ecosystems (Näsholm et al. 1998). However, despite decades of research the N-cycle in forests is one of the least understood major nutrient cycles (Johnson and Turner 2014).
Among other N fluxes, the estimation of gaseous N losses is essential for compiling relevant N budgets. Several studies have been dedicated to tackle the problem of N2O emissions from forest soils, the majority of these consider fluxes from riparian forests (Groffman et al. 2000; Teiter and Mander 2005; Soosaar et al. 2011; Mander et al. 2014). Mäkiranta et al. (2007) and Maljanen et al. (2012) have found remarkable N2O emissions from downy birch forests on organic soils, however, no references have been found on N2O measurements in birch forests on mineral soils. Here we first time analyse both N2O and N2 fluxes in boreal deciduous forests.
The aims of this study are: a) to estimate the aboveground biomass production dynamics in a young silver birch stand; b) to compile the nitrogen budget for a 10-year-old naturally afforested silver birch stand growing on fertile former arable land; c) to estimate the effect of land use change on soil N and C accumulation dynamics.
Considering previous results on fast growing birch forest stands we hypothesize that during the study period the N concentration in soil is increasing and C concentration will remain stable, whereas N losses due to leaching will be small.
2 Material and methods
2.1 Study site
The experimental area was established in 2004 in Kambja in Southern-Estonia (58°14´N, 26°44´E) on abandoned agricultural land (total area ca 10 ha) that was naturally afforested mainly with silver birch. The size of the square sample plot was 0.03 ha. The average age of the birch stand at the start of experiment was 8-years. The soil was classified as Glossic-Podzoluviol (FAO classification) (Table 1).
| Table 1. Soil characteristics in 18-year-old silver birch stand in upper 0–10 cm soil layer. Average ± standard error is presented. | |
| Soil characteristics | |
| N, % | 0.110 ± 0.002 |
| P, mg kg–1 | 78.3 ± 2.3 |
| K, mg kg–1 | 280.3 ± 3.6 |
| Ca, mg kg–1 | 504.0 ± 21.7 |
| Mg, mg kg–1 | 79.5 ± 7.1 |
| C, % | 1.42 ± 0.07 |
| pH | 5.69 ± 0.03 |
| Bulk density, g cm–3 | 1.34 ± 0.02 |
| Texture | Loamy sand |
2.2 Biomass and production of the stand
The breast height diameter of (D1.3) and mean height of the stand have been measured annually in 2004–2013. Aboveground biomass (AGB) and current annual increment (CAI) were determined in 2004–2009 and in 2013 using the method of model trees (Borman and Gordon 1984; Uri et al. 2002, 2012). Altogether 70 model trees were always taken at the end of summer when the annual biomass had reached its maximum: 11 trees in 2004; 10 in 2005, 2007, 2008, 2009; 12 in 2006; 7 in 2013. The model tree stems were divided into sections: the first section 0–1.3 m, the subsequent 2 m sections up to the living crown which was equally divided into three sections. The process of determining AGB is thoroughly described in Uri et al. (2007ab, 2009, 2014).
The AGB of the stand was calculated using the allometric Eq. 1:
where y is the AGB of the tree (g), x the tree diameter at breast height (cm) and a and b are the parameters of the equation (Table 2).
| Table 2. Parameter estimates of the regression Eq. 1 for estimation of the aboveground biomass. | ||||
| N | a | b | R2 | |
| 2004 1) | 11 | 142.19 | 2.25 | 0.99 |
| 2005 | 10 | 125.17 | 2.30 | 0.99 |
| 2006 | 12 | 114.13 | 2.39 | 0.99 |
| 2007 | 10 | 123.18 | 2.38 | 0.99 |
| 2008 | 10 | 88.494 | 2.55 | 0.98 |
| 2009 2) | 10 | 136.03 | 2.33 | 0.99 |
| 2013 3) | 7 | 82.09 | 2.60 | 0.98 |
| 1) Data from Uri et al. 2007a 2) Data from Uri et al. 2012 3) Leafless biomass R2 = coefficient of determination | ||||
In order to estimate AGB for 2010 and 2012 the equation parameters of 2009 and 2013 respectively were used. The leafless AGB of 2011 was calculated as the difference of the AGB values for 2010 and 2012. In 2004–2009 the AGB of the stand was estimated with leaves included, while in 2010–2013 leafless values of AGB were estimated. The annual production of tree aboveground fractions was always calculated as the difference between the biomass values for the current and previous year. The annual production of leaves and twigs (current year shoots) is equal to their biomass. The term current annual increment (CAI) indicates annual stem production. Mean annual increment (MAI) was calculated by dividing stem mass by stand age. For converting stemwood data from mass to volume units or conversely, the appropriate stemwood density value is relevant. The stemwood density was determined by using the water displacement principle for volume estimation (Uri et al. 2014, 2015). A sample disk was taken from the middle of the stem and 3–5 bark-free test pieces were sawn out so that the fringe and centre wood of the disks was presented.
Stump and coarse root production was assumed to be proportional to aboveground leafless biomass production (Uri et al. 2011; Aosaar et al. 2013) and coarse root percentage (21%) from the total aboveground woody biomass (Varik et al. 2013) was used. Fine root (d < 2 mm) biomass was estimated on the basis of ingrowth core data as the average of live root biomass during the sampling time interval as presented by Varik et al. (2015). The fine root production (FRP) was estimated on the basis of in-growth core samples installed in 2005. Presuming that FRP is a stable parameter within one stand, the annual production of fine roots was calculated on the basis of third-year in-growth core data from October 2007 to October 2008 (Varik et al. 2015).
The AGB of the herbaceous plants was estimated end of June when biomass was at its maximum. The aboveground part of all herbaceous plants was collected from a 1 m2 quadrat at 10 randomly chosen points over the whole stand. As the aboveground part of herbs is annual, annual production is equal to biomass. The belowground biomass of the understorey was estimated using soil cores. Ten soil cores were taken to a depth of 30 cm from the same 1 m2 quadrats using a soil auger (d = 108.6 mm). All cores were divided into three subsequent 10 cm layers and the roots and rhizomes were rinsed and separated under a microscope for each layer. For the belowground fraction of the understorey, the turnover rate was assumed to be 1 year (Lõhmus et al. 2002). The method is thoroughly described in Uri et al. (2012). All the samples were dried at 65 °C to constant weight and weighed to 0.01 g.
2.3 Nitrogen budget
2.3.1 Nitrogen demand of plants
Nitrogen demand (ND) is defined as an amount of N accumulated in plants during the growing season. N concentrations were analysed from different fractions of trees and herbaceous plants in 2006. Samples from trees (leaves, twigs, branches, stemwood and stembark) were collected from 3 model trees close to the average D1.3 during stand biomass estimation labour. Leaves, twigs and branches from all three living crown layers and for stemwood and stembark samples from four different stem height sections were analysed separately. Nutrient concentrations in different compartments of the sample trees were calculated as a weighted average, i.e. taking into account the section’s share in the biomass of the respective compartment of the whole tree. Both the N pool and the annual ND in the biomass of the plants were calculated by multiplying the biomass or the annual increment of a compartment by the respective N concentration. ND for coarse roots was calculated on the basis of the fractional distribution of the root system dug out in the same stand at the age of 8-years (Uri et al. 2007a). N usage efficiency (NUE) (kg kg−1 yr−1) was calculated by dividing the aboveground biomass production of trees by the respective ND.
2.3.2 Nitrogen transformations
The net nitrogen mineralization (NNM) dynamic was estimated from June 2004 to July 2005 in the 0–10 cm soil layer by using incubated polyethylene bags (Uri et al. 2003). The experiment and its results are thoroughly described in Uri et al. (2008). The N retranslocation of birch trees was estimated in 2006 by balancing the N dynamics in senescing leaves and in stemwood, stembark, branches and twigs fractions of the sample trees taken monthly from June to October. The amount of leaf litter was estimated in 2004–2006 using 10 litter traps with a collecting area of 0.25 m2 each. The leaf litter was gathered every fortnight and weekly during intense litter fall.
To estimate the autumn N retranslocation in the herbaceous understorey, N concentration in the belowground part of herbaceous plants was determined at the end of June and in October in 2003 using the soil coring method, described by Uri et al. (2011). The N deposition of the region was estimated in 1994–1996 and published by Mander et al. (1997).
2.3.3 Nitrogen leaching and gaseous emissions
Ten plate lysimeters with a collecting area of 627 cm2 each were installed in the soil at random points, to a depth of 40 cm for estimating NH4+, NO2–, NO3– and dissolved organic nitrogen (DON) leaching. Polyethylene tubes were connected to the lysimeters with 6000 ml polyethylene canisters for collecting water disposed at a depth of 1 m. In 2004–2006, water was sampled monthly through a plastic pipe, using a vacuum pump.
The static closed chamber (Mander et al. 2003) and the He/O2 methods (Scholefield et al. 1997; Butterbach et al. 2002) were used for measuring the N2O fluxes, and N2 emissions. Gas samplers (white non-transparent manual conical PVC chambers, h = 40 cm, Ø = 40 cm, V= 65 l, sealed with a water-filled collar on the soil surface) were installed randomly in 5 replicates. During each sampling session we measured the groundwater table depth in five water sampling wells and soil temperature at 0–10, 20–30 and 30–40 cm. Gas sampling was carried out monthly in May, August, November and December 2006. At time points 0, 30 and 60 minutes, samples were taken from the enclosures of samplers using previously evacuated gas bottles (100 ml). The concentration of N2O, CO2 and CH4 in the collected air was determined using the Shimadzu 2014 gas chromatographic system, equipped with an electron capture detector, a flame ionization detector and the Loftfield-type autosampler in the lab of the Institute of Landscape Biogeochemistry (ILB) of the Leibniz Centre for Agricultural Landscape Research (ZALF) in Germany. Intact soil cores (h = 6 cm, Ø = 6.8 cm) for use with the He/O2 method were taken from the topsoil (0–10 cm) at the gas sampler locations each time gas sampling was completed. Soil samples were weighed, kept at 4 °C and transported to the laboratory of the ILB-ZALF in Germany. The concentration of N2 was analysed from gas-tight incubation vessels as equilibrium flow, after flushing the vessels with an artificial He/O2 gas mixture in 24 hours by using a micro-GC (Agilent Technologies, 3000 Micro GC), equipped with a thermal conductivity detector. For more detailed description of determining the gas emission rates see Mander et al. (2003). As a result of restricted core height the N2O emission rates in the lab were 30–50% less than the rates from the field study sites. In order to meet the magnitude of the N2 flux rates under field conditions, we multiplied the N2:N2O ratio from the lab incubation by the N2O flux rates from the chamber measurements at the study sites.
2.4 Soil sampling
Samples for estimating soil C and nutrient content were taken from 0–10, 10–20, 20–30 and 40–50 cm soil layers using a soil corer (Ø 35 mm) in 2004, 2006, 2010, 2014. Subsamples were taken from fifteen random points to form a composite sample for soil analyses (Table 1). The concentration of C and nutrients in the soil layers was analysed in five replicates. Soil bulk density was determined in 2004 and 2014 from five soil pits of 1.0 m depth. Three samples were taken from each pit at different soil layers (0–50 cm) using a stainless steel cylinder (d = 40 mm, V = 50 cm3). The samples were dried at 105 °C and weighed.
2.5 Chemical analyses
For measuring N (Kjeldahl) in the soil samples, a Tecator ASN 3313 was employed. Available ammonium lactate extractable phosphorus in the soil was determined by flow injection analysis using a Tecator ASTN 9/84. Available potassium was determined from the same solution using the flame photometric method. Available (exchangeable) Mg was determined by using the 1 mol L–1 NH4OAc extracting solution buffered at pH 7. Magnesium in the soil was determined by flow injection analysis employing a Tecator ASTN 90/92. Soil pH in 1M KCl suspensions was measured at a ratio of 10 g:25 ml. To analyse the soil as well as the plant material for C content in the oven-dried samples, the dry combustion method was used with a varioMAX CNS elemental analyser (ELEMENTAR, Germany). Block digestion and steam distillation methods were used for analysing the plant material for Kjeldahl nitrogen concentration (Tecator AN 300). Determination of NH4+-N, NO2–-N, and NO3–-N in the lysimeter water was performed by flow injection analysis employing a Tecator ASN 65-32/84 and a Tecator ASN 65-31/84 respectively. The analyses were carried out at the Biochemistry Laboratory of the Estonian University of Life Sciences.
2.6 Statistical methods
The normality of variable distributions was checked using the Kolmogorov-Smirnov and Lilliefors tests. In most cases with the gas analyses, the distribution differed from the normal, and hence non-parametric tests were performed. Medians, 25 and 75 percentiles and minimum and maximum values of variables are presented. To analyse the effect of the qualitative factors on the response variables ANOVA was applied. The homogeneity of group variances was checked by Levene test. The Tukey HSD test was used for multiple comparison of the means; the t-test was employed to compare the means of the two groups for soil samples. When data did not follow a normal distribution, or when there occurred inhomogeneity of group variances the nonparametric Kruskal-Wallis analysis of variance was used. Linear and allometric models were employed in order to estimate the relationships. The statistical analysis was carried out using Statistica 7.1 (StatSoft Inc.). The level of significance of α = 0.05 was accepted in all cases.
3 Results
3.1 Biomass and production of trees
The average height and diameter of the stand have increased from 6.6 to 16.0 m and from 3.2 to 9.9 cm during study period at the stand age of 8- to 17-years, respectively. Stand density (living trees counted only) decreased intensively during the study period, from 11 600 trees ha–1 in the 8-year-old stand to less than 3000 trees ha–1 in the 17-year-old stand (Table 3). In 2011 and 2012 drastic natural self-thinning occurred (Fig. 1): the number of living trees decreased 35% and 26% respectively compared to the previous year. Due to intense self-thinning, the basal area of the stand has stabilized at around 20 m2 ha–1 despite the continuous diameter increment. The leafless aboveground biomass (AGB) of trees reached more than 90 Mg ha–1 at the age of 17 years and the standing stem volume 161 m3 ha–1 (stemwood density 0.53 g cm–3) (Table 3). CAI peaked at the stand age of 15 years, reaching almost 10 Mg ha–1 yr–1 (Fig. 1). MAI values have been increasing, reaching 5 Mg ha–1 at the age of 16 years. Leaf mass has been stable, fluctuating around 3 Mg ha–1, although it was not estimated in the last four study years. The coarse root and stump biomass of the stand was estimated at 8.4 Mg ha–1, almost 43% of which formed of stump core biomass; the fine root biomass of birches of the stand was 1.4 Mg ha–1 (Varik et al. 2015).
| Table 3. Stand characteristics and biomass and production dynamics of naturally afforested silver birch stand growing on abandoned agricultural land. H – average height of the stand, D1.3 – average breast height diameter of the stand; N – stand density, G – basal area of the stand, CAI – current annual increment of stemwood, MAI – mean annual increment of stemwood. | |||||||||||
| Stand age | H | D1.3 | N trees | G | Leaves | Branches | Twigs | Stemwood | Stembark | CAI | MAI |
| yr | m | cm | ha–1 | m2 ha–1 | Mg ha–1 | Mg ha–1 yr–1 | |||||
| 8 | 6.6 ± 0.6 | 3.2 ± 0.1 | 11 633 | 11.3 | 3.5 | 3.0 | 0.6 | 20.4 | 3.7 | 7.4 | 3.0 |
| 9 | 7.6 ± 0.5 | 3.8 ± 0.1 | 11 533 | 13.2 | 2.9 | 3.7 | 1.0 | 24.4 | 4.4 | 4.7 | 3.2 |
| 10 | 8.5 ± 0.6 | 4.4 ± 0.1 | 10 200 | 15.2 | 2.8 | 3.9 | 0.7 | 30.8 | 5.0 | 7.0 | 3.6 |
| 11 | 9.3 ± 0.7 | 4.7 ± 0.1 | 9500 | 16.6 | 2.1 | 4.4 | 0.8 | 38.4 | 5.6 | 8.2 | 4.0 |
| 12 | 10.4 ± 0.7 | 5.4 ± 0.2 | 8300 | 18.7 | 3.7 | 5.0 | 1.5 | 44.6 | 6.8 | 7.4 | 4.3 |
| 13 1) | 10.9 ± 0.8 | 5.8 ± 0.2 | 7670 | 20.1 | 3.1 | 5.0 | 0.8 | 51.6 | 7.2 | 7.4 | 4.5 |
| 14 | 12.2 ± 0.6 | 6.4 ± 0.2 | 6567 | 21.3 | n.e. | 6.0 | 0.8 | 56.6 | 8.3 | 5.7 | 4.6 |
| 15 | 13.2 ± 0.6 | 7.9 ± 0.3 | 4233 | 20.7 | n.e. | 6.3 | 1.0 | 65.6 | 8.5 | 9.7 | 4.9 |
| 16 | 14.4 ± 0.5 | 9.1 ± 0.3 | 3133 | 20.5 | n.e. | 6.9 | 0.8 | 72.2 | 8.7 | 6.8 | 5.1 |
| 17 | 16.0 ± 0.6 | 9.9 ± 0.3 | 2733 | 20.9 | n.e. | 7.3 | 0.8 | 76.3 | 9.1 | 4.6 | 5.0 |
| n.e. - not estimated 1) - Data from Uri et al. 2012 | |||||||||||
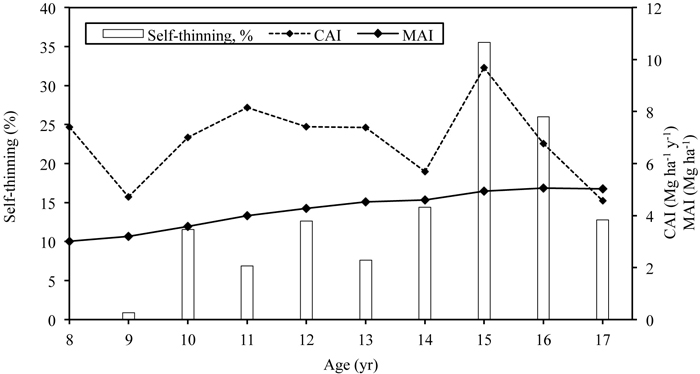
Fig. 1. The dynamics of current annual increment (CAI) and mean annual increment (MAI) in relation to self-thinning of the silver birch stand growing on abandoned agricultural land. Self-thinning is expressed as a share of number of dead trees out of previous years’ total number of trees.
3.2 Nitrogen budget of the birch stand
3.2.1 Nitrogen storages and demand of plants
A total of 106 kg N ha–1 was stored in the woody AGB of trees in the 10-year-old stand out of which 51% was bound in stemwood and 25% in stembark (Table 4). The N storage in the belowground part of the trees was 43 kg N ha–1, the largest share (27%) was bound in the fraction d > 10 mm and 23% in fine roots. In the 10-year-old stand the N demand (ND) of trees’ exceeded 100 kg N ha–1 yr–1, out of which 68% was used for leaf biomass and 11% for belowground biomass production (Table 4). The ND of herbaceous plants was nearly 15 kg N ha–1 yr–1 whereas 86% was used for the belowground part. For the 10-year-old stand, the nitrogen usage efficiency (NUE) of trees’ aboveground part was 117 kg kg–1 yr–1.
| Table 4. Nitrogen budget and storages of 10-year-old silver birch stand growing on abandoned agricultural land. | ||||||
| Production, Mg ha–1 | Biomass, Mg ha–1 | N, % | N storage, kg ha-1 | N demand, kg ha–1 yr–1 | ||
| Trees | Aboveground part | |||||
| Leaves | 2.81 | 2.81 | 2.507 | 70.45 | 70.45 | |
| Stemwood | 6.45 | 30.82 | 0.178 | 54.86 | 11.48 | |
| Stembark | 0.56 | 4.99 | 0.532 | 26.55 | 2.98 | |
| Twigs | 0.72 | 0.72 | 0.827 | 5.95 | 5.95 | |
| Branches | 0.16 | 3.85 | 0.497 | 19.13 | 0.80 | |
| Aboveground total | 10.70 | 91.66 | ||||
| Belowground part | ||||||
| Stump | 0.61 | 3.59 | 0.230 | 8.25 | 1.41 | |
| Coarse roots | 0.82 | 4.77 | 0.473–0.622 | 25.99 | 4.45 | |
| Fine roots | 0.89 | 1.35 | 0.655 | 8.98 | 5.83 | |
| Belowground total | 2.32 | 11.69 | ||||
| Trees, total | 13.02 | 103.35 | ||||
| Herbs | Aboveground part | 0.12 | 0.12 | 1.746 | 2.05 | 2.05 |
| Belowground part | 1.68 | 1.68 | 0.768 | 12.90 | 12.90 | |
| 1. Total N demand for plants | 118.3 | |||||
| Leaching | 0.92 | |||||
| Gaseous losses | ||||||
| N2O-N | 0.12 | |||||
| N2-N | 83.0 | |||||
| 2. Total output fluxes | 84.04 | |||||
| Deposition | 6.4 | |||||
| Herbs starting pool | 9.8 | |||||
| Transformations | ||||||
| Net nitrogen mineralization | 156.0 | |||||
| N retranslocation in trees | 45.0 | |||||
| 3. Total input fluxes | 217.2 | |||||
| Total 3 – (1+2) | 14.8 | |||||
3.2.2 Gaseous carbon and nitrogen fluxes
The average (median) value of soil respiration was 2798 (888) μg CO2–C m–2 h–1, being lowest in October and December and highest in May and August (Fig. 2A). Methane flux (μg CH4–C m–2 h–1) was low negative (average –2.8, median –1.9) varying from –6.2 (–7.0) to 1.4 (–0.4) in December and May (Fig. 2B). Throughout the measurement period the average (median) N2O emission was low: 1.4 (1.1) μg N2O-N m–2 h–1 (Fig. 2C). The average (median) dinitrogen emission (μg N2-N m–2 h–1) was 950 (1078), varying greatly, showing extreme values in August: 390 (387). Significantly different values were observed in May and August (Fig. 2D). The average (median) values of N2-N and N2O emissions recalculated for the whole study period were 83 (94) and 0.12 (0.10) kg N2-N ha−1 yr−1. The average (median) N2:N2O ratio of the whole period was 1429 (504) (Fig. 2E).
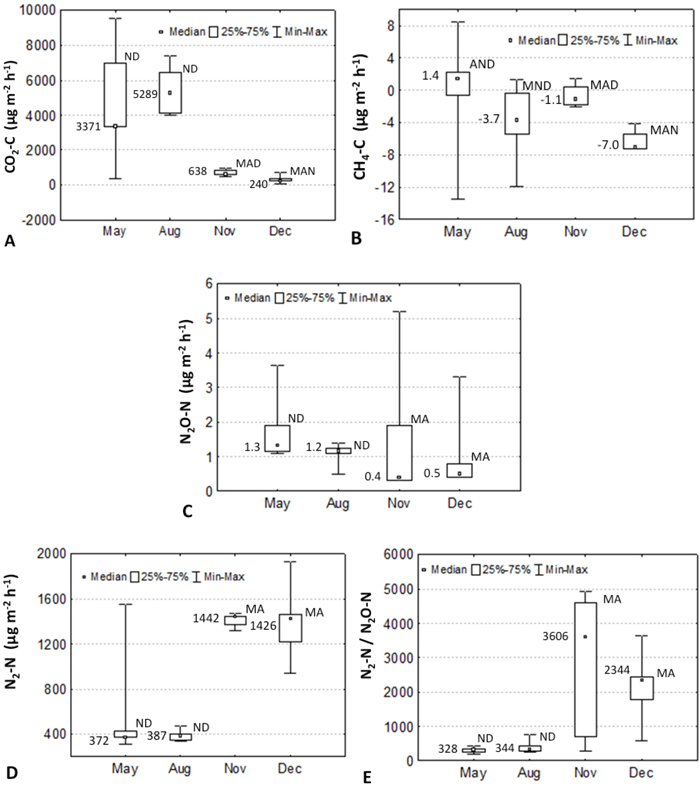
Fig. 2. Seasonal dynamics of carbon dioxide (A), methane (B), nitrous oxide (C), dinitrogen (D) emissions and N2:N2O ratio (E) in the Kambja birch stand, Estonia in 2006. Median, 25 and 75%, and min-max values are shown. Numbers show median values.
The total annual leaching of different forms of N in 2005 and 2006 was 8.47 and 0.96 kg ha–1 yr–1 respectively. NO3-N constituted 88 and 72% and DON 10 and 21%, of the total N leaching in 2005 and 2006. The annual peak was estimated in April (5.95 and 0.52 kg ha–1 in 2005 and 2006). Also, in July 2005 the leaching was notable (1.86 kg ha–1), during all the other observed months it was modest. The N deposition flux was 6.4 kg ha–1 yr–1 (Mander et al. 1997).
3.2.3 Nitrogen transformations
The amount of annual leaf litter varied during the study period being 3.5 Mg ha–1 yr–1 in 2004 (Uri et al. 2007a) and approximately 2.7 Mg ha–1 yr–1 in the next two years (Fig. 3). The N flux into soil via leaf litter was estimated at 32 kg ha–1 yr–1. No statistically significant differences appeared between the litter fluxes (g m–2) for samples taken from different littertraps, which was tested with ANOVA (p > 0.99). The approximate amount of retranslocated N in June–October of 2006 was 45 kg ha–1. The N retranslocated mainly into stembark (Fig. 4) where the N concentration in October was 72% (25.6 kg ha–1) higher than in June. For the branch and twig fraction the N concentration increase was approximately 41% (9.6 and 4.4 kg N ha–1). The increase in N storage was lowest in stemwood (8.2%; 5.4 kg ha–1). The net nitrogen mineralization (NNM) in the 0–20 cm soil layer was 156 kg ha–1 yr–1 (Uri et al. 2008).
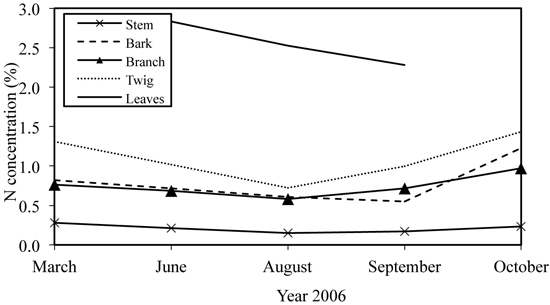
Fig. 3. Leaf abscission dynamics in young silver birch stand growing on former agricultural land.
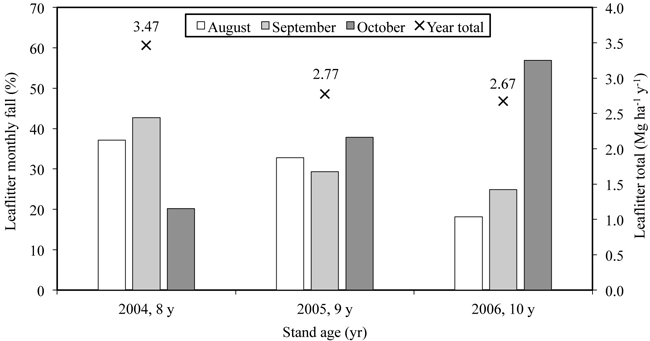
Fig. 4. The dynamics of nitrogen concentration in different fractions of the 10-year-old silver birch stand growing on former arable land.
3.3 Soil nitrogen and carbon dynamics
The total nitrogen concentration and the N pool in the upper 0–10 cm soil layer increased significantly from 0.097% in 2004 to 0.11% in 2014 (t-test; p < 0.05), the respective N pools were 1.30 and 1.45 t ha–1. For the deeper layer, the N pool has not changed. Soil C concentration and pool in upper 0–10 cm soil layer fluctuated being higher in 2006 (1.61 ± 0.07% and 21.6 t ha–1) but by 2014 it had almost fallen to the same level as in 2004 (1.35 ± 0.04% and 18.7 t ha–1). Soil bulk density in the upper 0–10 cm layer did not change in the period 2004–2014 (1.34 ± 0.03 and 1.32 ± 0.06 g cm–3, respectively).
4 Discussion
4.1 Biomass and production
We used the time series method to estimate AGB which allows reliable estimations of the productivity dynamics of the stand, based on the model trees analysis carried out in 2004–2009 and 2013. We tested the allometric equations for predicting the AGB of the stand by calculating the AGB of 2013 by using the equation parameters of 2009. This approach gave a significant underestimation (17 Mg ha–1) of the AGB value in 2013 compared to the actual value estimated on the basis of model trees. The finding demonstrates the importance of appropriate models for accurate biomass predictions in young stands due to the rapid development of trees and the sensitive relations between tree biomass and diameter. This is also supported by Telenius (1999), Peichl and Arain (2007) and Uri et al. (2014).
Silver birch is known as a highly productive deciduous tree species in fertile soils (Oikarinen 1983; Hynynen et al. 2010; Uri et al. 2012), which is supported by our study. The results of the studied stand exceed the respective values of the Estonian silver birch yield-table by Henno (1980) and published studies carried out in similar sites in Estonia (Uri et al. 2007b, 2012; Lutter et al. 2015) and in Finland (Hytönen et al. 2014). However, our result is lower compared to the 17-year-old grey alder stand growing in similar conditions (stem mass 105 Mg ha–1) (Aosaar et al. 2013) but higher than for 16- to 18-year-old natural grey alder stands growing in the very fertile sites (40–75 Mg ha–1) (Uri et al. 2014). The initial density of the young stand was very high, which is inherent for naturally regenerated silver birch stands (Jõgiste et al. 2003; Uri et al. 2007b), and self-thinning has been intense. The current annual increment (CAI) was fluctuating earlier strongly over the years and peaked at the stand age of 15-years despite the very intense self-thinning: at the end of the 2011 growing season (stand age 15 years), there were more than 2000 trees ha–1 fewer remaining (36%) than a year earlier (Fig. 1). Hence, due to favourable growing conditions, the larger trees in the stand had a very intense biomass increment exceeding the biomass loss caused by natural thinning. Thus the decrease of CAI in the next growing seasons was probably influenced by the decreased stand density and less favourable growing conditions. According to the yield-table (Henno 1980), CAI for silver birch is expected to increase until the stand age of 30 years. Further, the coarse belowground part of the stand is expected to increase in proportion with the aboveground part (Varik et al. 2013). Fine root production (FRP) (d < 2 mm) in fertile soils is expected to remain stable during stand development: the FRP in 32- and 45-year-old silver birch stands was 1.4 and 1.3 Mg ha–1 yr–1 (Varik et al. 2015).
The leaf mass of the stand is not dependent on stand age fluctuating around 2.0–3.5 Mg ha–1 in 6–60-year-old silver birch stands (Uri et al. 2012) which is closely correlated with our study. Besides other factors (soil, stand age and density), stands’ annual biomass production is strongly affected by weather conditions being lower in droughty years, supported also by grey alder studies (Uri et al. 2009, 2014).
Stemwood density of birch may be quite variable, depending on stand age and growing conditions (Repola 2006). The estimated stemwood density (0.53 g cm–3) was lower than for 52–104 year-old silver birch stands (0.65 by Kasesalu 1965). Higher stemwood density compared to grey alder (0.40 by Aosaar et al. 2011; Uri et al. 2014) and European aspen (0.38 by Heräjärvi and Junkkonen 2006) is a clear advantage of silver birch compared to other fast-growing tree species in context of bioenergy production.
4.2 Nitrogen demand and storages
Since the nitrogen demand (ND) of the stand is mainly dependent on stands leaf production, the long-term trend of ND is expected to fluctuate over years but more or less remains in the same magnitude as for the 10-year-old stand. The ND may only increase at the expense of woody biomass production but due to the low N content its share in the stands total ND remains modest. The N storage in the biomass is dependent on the growing stock of the stand. Although stembark biomass makes up only some 15% of the total stem biomass in the 10-year-old stand, the N bound in the stembark made up roughly 55% of the respective stemwood value.
The nitrogen usage efficiency (NUE) of trees in our study (117 kg kg–1 ha–1) is higher than in the 10-year-old grey alder stand growing in similar conditions (76 kg kg–1 ha–1 by Uri et al. 2011). Despite the higher average N concentration of alder leaves (3.4%) over birch trees (2.5%), the birch stand invested a larger share of its total annual ND in foliage (77 and 70% respectively). However, NUE depends strongly on the weather conditions of the year in question (Uri et al. 2011). The ND of understorey herbs was modest compared to the ND of trees.
4.3 Nitrogen fluxes
The average values of N2O fluxes for the whole study period (kg N2O-N ha–1 yr–1) were comparable with the respective values for beech stands (0.17 by Brumme et al. 1999; 0.05–0.22 by Dannemann et al. 2008), but significantly lower than for riparian grey alder stand (0.20 to 2.70 by Teiter and Mander 2005; Mander et al. 2008, 2014), for a grey alder plantation (0.50 by Uri et al. 2011), for a 32-year-old natural grey alder stand and the clear-cut area (1.03 and 0.54 by Becker et al. 2015). Brumme et al. (1999) generalized literature data from 21 temperate forests and found the mean annual fluxes of N2O-N to be 0.39 ± 0.27 kg ha−1 yr−1.
The average (median) value of N2-N emission recalculated for the whole study period was 83 (1078) kg N2-N ha−1 yr−1. Similar value (73.8) is reported by Uri et al. (2011) from planted grey alder stand. Lower values (kg N2-N ha−1 yr−1) are reported in riparian grey alder stands (105–1890) by Teiter and Mander (2005) and Mander et al. (2008, 2014) and black alder stands (360–400 by Mander et al. 2008 and 53–543 by Eickenscheidt et al. 2014).
The high values of N2:N2O are mainly caused by low N2O emission and make them significantly higher than in most of the published studies: 0.3–112 in beech forests (Corre et al. 2003; Dannemann et al. 2008); and 4.7–1064 in various alder stands (Teiter and Mander 2005; Soosaar et al. 2011; Uri et al. 2011; Eickenscheidt et al. 2014; Mander et al. 2014). Only the riparian grey alder forest in Estonia has shown a higher N2:N2O ratio, namely up to 3500 (Mander et al. 2008). Another explanation for the high values of N2 flux and N2:N2O ratio is that, as a former agricultural land, the soil still has relatively high N storages (2.5 t N ha–1 in 0–20 cm soil layer), which will be reduced to N2 – the end product of heterotrophic denitrification. Due to the relatively high concentration of NH4+-N in soil (from 24.3 mg kg–1 to 34.9 mg kg–1) (Uri et al. 2008), the role of the Anammox process in dinitrogen production could also be considered (see Ligi et al. 2015). Another challenge would be to find evidence of N2 fixation by Frankia in birch forest soils. Smolander and Sarsa (1990) and Rönkkö et al. (1993) have reported that in Betula pendula stands, many Frankia strains can be found without inoculating the roots like in alder stands. However, no data have been found regarding their ability to fix N2 in non-symbiotic status.
The soil respiration data showed a clear temperature relationship and slightly but not significantly higher values in May and August (Fig. 2A). However, without analysing the net ecosystem exchange (NEE) of CO2, it is difficult to judge the system’s response as a net warmer or cooler of the atmosphere. However, the modelled NEE values for birch forests in Finland show that these ecosystems are net sinks of atmospheric carbon (Grote et al. 2011), which was also confirmed in the Estonian case study (Varik et al. 2015). The average methane flux for the whole study period was almost below zero, meaning that the stand is consuming CH4 (Fig. 2E). This is normal because during most of the times the water table depth was > 30 cm from the surface, allowing methanotrophs to oxidise CH4+ (Soosaar et al. 2011).
Total N leaching can be considered very low; according to Dise et al. (1998), the amount of dissolved inorganic nitrogen in European forests ranges from < 1 to 50 kg N ha–1 yr–1. MacDonald et al. (2002) and Gundersen et al. (2006) found a relation between low deposition and low leaching values which was also a case in our study. The highest rate of leaching was found in April 2005 when there was no uptake by plants, and at the same time large amount of snow was melting. In the next winter (2005/2006) there was practically no snow cover, and therefore the peak in April was also very low. Due to the high mobility, N was mainly leached in the form of NO3–, the share of leached NH4+-N was modest which is in good correlation with findings from grey alder stand (Uri et al. 2014).
4.4 Nitrogen transformations
N input into the soil via leaf litter was similar in 2005 and 2006; in 2004 it was higher due to the higher foliage mass. The pattern of leaf falling has been different in every observed year (Fig. 3), and it was closely correlated with the amount of precipitation during the growing season (Supplementary file 1): in 2004 the amount of precipitation was the highest and 80% of leaves had fallen before October; in 2005 the leaf fall was quite evenly distributed between months, while the precipitation of the growing season was quite modest; and in the very droughty year of 2006, more than half of leaves fell as late as in October. However, the amount of retranslocated N from leaves in 2006 (60%) was similar to the value of the year 2004 (55%) (Uri et al. 2007a). Earlier studies report the share of N retranslocation 3–14% in grey alder stands (Mander et al. 1997; Uri et al. 2011), 16% for the black alder (Dawson and Funk 1981), 49–86% for mountain birch (Nordell and Karlsson 1995). Hence, great differences in nutrient resorption occur between tree species and also between stands and individuals within one species (Tilton 1977; Chapin and Kedrowski 1983). Retranslocated N covered 44% of the annual ND of the stand, which shows the effective use of nitrogen by birches, which may be one key factor ensuring the high productivity of birch stands. However, the nutrient resorption of stands depends on the weather conditions during the growing season, being higher in droughty years (Uri et al. 2011).
4.5 Nitrogen budget
The agricultural ecosystem changed completely during the 10 years that were studied, and it was replaced by the silver birch forest ecosystem. The main flux to cover the annual ND of plants in the 10-year-old stand was NNM, and the main output flux was N2-N emission, while leaching was negligible. The estimated N input exceeded the output value by approximately 15 kg N ha–1 (Table 4), which can be considered as a reasonable bias, concerning the accuracy of the methodology. However, the average soil N pool increase during the study period was almost the same – 17 kg ha–1 yr–1. Despite the notable decrease in the number of trees, the annual N storage of the stand increased along with the increasing growing stock. Due to the intense self-thinning, a significant share of N bound in the woody parts of the trees is temporarily out of the active plant-soil cycling. However, all dead woody material was left on site, and the decomposition of tree stems due to small diameter was rapid. Thus, nutrients bound in dead material have gradually been released into the soil quite quickly.
4.6 Soil nitrogen and carbon dynamics
Changes in soil C and N stock after afforestation are significantly correlated (Li et al. 2012), and land use history plays an important role in soil organic carbon (SOC) dynamics after afforestation of agricultural land (Laganiére et al. 2010): the positive effect of afforestation on SOC is more notable in cropland compared to grassland. Our study area has been in use as a cropland and also as a grassland, hence land use history is not a determining factor in soil C and N dynamics in the current study.
The soil N pool in upper 0–10 cm soil layer has increased significantly during ten years: from 1.30 t ha–1 in 2004 to 1.45 t ha–1 in 2014. Hence, an average annual increase has been 15 kg yr–1, which is in good accordance with nitrogen input flux estimated by N budgeting (Table 4). The increase of soil N content is inherent for symbiotically N-fixing tree species stands (alders) but not for silver birch ecosystem. In a study by Lutter et al. (2015), total topsoil N in silver birch stands growing on former arable land remained at the same level during the 13 years of monitoring. The estimated annual N deposition (6.4 kg ha–1 yr–1) covered large share of annual soil N storage increase, another possible additional N source would be non-symbiotic N2 fixation by Frankia in birch forest soils (Smolander and Sarsa 1990; Rönkkö et al. 1993), discussed above. Moreover, since we found N content increase only in upper 0–10 cm soil layer, the transition of nitrogen from deeper soil layers to uppersoil via litter flux can not be excluded.
Soil C concentration has fluctuated, being slightly higher in 2005 than in other years, which may be the result of low precipitation and thus low decomposition of SOM. By 2014 the C concentration had decreased, although insignificantly. The long-term SOC content will probably remain stable: in studies by Uri et al. (2012) and Varik et al. (2015) soil C stock remained stable in silver birch stands chronosequence, due to rapid litter decomposition and intense soil respiration. In our studied stand, soil C input and output were equal (Varik et al. 2015). It is, however, variable for different tree species: in first generation grey alder stands growing on previously non-forested areas, soil C storage increased by approximately 1 Mg ha–1 yr–1, while in second generation grey alder stands it remained stable (Uri et al. 2014). According to Hansen (1993), the hybrid poplar plantation also stored C in soil. According to Akselsson et al. (2005), mature forests in Sweden sequester 0.18 t ha–1 yr–1 C in soil organic matter (spruce stands 0.2 t ha–1 yr–1, pine and birch stands 0.15 t ha–1 yr–1). Meta-analysis of 292 results showed significant soil C and N increase after 30 and 50 years after afforestation Li et al. (2012).
5 Conclusions
The growth dynamics monitoring of young silver birch stand growing on former arable land during 17-years revealed intense self-thinning and the high biomass yield of the stand. Leaf mass has been stable, fluctuating around 3 Mg ha–1. The largest fluxes in N budget were net nitrogen mineralization and gaseous N2-N emission, nitrogen leaching was negligible. Nitrogen from senescing leaves was mainly retranslocated into stembark. N concentration in the upper 0–10 cm soil layer increased from 2004 to 2014; soil C content remained stable. Both the woody biomass dynamics and the N cycling of the stand witness the potential for bioenergetics of such ecosystems.
Acknowledgements
This study was supported by the Ministry of Education and Science of Estonia (grant SF0180127s08), the Estonian Research Council (grants IUT-21-4 and IUT2-16); ETF grants 5748 and 7069 and the EU through the European Regional Development Fund (Centre of Excellence ENVIRON).
References
Akselsson C., Berg B., Meentemeyer V., Westling O. (2005). Carbon sequestration rates in organic layers of boreal and temperate forest – Sweden as a case study. Global Ecology and Biogeography 14: 77–84. http://dx.doi.org/10.1111/j.1466-822X.2004.00133.x.
Aosaar J., Varik M., Lõhmus K., Uri V. (2011). Stemwood density in young grey alder (Alnus incana (L.) Moench) and hybrid alder (Alnus hybrida A. Br.) stands growing on abandoned agricultural land. Baltic Forestry 17(2): 256–261. http://dx.doi.org/10.1016/j.foreco.2014.04.040.
Aosaar J., Varik M., Lõhmus K., Ostonen I., Becker H., Uri V. (2013). Long-term study of above- and below-ground biomass production in relation to nitrogen and carbon accumulation dynamics in a grey alder (Alnus incana (L.) Moench) plantation on former agricultural land. European Journal of Forest Research 132(5–6): 737–749. http://dx.doi.org/10.1093/forestry/cpn040.
Becker H., Uri V., Aosaar J., Varik M., Mander Ü., Soosaar K., Hansen R., Teemusk A., Morozov G., Kutti S., Lõhmus K. (2015). The effects of clear-cut on net nitrogen mineralization and nitrogen losses in a grey alder stand. Ecological Engineering 85: 237–246. http://dx.doi.org/10.1016/j.ecoleng.2015.10.006.
Bormann B.T., Gordon J.C. (1984). Stand density effects in young red alder plantations: productivity, photosynthate partitioning and nitrogen fixation. Ecology 2: 394–402. http://dx.doi.org/10.2307/1941402.
Brumme R., Borken W., Finke S. (1999). Hierarchical control on N2O emissions in forest ecosystems. Global Biogeochemical Cycles 13: 1137–1148. http://dx.doi.org/10.1029/1999GB900017.
Butterbach-Bahl K., Willibald G., Papen H. (2002). Soil core method for direct simultaneous determination of N2 and N2O emissions from forest soils. Plant and Soil 240(1): 105–116. http://dx.doi.org/10.1023/A:1015870518723.
Chapin F.S. III, Kedrowski R.A. (1983). Seasonal changes in nitrogen and phosphorus fractions and autumn retranslocation in evergreen and deciduous taiga trees. Ecology 64: 376–391. http://dx.doi.org/10.2307/1937083.
Christen B., Dalgaard T. (2013). Buffers for biomass production in temperate European agriculture: a review and synthesis on function, ecosystem services and implementation. Biomass & Bioenergy 55: 53–67. http://dx.doi.org/10.1016/j.biombioe.2012.09.053.
Corre M.D., Beese F.O., Brumme R. (2003). Soil nitrogen cycle in high nitrogen deposition forest: changes under nitrogen saturation and liming. Ecological Applications 13: 287–298. http://dx.doi.org/10.1890/1051-0761(2003)013[0287:SNCIHN]2.0.CO;2.
Dannenmann M., Butterbach-Bahl K., Gasche R., Willibald G., Papen H. (2008). Dinitrogen emissions and the N2:N2O emission ratio of a Rendzic Leptosol as influenced by pH and forest thinning. Soil Biology & Biochemistry 40: 2317–2323. http://dx.doi.org/10.1016/j.soilbio.2008.05.009.
Dawson J.O., Funk D.T. (1981). Seasonal change in foliar nitrogen concentration of Alnus glutinosa. Forestry Science 27: 239–243.
Dise N.B., Matzner E., Gundersen P. (1997). Synthesis of nitrogen pools and fluxes from European forest ecosystems. 3rd International Symposium on Ecosystem Behavior Location, Villanova Univ, Philadelphia, Pennsylvania.
Eickenscheidt T., Heinichen J., Augustin J., Freibauer A., Drösler M. (2014). Nitrogen mineralization and gaseous nitrogen losses from waterlogged and drained organic soils in a black alder (Alnus glutinosa L. Gaertn.) forest. Biogeosciences 11: 2961–2976. http://dx.doi.org/10.5194/bg-11-2961-2014.
Groffman P.M., Gold A., Addy K. (2000). Nitrous oxide production in riparian zones and its importance to national emission inventories. Chemosphere 2(3–4): 291–299. http://dx.doi.org/10.1016/S1465-9972(00)00018-0.
Grote R., Korhonen J., Mammarella I. (2011). Challenges for evaluating process-based models of gas exchange at forest sites with fetches of various species. Forest Systems 20(3): 389–406. http://dx.doi.org/. http://dx.doi.org/10.5424/fs/20112003-11084.
Gundersen P., Schmidt I.K., Raulund-Rasmussen K. (2006). Leaching of nitrate from temperate forests – effects of air pollution and forest management. Environmental Reviews 14(1): 1–57. http://dx.doi.org/10.1139/A05-015.
Hansen E.A. (1993). Soil carbon sequestration beneath hybrid poplar plantations in the north central United States. Biomass & Bioenergy 5(6): 431–436. http://dx.doi.org/10.1016/0961-9534(93)90038-6.
Henno O. (1980). Arukaasikute kasvukäik põhilistes kasvukohatüüpides. [The yield-tables of silver birch stands of the main site types]. The collection of research papers of Estonian Agricultural Academy 128: 80–89. [In Estonian].
Heräjärvi H., Junkkonen R. (2006). Wood density and growth rate of European and hybrid aspen in Southern Finland. Baltic Forestry 12(1): 2–8.
Hynynen J., Niemistö P., Vihera-Aarnio A., Brunner A., Hein S., Velling P. (2010). Silviculture of birch (Betula pendula Roth and Betula pubescens Ehrh) in northern Europe. Forestry 83(1): 103–119. http://dx.doi.org/10.1093/forestry/cpp035.
Hytönen J., Saarsalmi A., Rossi P. (1995). Biomass production and nutrient consumption of short-rotation plantations. Silva Fennica 29(2): 117–139. http://dx.doi.org/10.14214/sf.a9202.
Hytönen J., Saramäki J., Niemistö P. (2014). Growth, stem quality and nutritional status of Betula pendula and Betula pubescens in pure stands and mixtures. Scandinavian Journal of Forest Research 29(1): 1–11. http://dx.doi.org/10.1080/02827581.2013.838300.
Jõgiste K, Vares A., Sendros M. (2003). Restoration of former agricultural fields in Estonia: comparative growth of planted and naturally regenerated birch. Forestry 76: 209–219. http://dx.doi.org/10.1093/forestry/76.2.209.
Johansson T. (1999). Biomass equations for determining fractions of pendula and pubescens birches growing on abandoned farmland and some practical implications. Biomass & Bioenergy 16: 223–238. http://dx.doi.org/10.1016/S0961-9534(98)00075-0.
Johnson D.W., Turner J. (2014). Nitrogen budgets of forest ecosystems: a review. Forest Ecology and Management 318: 370–379. http://dx.doi.org/10.1016/j.foreco.2013.08.028.
Kasesalu A. (1965). Kasepuidu füüsikalis-mehaanilistest omadustustest erinevates kasvukohatüüpides. [Physical- and mechanical properties of birch timber in different site types]. Forestry Studies 4: 149–157. [In Estonian].
Laas E. (1987). Dendroloogia. [Dendrology]. Tallinn, Valgus. 824 p. [In Estonian].
Laganiére J., Angers D.A., Paré D. (2010). Carbon accumulation in agricultural soils after afforestation: a meta-analysis. Global Change Biology 16: 439–453. http://dx.doi.org/10.1111/j.1365-2486.2009.01930.x.
Lasch P., Kollas C., Rock J., Suckow F. (2010). Potentials and impacts of short-rotation coppice plantation with aspen in Eastern Germany under conditions of climate change. Regional Environmental Change 10: 83–94. http://dx.doi.org/10.1007/s10113-009-0095-7.
Li D.J., Niu S.L., Luo Y.Q. (2012). Global patterns of the dynamics of soil carbon and nitrogen stocks following afforestation: a meta-analysis. New Phytologist 195: 172–181. http://dx.doi.org/10.1111/j.1469-8137.2012.04150.x.
Ligi T., Truu M., Oopkaup K., Nõlvak H., Mander Ü., Mitsch W.J., Truu J. (2015). Genetic potential of N2 emission via denitrification and ANAMMOX from the soils and sediments of a created riverine treatment wetland complex. Ecological Engineering 80: 181–190. http://dx.doi.org/10.1016/j.ecoleng.2014.09.072.
Lõhmus K., Kuusemets V., Ivask M., Teiter S., Augustin J., Mander Ü. (2002). Budgets of nitrogen fluxes in riparian grey alder forests. Archiv für Hydrobiologie 141(3–4): 321–332.
Lutter R., Tullus A., Kanal A., Tullus T., Vares A., Tullus H. (2015). Growth development and plant-soil relations in mid-term silver birch (Betula pendula Roth) plantations on previous agricultural lands in hemiboreal Estonia. European Journal of Forest Research 134: 653–667. http://dx.doi.org/10.1007/s10342-015-0879-x.
MacDonald J.A., Dise N.B., Matzner E., Armbruster M., Gundersen P., Forsius M. (2002). Nitrogen input together with ecosystem nitrogen enrichment predict nitrate leaching from European forests. Global Change Biology 8: 1028–1033. http://dx.doi.org/10.1046/j.1365-2486.2002.00532.x.
Mäkiranta P., Hytönen J., Aro L., Maljanen M., Pihlatie M., Potila H., Shurpali N., Laine J., Lohila A-L., Martikainen P.J., Minkkinen K. (2007). Soil greenhouse gas emissions from afforested organic soil croplands and cutaway peatlands. Boreal Environmental Research 12: 159–175.
Maljanen M., Shurpali N., Hytönen J., Mäkiranta P., Aro L., Potila H., Laine J., Li C., Martikainen P.J. (2012). Afforestation does not necessarily reduce nitrous oxide emissions from managed peat soils. Biogeochemistry 108: 199–218. http://dx.doi.org/10.1007/s10533-011-9591-1.
Mander Ü., Kuusemets V., Lõhmus K., Mauring T. (1997). Efficiency and dimensioning of riparian buffer zones in agricultural catchments. Ecological Engineering 8: 299–324. http://dx.doi.org/10.1016/S0925-8574(97)00025-6.
Mander Ü., Kuusemets V., Lõhmus K., Mauring T., Teiter S., Augustin J. (2003). Nitrous oxide, dinitrogen, and methane emission in a subsurface flow constructed wetland. Water Science & Technology 48(5): 135–142.
Mander Ü., Lõhmus K., Teiter S., Uri V., Augustin J. (2008). Gaseous nitrogen and carbon fluxes in riparian alder stands. Boreal Environment Research 13: 231–241.
Mander Ü., Well R., Weymann D., Soosaar K., Maddison M., Kanal A., Lõhmus K., Truu J., Augustin J., Tournebize J. (2014). Isotopologue ratios of N2O and N2 measurements underpin the importance of denitrification in differently N-loaded riparian alder forests. Environmental Science and Policy 48(20): 11910–11918. http://dx.doi.org/10.1021/es501727h.
Näsholm T., Ekblad A., Nordin A., Giesler R., Högberg M., Högberg P. (1998). Boreal forest plants take up organic nitrogen. Nature 392(6679): 914–916. http://dx.doi.org/10.1038/31921.
Nordell K.O., Karlsson P.S. (1995). Resorption of nitrogen and dry matter prior to leaf abscission: variation among individuals, sites and years in the mountain birch. Functional Ecology 9(2): 326–333. http://dx.doi.org/10.2307/2390581.
Oikarinen M. (1983). Growth and yield models for silver birch (Betula pendula) plantations in southern Finland. Communicationes Instituti Forestalis Fenniae 113:1–75. [In Finnish with English summary].
Peichl M., Arain M.A. (2007). Allometry and partitioning of above- and belowground tree biomass in an age-sequence of white pine forests. Forest Ecology and Management 253: 68–80. http://dx.doi.org/10.1016/j.foreco.2007.07.003.
Peterson U., Aunap R. (1998). Changes in agricultural land use in Estonia in the 1990s detected with multitemporal Landsat MSS imagery. Landscape and Urban Planning 41: 193–201. http://dx.doi.org/10.1016/S0169-2046(98)00058-9.
Repola J. (2006). Models for vertical wood density of Scots pine, Norway spruce and birch stems and their application to determine average wood density. Silva Fennica 40(4): 673–685. http://dx.doi.org/10.14214/sf.322.
Rönkkö R., Smolander A., Nurmiaho-Lassila E.-L., Haahtela K. (1993). Frankia in the rhizosphere of nonhost plants: a comparison with root-associated N2-fixing Enterobacter, Klebsiella and Pseudomonas. Plant and Soil 153(1): 85–95. http://dx.doi.org/10.1007/BF00010547.
Rosenvald K., Tullus A., Ostonen I., Uri V., Kupper P., Aosaar J., Varik M., Sõber J., Niglas A., Hansen R., Rohula G., Kukk M., Sõber A., Lõhmus K. (2014). The effect of elevated air humidity on young silver birch and hybrid aspen biomass allocation and accumulation – acclimation mechanisms and capacity. Forest Ecology and Management 330: 252–260. http://dx.doi.org/10.1016/j.foreco.2014.07.016.
Ruzicka J., Hansen E.H. (1981). Flow injection analysis. J. Wiley & Sons, New York.
Scholefield D., Hawkins J.M.B., Jackson S.M. (1997). Development of a helium atmosphere soil incubation technique for direct measurement of nitrous oxide and dinitrogen fluxes during denitrification. Soil Biology & Biochemistry 29(9–10): 1345–1352. http://dx.doi.org/10.1016/S0038-0717(97)00021-7.
Smolander A., Sarsa M.L. (1990). Frankia strains of soil under Betula pendula: behaviour in soil and in pure culture. Plant and Soil 122: 129–136.
Soosaar K., Mander Ü., Maddison M., Kanal A., Kull A., Lõhmus K., Truu J., Augustin J. (2011). Dynamics of gaseous nitrogen and carbon fluxes in riparian alder forests. Ecological Engineering 37(1): 40–53. http://dx.doi.org/10.1016/j.ecoleng.2010.07.025.
Teiter S., Mander Ü. (2005). Emission of N2O, N2, CH4 and CO2 from constructed wetlands for wastewater treatment and from riparian buffer zones. Ecological Engineering 25: 528–541. http://dx.doi.org/10.1016/j.ecoleng.2005.07.011.
Telenius B.F. (1999). Stand growth of deciduous pioneer tree species on fertile agricultural land in southern Sweden. Biomass & Bioenergy 16: 13–23. http://dx.doi.org/ 10.1016/S0961-9534(98)00073-7.
Tilton R.L. (1997). Seasonal growth and foliar nutrients of Larix laricina in three wetland ecosystems. Canadian Journal of Botany 55: 1291–1298. http://dx.doi.org/10.1139/b77-150.
Uri V., Tullus H., Lõhmus K. (2002). Biomass production and nutrient accumulation in short-rotation grey alder (Alnus incana (L.) Moench) plantation on abandoned agricultural land. Forest Ecology and Management 161(1–3): 169–179. http://dx.doi.org/10.1016/S0378-1127(01)00478-9.
Uri V., Lõhmus K., Tullus H. (2003). Annual net nitrogen mineralization in a grey alder (Alnus incana (L.) moench) plantation on abandoned agricultural land. Forest Ecology and Management 184(1–3): 167–176. http://dx.doi.org/10.1016/S0378-1127(03)00210-X.
Uri V., Lõhmus K., Ostonen I., Tullus H., Lastik R., Vildo M. (2007a). Biomass production, foliar and root characteristics and nutrient accumulation in young silver birch (Betula pendula Roth.) stand growing on abandoned agricultural land. European Journal of Forest Research 126(4): 495–506. http://dx.doi.org/10.1007/s10342-007-0171-9.
Uri V., Vares A., Tullus H., Kanal A. (2007b). Above-ground biomass production and nutrient accumulation in young stands of silver birch on abandoned agricultural land. Biomass & Bioenergy 31(4): 195–204. http://dx.doi.org/10.1016/j.biombioe.2006.08.003.
Uri V., Lõhmus K., Kund M., Tullus H. (2008). The effect of land use type on net nitrogen mineralization on abandoned agricultural land: silver birch stand versus grassland. Forest Ecology and Management 255(1): 226–233. http://dx.doi.org/10.1016/j.foreco.2007.09.019.
Uri V., Lõhmus K., Kiviste A., Aosaar J. (2009). The dynamics of biomass production in relation to foliar and root traits in a grey alder (Alnus incana (L.) Moench) plantation on abandoned agricultural land. Forestry 82: 61–74. http://dx.doi.org/. http://dx.doi.org/10.1093/forestry/cpn040.
Uri V., Lõhmus K., Mander Ü., Ostonen I., Aosaar J., Maddison M., Helmisaari H-S., Augustin J. (2011). Long-term effects on the nitrogen budget of a short-rotation grey alder (Alnus incana (L.) Moench) forest in abandoned agricultural land. Ecological Engineering 37: 920–930. http://dx.doi.org/10.1016/j.ecoleng.2011.01.016.
Uri V., Varik M., Aosaar J., Kanal A., Kukumägi M., Lõhmus K. (2012). Biomass production and carbon sequestration in a fertile silver birch forest chronosequence. Forest Ecology and Management 267: 112–126. http://dx.doi.org/10.1016/j.foreco.2011.11.033.
Uri V., Aosaar J., Varik M., Becker H., Ligi K., Padari A., Kanal A., Lõhmus K. (2014). The dynamics of biomass production, carbon and nitrogen accumulation in grey alder (Alnus incana (L.) Moench) chronosequence stands in Estonia. Forest Ecology and Management 327: 106–117. http://dx.doi.org/10.1016/j.foreco.2014.04.040.
Uri V., Aosaar J., Varik M., Becker H., Kukumägi M., Ligi K., Pärn L., Kanal A. (2015). Biomass resource and environmental effects of Norway spruce (Picea abies) stump harvesting: an Estonian case study. Forest Ecology and Management 335: 207–215. http://dx.doi.org/10.1016/j.foreco.2014.10.003.
Varik M., Aosaar J., Ostonen I., Lõhmus K., Uri V. (2013). Carbon and nitrogen accumulation in belowground tree biomass in a chronosequence of silver birch stands. Forest Ecology and Management 302: 62–70. http://dx.doi.org/10.1016/j.foreco.2013.03.033.
Varik M., Kukumägi M., Aosaar J., Becker H., Ostonen I., Lõhmus K., Uri V. (2015). Carbon budgets in fertile silver birch (Betula pendula Roth) chronosequence stands. Ecological Engineering 77: 284–296. http://dx.doi.org/10.1016/j.ecoleng.2015.01.041.
Yearbook forest 2013. [Aastaraamat mets 2013]. Estonian Environmental Information Centre Tartu. 244 p. [In Estonian].
Total of 69 references.
