Timo Saksa  ,
Jari Miina,
Olli Luukkonen
,
Jari Miina,
Olli Luukkonen
Uprooting as a pre-commercial thinning operation in young Norway spruce stands
Saksa T., Miina J., Luukkonen O. (2023). Uprooting as a pre-commercial thinning operation in young Norway spruce stands. Silva Fennica vol. 57 no. 2 article id 22027. https://doi.org/10.14214/sf.22027
Highlights
- The number of competing birches varied considerably according to the operating conditions
- The main factors reducing the quality of uprooting were early operation timing, soil moisture and site fertility
- With careful selection of the timing and conditions for uprooting, the quality obtained by uprooting can be improved.
Abstract
Uprooting, as a mechanical pre-commercial thinning operation (PCT), removes competitive, undesired trees with roots to prevent or reduce the need for a second PCT. The state of 66 young Norway spruce (Picea abies (L.) H. Karst.) stands was explored 3–5 years after uprooting to assess the quality of uprooting in terms of the number of competing birches (Betula spp.) and the probability of freely growing crop tree spruce (no competing trees taller than 2/3 of the crop tree’s height). In the uprooted spruce stands, the number of birches was, on average, about 3800 stems ha−1, and in every fifth stand, it was less than 2000 stems ha−1. The number of birches increased with increasing site wetness (TWI), site fertility and thickness of the humus layer. In 80% of the stands, there were at least 1000 freely growing spruces ha−1, which is approximately the stem number to be left growing after first thinning in a spruce stand. If the height of crop tree spruces was 125 cm at uprooting, the probability of freely growing stems varied from 0.6 to 0.8 in typical cases. According to simulations at the first thinning stage, in most stands, birch was less than 10% taller than spruce, and the volume of birches was low enough that, in the future, spruce and birch would grow in the same crown layer as a mixed spruce–birch stand. The results showed that uprooting can serve as the only PCT operation in a planted spruce stand. The quality obtained by uprooting can be improved with careful selection of timing and conditions for uprooting; the optimal uprooting time is when crop tree spruces have reached about breast height.
Keywords
Picea abies;
simulation;
precommercial thinning;
mechanical young stand management
-
Saksa,
Natural Resources Institute Finland (Luke), Natural resources, Juntintie 154, 77600 Suonenjoki, Finland
 https://orcid.org/0000-0002-1776-2357
E-mail
ext.timo.saksa@luke.fi
https://orcid.org/0000-0002-1776-2357
E-mail
ext.timo.saksa@luke.fi
-
Miina,
Natural Resources Institute Finland (Luke), Natural resources, Yliopistokatu 6 B, 80100 Joensuu, Finland
https://orcid.org/0000-0002-8639-4383
E-mail
jari.miina@luke.fi
- Luukkonen, Metsäsydän Oy, Junninmäentie 53, 52200 Puumala, Finland E-mail olli.p.j.luukkonen@gmail.com
Received 8 January 2023 Accepted 7 June 2023 Published 15 June 2023
Views 39051
Available at https://doi.org/10.14214/sf.22027 | Download PDF

1 Introduction
Young stand management can traditionally be separated into two different treatments: early pre-commercial thinning (PCT) and ordinary PCT. Early PCT removes less valuable fast-growing pioneering broadleaved tree species, hampering the growth of the desired tree species. Ordinary PCT is applied to adjust the density of the desired tree species for optimal management (Uotila et al. 2012). Neglecting or postponing PCT operations leads to a significant decrease in future sawlog removal and stumpage earnings (Haikarainen et al. 2021). Country-by-country forest management instructions and recommendations regulate the timing and extent of PCT operations needed to ensure sufficient forest production in the coming years (Metsänhoidon suositukset 2022; Skogskunskap 2023). Today, nearly all PCT work is done motor-manually with brush saws. Uprooting of undesirable trees has been developed and used as a mechanical solution (Hallongren and Rantala 2013; Hallongren et al. 2016), but the performance of uprooting across a wide range of operating conditions has not been fully investigated.
In traditional stand management, the dilemma of early PCT (also called early cleaning; Uotila 2017) is that the cut stumps and roots of broadleaved trees start to sprout. This means that a second PCT operation is often needed a few years later. The efficiency of PCT can be improved in at least two different ways: 1) increase of systemisation and mechanisation of PCT operations (reducing costs) and 2) prevention of sprouting and growth of unwanted broadleaved tree species (minimising the number of operations) after early PCT.
To prevent broadleaves from sprouting after early PCT, one promising mechanical solution is the Naarva uprooter (Pentin Paja Oy), which uproots the broadleaved saplings from a conifer stand (Fig. 1). The basic idea of uprooting is that the uprooted broadleaves do not offshoot new saplings. The uprooting device is usually attached to a harvester boom tip. Its hydraulic jaws grip and lift a bunch of sprouts from the ground and break their roots instead of cutting the stems. Uprooting devices have been tested as technically feasible, and the working method has been further developed (Hallongren and Rantala 2013; Hallongren et al. 2016).
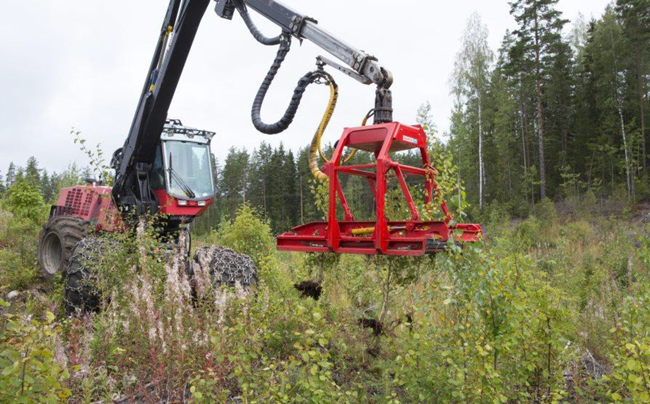
Fig. 1. Uprooting device connected to a harvester boom. Photo: Erkki Oksanen, Luke.
The cost of mechanical PCT operation is so high today (Rantala and Kautto 2011; Routa et al. 2020) that it is not economically feasible to use it twice in a stand (uprooting and ordinary PCT operation). Thus, uprooting would be economically feasible if there was no need for another PCT operation after uprooting. For example, after uprooting Norway spruce (Picea abies (L.) H. Karst.) stands, crop tree spruces should be free to grow without harmful competition by broadleaves until the first commercial thinning, and in uprooting operations, the stem number of crop trees should also be reduced to the target level (1800–2000 stem ha−1 in a spruce stand) without further PCT operations. Heikkinen (2009) and Kukkonen (2011) suggested that 60–70% of the uprooted spruce stands do not require any other PCT operation, and in the remaining 30–40% of the uprooted stands, the subsequent PCT is easier and faster than after normal early PCT with a brush saw. Thus far, we do not have real research evidence or practical experience on how these uprooted spruce stands are growing until the first commercial thinning.
The main objective of this study was to evaluate the success of uprooting as the only PCT operation. Criteria for the silvicultural efficiency of the uprooting method were a) the number of competing birches (Betula spp.) and b) the probability of freely growing crop tree spruce measured 3–5 years after uprooting, and c) the proportion of birch of the simulated stand volume at first commercial thinning. In a successful case, the density of crop tree spruces should meet the target level (about 1800 stem ha−1) after uprooting and at least those crop trees, which will be left growing after the first commercial thinning (1000–1200 stems ha−1), should be grown freely. This means that both spruce and birch should be growing in the same crown layer (the height ratio of birch vs spruce is less than 1.15), and the volume of birch should be less than 20% of the total stand volume at the first commercial thinning.
2 Material and methods
2.1 Material
Planted Norway spruce stands uprooted in 2012, 2013 or 2014 were inventoried in autumn 2017. Inventoried stands were sampled from the UPM-Kymmene’s operational register; during 2012–2014, a total area of 1864 ha was uprooted. All uprooting operations were done with Naarva uprooters (Pentin Paja Ltd.) attached to harvester boom. Stands were uprooted by several operators who were instructed and trained to do the operation (Kukkonen and Kukkonen 2013). The uprooted stands located in east and central Finland in six regions (60°50´–63°20´N and 24°20´–29°20´E) (Fig. 2). In each region, the target was to sample four stands for each uprooting year (12 stands per region). Because of the lack of uprooted sites in the Central Finland region and landowner changes during fieldwork, the total number and area of inventoried stands were 66 and 190 ha, respectively (Table 1).
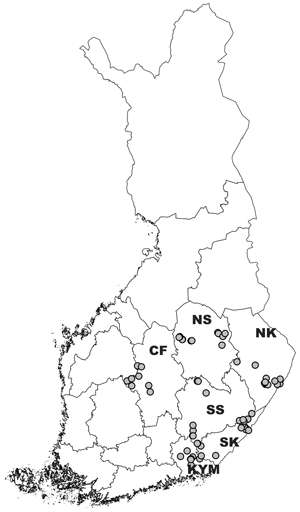
Fig. 2. Location of the uprooting sites in Finland. Regions: SK = South Karelia, SS = Southern Savonia, CF = Central Finland, KYM = Kymenlaakso, NK = North Karelia, NS = Northern Savonia.
| Table 1. The number of uprooted sites and sample plots in different regions and uprooting years inventoried in autumn 2017. | |||||||
| Region* | |||||||
| SK | SS | CF | KYM | NK | NS | Total | |
| Number of uprooted sites | 12 | 11 | 8 | 12 | 11 | 12 | 66 |
| Number of sample plots | 194 | 182 | 154 | 202 | 199 | 196 | 1127 |
| Uprooted in 2012 | 52 | 61 | 44 | 64 | 78 | 58 | 357 |
| Uprooted in 2013 | 74 | 74 | 72 | 67 | 74 | 70 | 431 |
| Uprooted in 2014 | 68 | 47 | 38 | 71 | 47 | 68 | 339 |
| * SK = South Karelia, SS = Southern Savonia, CF = Central Finland, KYM = Kymenlaakso, NK = North Karelia, NS = Northern Savonia | |||||||
For each stand, the dates of logging, stump harvesting, soil preparation, and uprooting were obtained from the UPM-Kymmene’s registries. In the field inventory, a systematic, regular-shaped sampling grid was used. Sites of 0.5–2.0 ha were measured with 15 sample plots, and larger sites were measured with 20 sample plots. On sites 10 ha and larger, an extra sample plot was measured for each site of half a hectare. The size of the temporary circular sample plot was 20 m2 (r = 2.52 m). The location of each sample plot was determined with a GPS receiver.
On each sample plot, the soil type (fine, medium, coarse and peat, if peat layer > 20 cm), site fertility (rich – Oxalis-Myrtillus type, medium – Myrtillus type, sub-dry – Vaccinium type; Cajander 1926) and soil preparation method (patching, disc trenching, mounding and no preparation) were recorded. The thickness of the humus layer (average of five observations, cm) was measured, and the moisture of the ground was estimated based on the cover of sphagnum and haircap mosses using the classification of Tamminen and Mälkönen (1999): no cover, cover <1%, 1–10%, 11–25%, 26–50% and >50%. In analyses, six classes were merged into three categories (dry, fresh and moist). The topographic wetness index (TWI), which is available throughout the whole country (https://etsin.fairdata.fi/), was also acquired for each sample plot.
In each sample plot, crop trees were selected (maximum number was six, and distance between crop trees was at least one metre) and measured by tree species (spruce, Scots pine (Pinus sylvestris L.) and silver birch (Betula pendula Roth)) and height. The competition status of crop trees was estimated based on the ratio between the height of competing broadleaves or conifers (growing nearer than 1 metre) and crop trees as follows: 1) no competing trees or competing trees were shorter than half of the height of the crop tree, 2) the height of competing trees was from ½ to 2/3 of the crop tree height, 3) the height of competing trees was from 2/3 to 1/1 of the crop tree height, and 4) competing trees were taller than the crop trees. In the analyses, classes 1 and 2 were merged and the joint class was called “freely growing crop trees”. The crop tree spruce nearest to the centre of the sample plot was measured by diameter at breast height and annual height growths from the uprooting year to inventory moment. On each sample plot, the number of competing stems (height > 1 metre) was counted, and mean height and mean diameter at stump height were measured using tree species (pine, spruce, silver and downy birch (Betula pubescens Ehrh.) together and other broadleaved trees).
The study material consisted of 1127 sample plots in 66 young spruce stands (Table 1). At the uprooting time, the stand age (years from planting) varied from two to seven years, and at inventory time, the stand age varied from five to twelve years. The number of stump-harvested sites was 29. In the Northern Savo, Central Finland and Kymenlaakso regions, there were more stump-harvested than non-harvested sites.
The development of the spruce stands uprooted 3 to 5 years ago was simulated from the inventory moment to the first thinning phase using the Motti stand simulator (Salminen et al. 2005). In the study material, the site type varied within stands; thus, in each stand, the sample plots were grouped based on site type. For each stand, simulations were conducted separately for the sample plots on rich and medium site types if the number of sample plots on a given site type was at least five. This resulted in a total of 69 stands, of which 11 and 58 were growing on the rich and medium site types, respectively. In Motti simulations, the input data of the stand consisted of the number, age and mean height of crop trees by tree species, as well as the number, age and mean height of competing birches at the time of inventory. Site type and stand location in Finland also served as input information for the simulations. The simulations were aimed at determining the proportion of birch in volume and whether competing birches would overtop spruces during the first thinning phase. For that, the stem number, dominant height and stem volume of crop trees and competing birches were compared at the time of the first commercial thinning.
2.2 Statistical analyses
The efficiency of uprooting under different operating conditions was assessed by modelling the number of competing birches, the probability of freely growing crop tree spruce 3–5 years after uprooting, and the proportion of birch of the simulated stand volume at the first thinning phase (cf. Saksa et al. 2018). Due to non-normal response variables and the multi-level hierarchy of the data, generalised linear mixed-effects models (GLMM) were fitted (McCullogh and Searle 2001). Correlated observations were considered by including random effects at the region, municipality, uprooted site and sample plot levels in the variance component models and by allowing the intercept to vary randomly across the levels.
A GLMM using a log-link function and a quasi-Poisson distribution assumption was used to model the number of competing birches. The response had a highly skewed distribution and a substantial proportion of its values equal to or close to zero. The quasi-Poisson distribution was used to account for overdispersion since the expected value of variance was greater than the expected value of the mean.
The following multi-level quasi-Poisson model with a log-link function was fitted for the number of competing birches on the 20-m2 sample plot 3–5 years after uprooting:

where y is the number of competing birches on the 20-m2 sample plot, the conditional distribution of y, given the expected value π, is the Poisson distribution; ln(π) is a log-link function; f(·) is a linear function with fixed predictor X and fixed parameter β; subscripts i, j, k and l refer to sample plot, uprooted site, municipality and geographical region, respectively; and u’s are random, normally distributed effects with a mean of 0and constant variances. Random effects were assumed to be uncorrelated across levels.
A crop tree spruce was determined to be freely growing if the height of competing broadleaves (adjacent trees) was not more than 2/3 of the height of the subject tree. The probability that crop tree spruce was freely growing 3–5 years after uprooting was modelled using a multi-level binomial model with the following logit-link function:

where y is the status of crop tree spruce t on the 20-m2 sample plot (1 = freely growing, 0= suppressed); and p is the probability that a crop tree spruce is growing without competition from broadleaves. The other symbols are the same as those in Eq. 1.
The development of uprooted stands was simulated until the first thinning phase, and the proportion of birch of the simulated stand volume was modelled using a multi-level binomial model with the following logit-link function:
where y is the proportion of birch of the simulated stand volume at the first thinning phase in the uprooted site; and binomial (n, p) denotes the binomial distribution with parameters n (binomial sample size, equal to 1) and p (proportion of successes, i.e., the expected proportion of birch). Other symbols are the same as in Eqs. 1 and 2.
The generalised linear mixed-effects models were fitted using the function glmmPQL in the R package MASS (Venables and Ripley 2002). In modelling, variables such as stump harvesting, time from planting to uprooting, time from uprooting to measurement, site fertility, soil texture, thickness of humus layer, ground moisture, topographic wetness index and height of crop tree spruces at uprooting were used as fixed effects (Table 2). Time from planting to uprooting, time from uprooting to measurement, thickness of the humus layer, topographic wetness index and height of crop tree spruces at uprooting were continuous predictors; other variables were categorical predictors. The fixed variables were considered important predictors and were included in the models if they were significant at the 0.1 level. Finally, the same set of predictors found to be important were used as fixed predictors in all models (the variables in italics). The model predictions were used to interpret the effects of the most important predictors (i.e., operating conditions) on the quality of uprooting.
| Table 2. The main characteristics on the 20 m2 sample plots inventoried on 66 uprooted stands (N = 1127). | ||||
| Continuous variable | Mean | Std. dev. | Range | |
| No. of crop-trees per 20 m2 | 3.9 | 1.2 | 1–6 | |
| No. of competing trees per 20 m2 | 12.9 | 11.1 | 0–80 | |
| No. of competing birches per 20 m2 | 7.6 | 9.7 | 0–80 | |
| No. of freely growing crop-tree spruces per 20 m2 | 2.2 | 1.3 | 0–6 | |
| Proportion of freely growing crop-tree spruces, % | 65.0 | 33.1 | 0–100 | |
| Mean height of crop-tree spruces, cm | 277 | 84 | 60–580 | |
| Mean height of competing trees, cm | 183 | 52 | 100–450 | |
| Time from planting to uprooting in years | 4.8 | 0.9 | 2–7 | |
| Time from uprooting to measurement in years | 4.2 | 0.8 | 3–5 | |
| Mean height of crop-tree spruces at uprooting, cm | 114 | 41 | 25–272 | |
| Topographic wetness index (TWI) | 7.1 | 1.4 | 4.3–14.7 | |
| Thickness of humus layer, cm | 3.4 | 1.1 | 1–13 | |
| Categorical variables | N | % | ||
| Stump harvesting | No | 634 | 56 | |
| Yes | 493 | 44 | ||
| Soil preparation method | Spot mounding | 1064 | 94 | |
| Mounding with ditches | 49 | 4 | ||
| Disc trenching | 14 | 1 | ||
| Site fertility | Rich (Oxalis-Myrtillus type) | 165 | 15 | |
| Medium (Myrtillus type) | 739 | 65 | ||
| Sub-dry (Vaccinium type) | 223 | 20 | ||
| Soil texture | Coarse | 133 | 11 | |
| Medium | 954 | 85 | ||
| Fine | 20 | 2 | ||
| Peat | 20 | 2 | ||
| Ground moisture a | Sub-dry | 611 | 54 | |
| Fresh | 310 | 28 | ||
| Moist | 206 | 18 | ||
| a Ground moisture: sub-dry, fresh and moist – the cover of sphagnum or haircap mosses ≤1%, 1–10% and >10%, respectively (Tamminen and Mälkönen 1999). | ||||
To assess the accuracy of the predictions for the number of competing broadleaves and the proportion of birch at the first thinning, the proportion of explained variance (R2) and root mean square error (RMSE) were calculated. The relative RMSE (RMSE%) was calculated by dividing the RMSE by the mean of the observed response. Both conditional and marginal predictions were calculated using both fixed and random effects or fixed effects only, respectively, by setting the random effects to zero. Prediction bias was corrected by applying an empirical ratio estimator suggested by Snowdon (1991) so that the marginal predictions were multiplied by the ratio of the mean of the observations and the mean of the predicted values.
The accuracy of the predicted classification of crop tree spruces into freely growing (event) and suppressed trees (non-event) was analysed using the observed probability as the threshold. The overall accuracy and Kappa coefficient were used as measures of accuracy.
3 Results
3.1 Number of competing birches 3–5 years after uprooting
The mean number of crop trees was 1950 ± 255 stems ha−1, and 82% of them were spruces (mean number of stems 1606 ± 275 ha−1). The mean number of competing broadleaved stems (height > 1 m) was 5320 ± 5525 ha−1, most of which were birches (3790 ± 4810 ha−1). Birch was considered the most harmful competitor to the crop tree spruces, and thus only birches were taken into account as competing trees in the further analysis. In addition to competing broadleaves, there were, on average, 1105 ± 1613 auxiliary conifers ha−1. Most were pines, especially on sub-dry sites.
A multi-level quasi-Poisson model (Eq. 1) was prepared for the number of competing birches on the 20 m2 sample plots (Table 3). The following variables were significant at least at the 0.1 level: TWI, thickness of humus layer and fertility of the site. In addition, more competing birches were found when more years had passed since the moment of uprooting. An increase of 1 cm in the thickness of the humus layer increased the number of competing birches by 7% (exp{0.072} = 1.07). On rich and medium fertile sites, the number of competing birches was about two-fold compared to that on sub-dry sites. Additionally, for all fertility site types, the number of competing birches almost doubled when TWI increased from 5 to 10 (Fig. 3).
| Table 3. Parameter estimates and goodness-of-fit statistics of the multi-level quasi-Poisson model (Eq. 1) estimated for the number of birches on the 20-m2 sample plot 3 to 5 years after uprooting. χ2 is the joined Wald χ2 test of the categorical fixed effects (type III test), the degrees of freedom in parentheses. Fitting statistics using only fixed effects and both random and fixed (in parentheses) are given. The modelling data consist of 1127 sample plots. | ||||
| Fixed effects | Estimate | Std err. | t-value | p |
| Intercept | 0.260 | 0.274 | 0.946 | 0.344 |
| Mean height of crop-tree spruces at uprooting, cm | –0.011 | 0.010 | –1.090 | 0.276 |
| Topographic wetness index (TWI) | 0.153 | 0.020 | 7.566 | <0.001 |
| Thickness of humus layer, cm | 0.072 | 0.025 | 2.84 | 0.005 |
| Site fertility (ref. Sub-dry) | χ2 (2) = 45.90 | <0.001 | ||
| Medium | 0.628 | 0.098 | 6.41 | <0.001 |
| Rich | 0.799 | 0.132 | 6.06 | <0.001 |
| Years since uprooting, a (ref. 5 years) | χ2 (2) = 5.31 | 0.070 | ||
| 3 years | –0.348 | 0.183 | –1.90 | 0.064 |
| 4 years | –0.291 | 0.152 | –1.91 | 0.063 |
| Random effects | Variance | |||
| Region (N = 6) | 0.085 | |||
| Municipality (N = 22) | 0.042 | |||
| Uprooted site (N = 66) | 0.202 | |||
| Snowdon’s bias correction ratio | 1.161 | |||
| Pearson correlation (predicted vs measured) | 0.38 | (0.63) | ||
| Proportion of explained variance R2 (%) | 14.2 | (40.1) | ||
| Root mean square error RMSE (birches per 20 m2 | 8.95 | (7.48) | ||
| Relative RMSE (%) | 117.1 | (97.9) | ||
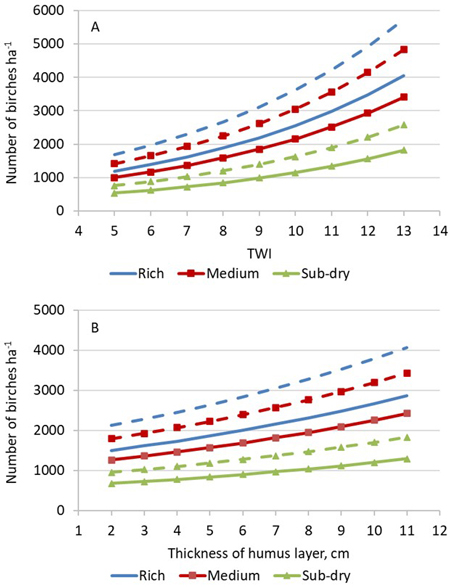
Fig. 3. Predicted number of competing birches ha–1 three (solid lines) and five years (broken lines) after uprooting as a function of (A) topographic wetness index (TWI) and (B) thickness of humus layer on rich, medium and sub-dry site fertility. Other predictors: mean height of crop-tree spruces is 75 cm; thickness of humus layer is 3 cm (A); TWI is 7 (B).
The proportion of the variance explained by fixed effects (R2) was 14%, and most of the unexplained variation (61%) was found at the uprooted site level (Table 3). Using the total variance of the effects of the uprooted site and higher hierarchical levels, the 95% confidence interval for the mean number of competing birches per hectare (3790 ha−1) was 1250–11 820 stems ha−1. This indicates that the random variation among the uprooted sites was large compared with the effects of the fixed predictors.
3.2 Competition status of crop tree spruces
For each crop tree, the competition status was determined in the field. The proportion of freely growing crop tree spruces (no competing broadleaves or conifers taller than 2/3 of the crop tree’s height) was over 60% if spruces were planted at least four years before the time of uprooting operation. Additionally, in the stands at least four years old at the time of uprooting, about 23% of the crop trees were growing in the same crown layer with competing trees (competing broadleaves or conifers were more than 2/3 of crop tree’s height but not taller than crop tree), and about 12% of the crop trees were already overtopped by competing trees (competing trees as tall as crop tree or taller).
The mean number of freely growing crop trees was 1235 ha−1, varying from 600 to 1900 stems ha−1 (Fig. 4). In 4 out of 5 stands, there were at least 1000 freely growing stems ha−1. The uprooting moment had no clear effect on the competition status, except in those stands uprooted before the crop trees reached a height of 1 m. If the height of spruces was less than 1 m at uprooting, half of the stands had less than 1000 freely growing crop trees.
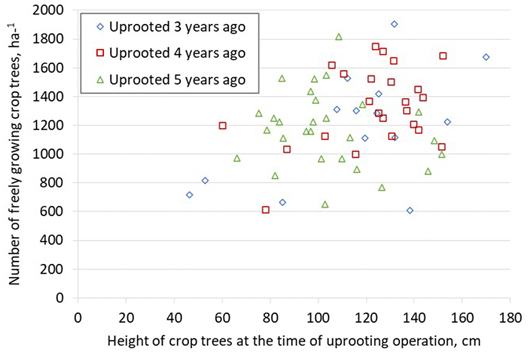
Fig. 4. Number of freely growing crop-tree spruces in the uprooted stands 3–5 years after uprooting as a function of the mean height of crop trees at uprooting operation.
The status of freely growing crop tree spruces was explained significantly by the following variables: TWI, height of crop trees at uprooting and site fertility. The height of crop tree spruces at uprooting and TWI had the strongest effect on the competition between crop tree spruce and competing trees (Table 4). When the height of crop trees at uprooting increased from 75 cm to 125 cm, the probability of freely growing increased by about 0.2 units in all site fertility classes. If crop trees had a height of 125 cm at uprooting, the probability of freely growing varied from 0.6 to 0.8 in typical cases (TWI from 6 to 8; including about 60% of the observations). If the TWI was more than 10, the probability of freely growing started to fall under 0.5 (Fig. 5).
| Table 4. Parameter estimates of the multi-level binomial model (Eq. 2) estimated for the probability of freely growing crop-tree spruce 3 to 5 years after uprooting. χ2 is the joined Wald χ2 test of the categorical fixed effects (type III test), the degrees of freedom in parentheses. The modelling data consist of 3694 crop-tree spruces. | ||||
| Fixed effects | Estimate | Std err. | t-value | p |
| Intercept | –0.154 | 0.352 | –0.44 | 0.661 |
| Height of spruce at uprooting, cm | 0.018 | 0.001 | 15.41 | <0.001 |
| Topographic wetness index | –0.143 | 0.036 | –3.94 | <0.001 |
| Thickness of humus layer, cm | –0.021 | 0.047 | –0.44 | 0.660 |
| Site fertility (ref. Sub-dry) | χ2 (2) = 7.58 | 0.023 | ||
| Medium | –0.253 | 0.123 | –2.05 | 0.040 |
| Rich | –0.494 | 0.184 | –2.69 | 0.007 |
| Years since uprooting, a (ref. 5 years) | χ2 (2) = 2.04 | 0.360 | ||
| 3 years | 0.201 | 0.188 | 1.07 | 0.292 |
| 4 years | 0.203 | 0.157 | 1.29 | 0.203 |
| Random effects | Variance | |||
| Region (N = 6) | 0.077 | |||
| Municipality (22) | <0.001 | |||
| Uprooted site (N = 66) | 0.175 | |||
| Sample plot (N = 1130) | 0.682 | |||
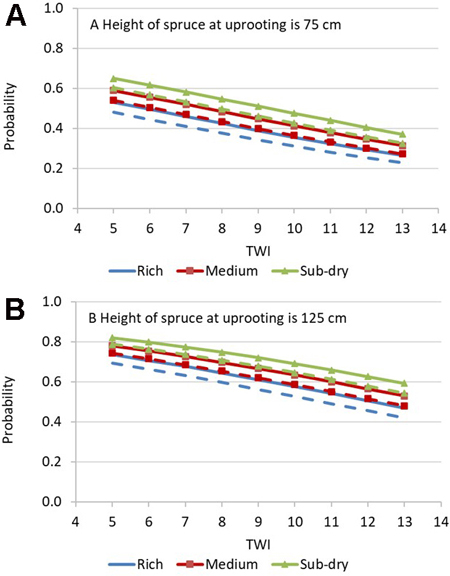
Fig. 5. Predicted probability of freely growing crop-tree spruce 3 to 5 years after uprooting as a function of topographic wetness index (TWI) three (solid lines) and five years (broken lines) after uprooting on rich, medium and sub-dry site fertility when mean height of crop-tree spruces is 75 cm (A) or 125 cm (B). Other predictors: thickness of humus layer is 3 cm.
The accuracy of the predicted classification was calculated so that the observed probability of freely growing crop tree spruce (0.66) was used as the threshold. The agreement between the observed and predicted probabilities was only fair (Table 5); the overall accuracy was 63% (kappa 0.24).
| Table 5. Accuracy of the classification of the crop-tree spruces as freely growing trees, i.e., the height of competing broadleaves or conifers was not more than 2/3 of the height of the crop-tree spruce. The predicted categories have been calculated using the fixed part of the model (Eq. 2); the classification using both fixed and random effects are given in parentheses. | ||||
| Predicted | ||||
| Observed | Freely growing | Suppressed | Total | Accuracy |
| Freely growing | 1507 (1795) | 918 (630) | 2425 | 62% (74%) |
| Suppressed | 457 (250) | 812 (1019) | 1269 | 64% (80%) |
| Total | 1964 (2045) | 1730 (1649) | 3694 | 63% (76%) |
3.3 Height relationship at first commercial thinning
Using the Motti simulator, the development of a total of 69 stands was simulated from the moment of inventory to the first thinning phase (Table 6). At this development phase, the dominant height of spruce was, on average, 14.4 ± 1.4 m, and the difference between the dominant height of birches and spruces was 0.75 m. In most stands, the dominant height of birch was higher than that of spruces (Fig. 6). However, birch was mainly less than 10% taller than spruces. At the first thinning, the average total stem number was 3020 stems ha−1. Due to simulated mortality, the total number of the crop and non-crop tree spruces decreased, on average, from 1880 to 1822 stems ha−1, and the number of birches decreased from 4298 to 1125 stems ha−1.
| Table 6. The main characteristics of the uprooted stands at the first commercial thinning phase (N = 69). The stands were simulated from the inventory moment to the first commercial thinning phase using the Motti simulator. | |||
| Variable | Mean | Std. dev. | Range |
| Stand age, a | 32.6 | 2.0 | 29–38 |
| Stem number of spruces, ha–1 | 1822 | 355 | 901–2758 |
| Stem number of birches, ha–1 | 1125 | 489 | 263–2343 |
| Proportion of birch in stem number, % | 36.5 | 14.1 | 10.2–68.9 |
| Dominant height of spruces, m | 14.4 | 1.4 | 12.3–18.8 |
| Dominant height of birches, m | 15.1 | 1.5 | 12.4–20.9 |
| Stand volume, m3 ha–1 | 182 | 36 | 144–306 |
| Proportion of birch in volume, % | 11.2 | 9.3 | 0.8–46.7 |
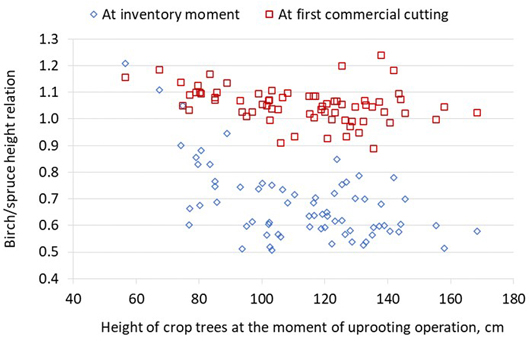
Fig. 6. Ratio of dominant height of birch and spruce in the uprooted stands at the time of the inventory and first commercial thinning (N = 69). The stands were simulated from the inventory moment to the first commercial thinning phase using the Motti simulator.
In the model for the birch proportion in simulated stand volume, the mean height of the crop tree spruces at uprooting was the most important predictor (Table 7). Even if the spruce height at uprooting did not significantly predict the number of competing birches at inventory (Eq. 1, Table 3), it explained the birch proportion in volume at the first commercial thinning. This indicates that the taller the spruces were at uprooting, the better the competition status compared to birch spruces in simulated stand development. Soil moisture (TWI) increased the birch proportion in volume at the first thinning, similar to the number of birches in the inventory (Figs. 3 and 7). If the height of the crop trees at uprooting was 125 cm, the birch proportion in volume was under 20% in typical cases (TWI from 6 to 8; includes about 60% of the observations) (Fig. 7).
| Table 7. Parameter estimates and fitting statistics of the multi-level binomial model (Eq. 3) estimated for the proportion of birch of the stand volume in the uprooted stands at the first thinning phase. Fitting statistics using only fixed effects and both random and fixed (in parentheses) are given. The modelling data consist of 69 stands. | ||||
| Fixed effects | Estimate | Std err. | t-value | p |
| Intercept | –0.569 | 0.992 | –0.57 | 0.570 |
| Mean height of crop-tree spruces at uprooting, cm | –0.016 | 0.364 | –4.37 | <0.001 |
| Topographic wetness index | 0.192 | 0.105 | 1.84 | 0.073 |
| Thickness of humus layer, cm | –0.330 | 0.147 | –2.24 | 0.030 |
| Rich site fertility (ref. Medium) | –0.429 | 0.270 | –1.59 | 0.119 |
| Random effects | Variance | |||
| Region (N = 6) | 0.096 | |||
| Municipality (N = 22) | <0.001 | |||
| Snowdon’s bias correction ratio | 1.024 | |||
| Pearson correlation (predicted vs measured) | 0.66 | (0.76) | ||
| Proportion of explained variation R2 (%) | 43.7 | (56.5) | ||
| Root mean square error RMSE (proportion of birch) | 0.07 | (0.06) | ||
| Relative RMSE (%) | 62.3 | (54.8) | ||
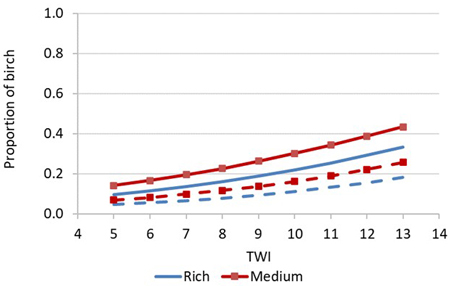
Fig. 7. Predicted proportion of birch of the stand volume in the uprooted stands at the first thinning phase as a function of topographic wetness index (TWI) on rich and medium site fertility when mean height of crop-tree spruces is 75 cm (solid lines) or 125 cm (broken lines). Other predictors: thickness of humus layer is 3 cm.
4 Discussion
Three to five years after uprooting, there were quite a lot of competing broadleaved trees (height > 1 m) growing in these planted spruce stands, but the variation between stands was high, as much as from 2200 up to 18 550 stems ha−1. The mean number of competing trees was altogether (broadleaved trees and auxiliary conifers) about 6250 stems ha−1, which is about one-half or one-third of the stem number in stands treated earlier by conventional motor manual PCT operation (Uotila et al. 2014; Uotila and Saksa 2021). Birches are the most powerful competitors in a spruce stand. The mean number of birches was about 3800 stems ha−1, and in every fifth stand, the mean number of birches was less than 2000 stems ha−1. In this study, all stems higher than one metre were counted, and thus, not all of these trees were real competitors for the crop trees, with a mean height of 275 cm.
According to the model (Eq. 1), increasing TWI, fertility of the site and thickness of the humus layer also increased the number of competing birches. These site characteristics are well-known variables that enhance the natural regeneration of broadleaved trees (Miina and Saksa 2006) and increase the time consumption of young stand management (Uotila et al. 2020).
Generally, crop trees were at least half a metre taller than competing trees 3–5 years after uprooting. The average height difference was 90 cm. Over 60% of the crop trees were classified as freely growing, so they had at least a height advantage of one-third of their own height. The mean number of freely growing crop trees was 1235 ha−1, ranging from 600 to 1900 stems ha−1 between stands. In 80% of the stands, there were at least 1000 freely growing stems ha−1 which is close to the stem number to be left growing after first thinning in a spruce stand (900–1100 stems ha−1; Äijälä et al. 2019).
The height of crop trees at the uprooting moment had the strongest effect on the competitive relationship between spruce and broadleaves. According to the model fitted to our data, an increase of 50 cm in the height of crop trees (from 75 cm to 125 cm) increased the proportion of freely growing crop trees by 20% units. However, on moist spots (TWI > 10), the risk of crop trees being overtopped by broadleaved trees was most obvious (probability more than 0.5). The effect of stump harvesting remains unclear due to unbalanced data on stump harvesting among regions. Additionally, after stump harvesting, new birch seedlings emerge for a much longer time than after “normal” site preparation (Saksa 2013), which might cause differences in the height distribution of competing birches between stump harvested and non-stump harvested sites. Thus, even if there are significantly more birches on stump-harvested sites, a major portion of birches might be in the lower height classes.
According to the Motti simulations, the stem number of competing birches decreased a lot before the first thinning. If the number of crop tree spruces was high enough (>1600 ha−1) to close the canopy before competing trees reached the height of spruces, the competing trees were suppressed by crop tree spruces. In most simulated stands, birch caught up with crop tree spruce in height development, but they grew in the same crown layer, and they did not overtop spruces. In most stands, birch was less than 10% taller than spruce at the first thinning. Thus, the risk that stands would develop towards two storey spruce–birch mixtures after uprooting was low. In the simulations, all birches were assumed to be silver birches. Thus, the height growth of birch may have been overestimated since about half of the birches were downy birches, which grow significantly slower than silver birch. According to Hytönen et al. (2013), the height of planted downy birch was 13% lower than that of silver birch at a stand age of about 20 years.
Even though the birches had caught up with the crop tree spruces in height development, the proportion of birch in the simulated stand volume at the first thinning phase was, on average, only 11%. If the height of crop trees at uprooting was 1.25 m, the birch proportion in volume was usually less than 20%. This means that the share of birch will not decrease the possibility of maximum wood production in the future (Mielikäinen 1985). However, in the first commercial thinning phase, the stem number of birch was still high enough to enable it to grow as a mixed spruce–birch stand. With increasing stand age, the difference in height growth between birch and spruce will slowly level out (Mielikäinen 1985). As a bonus, mixed broadleaved–coniferous stand structures can provide better outcomes than monocultures in terms of biodiversity, recreational and aesthetic values, water quality and uncertainties caused by climate change (Huuskonen et al. 2021)
In conclusion, this study showed that uprooting can serve as the only PCT operation in a planted spruce stand. If uprooting is the only PCT operation, then it is more cost efficient compared to the total costs of two separate motor-manual PCT operations (early PCT and PCT) (Hallongren and Rantala 2012). The timing of the uprooting operation is crucial; optimal uprooting time is when crop tree spruces have reached about breast height but competing broadleaves have not yet harmed spruces. If the stand is uprooted too early, all undesired stems will not be removed because they are not tall enough for the uprooting device. Additionally, attention must be paid to the selection of sites for uprooting. On moist sites, there is a risk of obtaining rich new seed-origin birch seedlings after uprooting. If the above-mentioned limitations are considered, the proportion of natural birches in uprooted spruce stands will be acceptable from the viewpoint of both wood production and biodiversity values.
Authors’ contributions
Conceptualization (TS, OL), data curation (OL, TS), data analysis (TS, JM, OL), original draft preparation (TS), writing (TS, JM, OL), project administration (TS). All authors have read and agreed to the published version of the manuscript.
Declaration of openness of research materials, data, and code
Data available on request from the corresponding author.
Acknowledgements
We would like to thank UPM-Kymmene Oyj for providing the uprooted stands for the study.
Funding
This work was supported by the EU, through the EFFORTE (Efficient forestry by precision planning and management for sustainable environment and cost competitive bio-based industry) project (Grant Agreement Number: 720712 – EFFORTE – H2020-BBI-PPP-2015-02/H2020-BBI-PPP2015-2-1). Completing the statistical analyses and writing was partly supported by Luke, through the AgileSilviTech (Agile silvicultural technology solutions for bio-based industry) project, and by the Ministry of Agriculture and Forestry in Finland, through the PUUVA (Diversifying the selection of tree species in forestry to increase climate resistance) project (Grant Agreement Number: VN/32521/2021-MMM-2; Catch the Carbon-program, the Recovery and Resilience Facility (RRF) of the Next Generation EU recovery instrument).
References
Äijälä O, Koistinen A, Sved J, Vanhatalo K, Väisänen P (eds) (2019) Metsänhoidon suositukset. [Guidelines for forest management]. Tapion julkaisuja. ISBN 978-952-5632-75-0.
Cajander AK (1926) The theory of forest types. Acta For Fenn 29, article id 7193. https://doi.org/10.14214/aff.7193.
Haikarainen S, Huuskonen S, Ahtikoski A, Lehtonen M, Salminen H, Siipilehto J, Korhonen KT, Hynynen J, Routa J (2021) Does juvenile stand management matter? Regional scenarios of the long-term effects on wood production. Forests 12, article id 84. https://doi.org/10.3390/f12010084.
Hallongren H, Rantala J (2013) A search for better competitiveness in mechanized early cleaning through product development: evaluation of two Naarva uprooters. Int J For Eng 24: 91–100. https://doi.org/10.1080/14942119.2013.841930.
Hallongren H, Kankaanhuhta V, Kukkonen M (2016) Cleaning Scots pine seedling stands with mechanical uprooters – a work quality comparison of two related devices. Silva Fenn 50, article id 1514. https://doi.org/10.14214/sf.1514.
Heikkinen O (2009) Kitkevän reikäperkauksen vaikutuslehtipuiden vesomisen määrään. [Effects of spot cleaning based on mechanized uprooting on sprouting of broad-leaved trees]. North Karelia University of Applied Sciences, Forestry Program.
Huuskonen S, Domisch T, Finér L, Hantula J, Hynynen J, Matala J, Miina J, Neuvonen S, Nevalainen S, Niemistö P, Nikula A, Piri T, Siitonen J, Smolander A, Tonteri T, Uotila K, Viiri H (2021) What is the potential for replacing monocultures with mixed-species stands to enhance ecosystem services in boreal forests in Fennoscandia? For Ecol Manage 479, article id 118558. https://doi.org/10.1016/j.foreco.2020.118558.
Hytönen J, Saramäki J, Niemistö, P (2013) Growth, stem quality and nutritional status of Betula pendula and Betula pubescens in pure stands and mixtures. Scand J For Res 29: 1–11. https://doi.org/10.1080/02827581.2013.838300.
Kukkonen M (2011) Varhaisperkauksen onnistumisen arviointi ja tulevan perkaustarpeen ennustaminen koneellisesti kitketyissä kuusen (Picea abies) taimikoissa. [Evaluation of the success in early cleaning and prediction of the need for later pre-commercial thinning in mechanically uprooted Norway spruce stands]. Master’s thesis. University of Eastern Finland, Forest Science. http://urn.fi/urn:nbn:fi:uef-20110051.
Kukkonen M, Kukkonen E (2013) Koneellinen metsänhoito. [Mechanised silviculture]. Karelia-ammattikorkeakoulu, Julkaisuja B:12. https://urn.fi/URN:ISBN:978-952-275-085-3.
McCullogh CE, Searle SR (2001) Generalized, linear, and mixed models. Wiley Series in Probability and Statistics. Wiley, New York. https://doi.org/10.1002/0471722073.
Metsänhoidon suositukset – Metsien kestävän hoidon ja käytön perusteet (2022) [Best Practices for sustainable forest management in Finland]. Tapion julkaisuja. https://tapio.fi/wp-content/uploads/2022/12/Metsanhoidon-suositukset-Metsien-kestavan-hoidon-ja-kayton-perusteet-TAPIO-10-2022.pdf.
Mielikäinen K (1985) Koivusekoituksen vaikutus kuusikon rakenteeseen ja kehitykseen. [Effect of an admixture of birch on the structure and development of Norway spruce stands]. Commun Inst For Fenn 133: 1–79. http://urn.fi/URN:ISBN:951-40-0711-5.
Miina J, Saksa T (2006) Predicting regeneration establishment in Norway spruce plantations using a multivariate multilevel model. New For 32: 265–283. https://doi.org/10.1007/s11056-006-9002-y.
Rantala J, Kautto K (2011) Koneellinen kitkentä taimikon varhaisperkauksessa – työajanmenekki, kustannukset ja työjäljen laatu. [Evaluation of the success in early cleaning and prediction of the need for later pre-commercial thinning in mechanically uprooted Norway spruce stands]. Metsätieteen aikakauskirja 1/2011: 3–12. https://doi.org/10.14214/ma.5927.
Routa J, Nuutinen Y, Asikainen A (2020) Productivity in mechanizing early tending in spruce seedling stands. Croat J For Eng 41, article id 619. https://doi.org/10.5552/crojfe.2020.619.
Saksa T (2013) Regeneration after stump harvesting in southern Finland. For Ecol Manage 290: 79–82. https://doi.org/10.1016/j.foreco.2012.08.014.
Saksa T, Miina J, Haatainen H, Kärkkäinen K (2018) Quality of spot mounding performed by continuously advancing mounders. Silva Fenn 52, article id 9933. https://doi.org/10.14214/sf.9933.
Salminen H, Lehtonen M, Hynynen J (2005) Reusing legacy FORTRAN in the MOTTI growth and yield simulator. Comput Electron Agric 49: 103–113. https://doi.org/10.1016/j.compag.2005.02.005.
Skogskunskap (2023) https://www.skogskunskap.se/. Accessed 27 April 2023.
Snowdon P (1991) A ratio estimator for bias correction in logarithmic regressions. Can J For Res 21: 720–724. https://doi.org/10.1139/x91-101.
Tamminen P, Mälkönen E (eds) (1999) Näytteenotto metsämaan ominaisuuksien määrittämistä varten. [Soil sampling for determining characteristics of forest soil]. Metsäntutkimuslaitoksen tiedonantoja 729: 1–54. http://urn.fi/URN:ISBN:951-40-1676-9.
Uotila K (2017) Optimization of early cleaning and precommercial thinning methods in juvenile stand management of Norway spruce stands. Diss For 231. https://doi.org/10.14214/df.231.
Uotila K, Saksa T (2021) Cost-efficient pre-commercial thinning: effects of method and season of early cleaning. Silva Fenn 55, article id 10507. https://doi.org/10.14214/sf.10507.
Uotila K, Rantala J, Saksa T (2012) Estimating the need for early cleaning in Norway spruce plantations in Finland. Silva Fenn 46: 683–693. https://doi.org/10.14214/sf.919.
Uotila K, Saksa T, Rantala J, Kiljunen N (2014) Labour consumption models applied to motor-manual pre-commercial thinning in Finland. Silva Fenn 48, article id 982. https://doi.org/10.14214/sf.982.
Uotila K, Miina J, Saksa T, Store R, Kärkkäinen K, Härkönen M (2020) Low cost prediction of time consumption for pre-commercial thinning in Finland. Silva Fenn 54, article id 10196. https://doi.org/10.14214/sf.10196.
Total of 27 references.
