Stephan Böhm  ,
Peter Baier,
Thomas Kirisits,
Christian Kanzian
,
Peter Baier,
Thomas Kirisits,
Christian Kanzian
Blue-stain development on Norway spruce logs under alpine conditions
Böhm S., Baier P., Kirisits T., Kanzian C. (2023). Blue-stain development on Norway spruce logs under alpine conditions. Silva Fennica vol. 57 no. 3 article id 23054. https://doi.org/10.14214/sf.23054
Highlights
- A nonlinear model was developed to predict the temperature-dependent spread rate of blue-stain in Norway spruce logs in alpine areas in Austria
- The influence of temperature sum on the development of blue-stain was confirmed
- The effect of harvesting season on the development and amount of sap-stain (faster and more extensive in summer than in spring) was observed.
Abstract
Discoloration of the sapwood caused by blue-stain fungi on conifer logs during interim storage causes significant loss to the forest industry. The fungal infection is often associated with bark beetle attacks because the spores are transmitted by the beetles. They can also be disseminated by rain-splash and moist air. While there are methods to protect logs from sap-stain in wood yards, this is often not possible in the forest for practical and regulatory reasons. Timing of harvesting and timely transportation are often the only ways to prevent blue-stain. To estimate the urgency of transportation, knowledge of the growth of blue-stain fungi and its dependence on weather conditions is of great interest. The proportion of discolored sapwood on Norway spruce logs was recorded along a time series, together with weather data in two field experiments conducted in spring and summer at two alpine sites in Austria. A predictive model was developed to estimate the proportion of blue-stained sapwood based on the temperature sum to which the logs were exposed. After harvest in March, there was a time lag of 82 and 97 days at the two respective sites, caused by initially low temperatures, before discoloration started. In contrast, sap-stain occurred 14 days after the harvest in June, when warm conditions prevailed from the start. The nonlinear least square regression model can help to estimate a window of opportunity to transport wood before it loses its value and serves as a sub model for lead time estimation within logistic decision support systems.
Keywords
Picea abies;
moisture content;
temperature;
weather data;
bark beetle;
predictive model;
sap-stain
-
Böhm,
Department of Forest and Soil Sciences, Institute of Forest Engineering, University of Natural Resources and Life Sciences, Vienna (BOKU), Peter-Jordan-Strasse 82, 1190 Vienna, Austria
 https://orcid.org/0000-0001-7803-6618
E-mail
stephan.boehm@boku.ac.at
https://orcid.org/0000-0001-7803-6618
E-mail
stephan.boehm@boku.ac.at
-
Baier,
Department of Forest and Soil Sciences, Institute of Forest Entomology, Forest Pathology and Forest Protection, University of Natural Resources and Life Sciences, Vienna (BOKU), Peter-Jordan-Strasse 82, 1190 Vienna, Austria
https://orcid.org/0000-0002-1029-5637
E-mail
peter.baier@boku.ac.at
-
Kirisits,
Department of Forest and Soil Sciences, Institute of Forest Entomology, Forest Pathology and Forest Protection, University of Natural Resources and Life Sciences, Vienna (BOKU), Peter-Jordan-Strasse 82, 1190 Vienna, Austria
https://orcid.org/0000-0002-9918-3593
E-mail
thomas.kirisits@boku.ac.at
-
Kanzian,
Department of Forest and Soil Sciences, Institute of Forest Engineering, University of Natural Resources and Life Sciences, Vienna (BOKU), Peter-Jordan-Strasse 82, 1190 Vienna, Austria
https://orcid.org/0000-0002-1198-9788
E-mail
christian.kanzian@boku.ac.at
Received 13 September 2023 Accepted 23 November 2023 Published 14 December 2023
Views 61757
Available at https://doi.org/10.14214/sf.23054 | Download PDF

1 Introduction
Blue-stain or sap-stain is a bluish or bluish-grey discoloration of coniferous wood that can occur on living trees, logs, sawn timber and processed wood. The discoloration is caused by dark colored hyphae that grow in the radial, nutrient-rich wood rays and in the tracheids of the axial vascular system (Ballard et al. 1982, 1984). Blue-stain on logs is mainly caused by fungi belonging to Ascomycetes in the orders Microascales (e.g. species in the genera Endoconidiophora and Graphium) and Ophiostomatales (e.g. species in the genera Grosmannia, Leptographium, Ophiostoma and Sporothrix) . These fungi are transmitted either by biotic vectors, such as bark beetles (Rice et al. 2008; McCarthy 2011; Hofstetter et al. 2015), or abiotic vectors which include moist air or raindrops. Human activities, such as the transport of infected wood or blue-stained wood residuals on harvester heads can also contribute to the spread of blue-stain fungi (Uzunovic et al. 2004).
Although various studies have confirmed that blue-stain does not have a negative effect on the mechanical properties of wood (Byrne 2003; Lum et al. 2006; Dimou et al. 2017), the discoloration is usually undesirable, especially when the timber is used for appearance-grade products. Due to blue-stain fungi logs are often downgraded to a lower quality class, which causes considerable financial loss to the forestry and timber industries (McCarthy et al. 2012).
Picea abies (L.) H. Karst. (hereafter referred to as Norway spruce or spruce) is of great ecological and commercial importance in Central Europe. In Austria, it is the most common coniferous species and the most processed tree species in the sawmill industry (BMLFUW 2022). Spruce forests met the societal needs during industrialization and were often cultivated outside the species’ natural range, due to the species’ generally wide ecological amplitude and high productivity. These stands are increasingly facing challenges related to climate change (Jandl 2020), and due to the climate change-associated rise in disturbances (Seidl et al. 2011), it can be assumed that loss due to blue-stain fungi, occurring in connection with damage caused by wind, snow and bark beetles, will continue to increase.
Forest logistics are therefore faced with challenges, such as transporting harvested timber within the window of opportunity before commercially critical amounts of staining occur. Knowledge about the development of blue-stain over time and its dependence on weather conditions is essential and can help to improve forest logistics, especially when considering the value development of already harvested timber (Jonsson 2012; Kogler and Rauch 2023) . There is substantial knowledge about blue-stain fungi in general (Kirisits 2004; Solheim 1986, 1991, 1993) and their interactions with different pine species (McCarthy et al. 2010, 2012; Millers et al. 2017; Szewczyk et al. 2020; Jankowiak et al. 2021) as well as their interactions with living Norway spruce trees (Öhrn et al. 2021; Netherer et al. 2016), but knowledge about blue-stain fungal growth in already harvested Norway spruce logs is rather limited.
The temperature to which logs are exposed has a decisive influence on the growth of blue-stain fungi in general as well as on the growth of the blue-stain fungi that are vectored by the European spruce bark beetle, Ips typographus (L.) (Seifert 1993; Friedl 2007). Miller (1980) reported that fungal growth is inhibited and may practically cease when the temperature drops below 4.4 °C or exceeds 35 °C, which is fairly in line with the findings of Millers et al. (2017), who reported that sapwood discoloration on Scots pine (Pinus sylvestris L.) logs starts when the mean daily air temperature reaches 5 °C to 6 °C and Solheim (1993), who reports minimal growth of 6 species of sap-staining fungi, that are associated with the European spruce bark beetle below 5 °C. While the influence of humidity on blue-stain growth has been described in the literature (Miller 1980), data derived from an in situ experiment (Szewczyk et al. 2020) show that air humidity has little effect on blue-stain development, while air temperature was found to be critical.
Yang and Beauregard (2001) found that sap-staining fungi did not cause significant discoloration on jack pine (Pinus banksiana Lamb.) logs within 4 weeks after spring harvest and those logs harvested in September or later could be stored until the end of April the following year. Dimou (2012) reported that conifer logs harvested in November in Greece could be stored over the winter until April without showing blue-stain. A seasonal effect was also reported by Szewczyk et al. (2020) who observed that visible blue-stain occurred within 6 to 9 weeks after spring felling and within 3 to 6 weeks after summer harvest. The mean area of blue-stain was about double after summer felling compared to spring felling.
The present study aimed to investigate blue-stain development in Norway spruce logs during storage and to determine its environmental drivers. In particular, this study aims to (1) verify the influence of the harvesting season on the development of blue-stain, (2) investigate the influence of the air temperature and the moisture content of the wood on blue-stain development and (3) attempt to develop a predictive model to estimate blue-stain growth on spruce logs over time based on weather data.
2 Materials and methods
2.1 Logs
To understand the influence of the weather on the growth of blue-stain fungi, experiments were carried out during two trial campaigns in summer 2020 and spring 2021. For this purpose, 24 Norway spruce logs with a length of about 400 cm were placed on supports at two alpine sites, “Krampen” (KRA; 47°40´N, 15°33´E, 766 m a.s.l.) and “Jagerbauerngraben” (JBG; 47°42´N, 15°21´E, 864 m a.s.l.), in Austria (Fig. 1), where they were exposed to naturally available inoculum of blue-stain fungi, i.e. attacks by bark beetles such as I. typographus and rain- and air-borne blue-stain fungi. The logs investigated in this study were affected by both origins of blue-stain, and it was not possibly to clearly determine their relative importance. The two sites are located at a wood yard (KRA) and near a wood yard (JBG) and are used for temporary storage of logs harvested from the surrounding forests. The sites were suggested by the Austrian Federal Forests because of their access to the road network and the space available for the experiment. It was not possible to conduct the experiment in the forest, under the canopy, due to concerns about possible mass propagation of bark beetles.
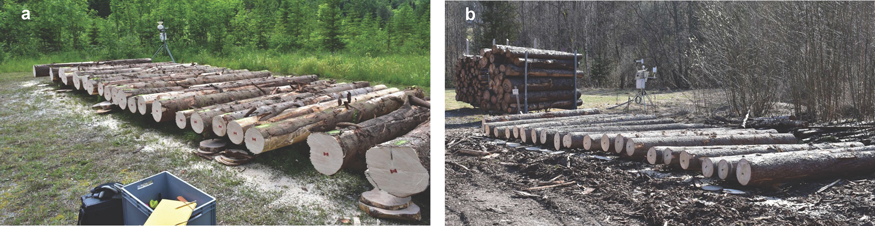
Fig. 1. Norway spruce logs at the experimental sites (a) Jagerbauerngraben in summer 2020 and (b) Krampen in spring 2021 prior to investigation of blue-stain development. In the background the weather stations are visible.
Four datasets, namely summer.JBG, summer.KRA, spring.JBG and spring.KRA were collected during the experiments. The summer campaign was conducted in 2020, while the spring experiments were conducted in 2021. The summer.KRA logs had to be cut into 200 cm pieces due to limited space at the storage location (Table 1). The logs were already infested with bark beetles and showed blue discoloration when they arrived at the trial site. They were partly harvested and processed by chainsaw and partly by a fully mechanized system. The exact harvest date of the logs sampled at both sites in summer 2020 was not recorded. Based on the observed bark beetle developmental stage (I. typographus) and log discoloration of the summer.KRA logs at the start of the trial (Table 2, T0), the time of bark beetle infestation was estimated to be the beginning of June at the latest. Spike imprints in already existing egg deposits and first larval galleries indicate that the logs origin from a salvage logging operation. the harvest date was estimated to be Jun. 26th, 2020. Furthermore, the quality of the logs was very heterogenous. All other logs were not previously infested by bark beetles. The estimated harvest date for the summer.JBG logs is Jul. 7th, 2020. The summer.JBG logs have been felled and delimbed with a chainsaw, but they show extensive bark damage and stripes of removed bark, caused by transportation and handling (Fig 1a). The spring.JBG logs were reportedly harvested and delimbed by chainsaw on Mar. 4th, 2021, and the spring.KRA logs on Mar. 19th, 2021, in the regions surrounding the trial sites and their bark was mostly intact.
| Table 1. Descriptive statistics including mean, standard deviation (sd), minimum (min), maximum (max) and piece count (n) of the length, mid-diameter and volume over bark (ob) of the Norway spruce logs that were investigated regarding blue-stain development for the trial campaigns in summer 2020 and spring 2021 at both sites, Jagerbauerngraben (JBG) and Krampen (KRA). | ||||||||||||
| summer.JBG | summer.KRA | spring.JBG | spring.KRA | |||||||||
| length [cm] | mid-diameter [cmob] | volume [m3ob] | length [cm] | mid-diameter [cmob] | volume [m3ob] | length [cm] | mid-diameter [cmob] | volume [m3ob] | length [cm] | mid-diameter [cmob] | volume [m3ob] | |
| mean | 406.50 | 31.54 | 0.32 | 204.10 | 29.21 | 0.14 | 405.75 | 34.14 | 0.38 | 404.17 | 33.92 | 0.37 |
| sd | 2.65 | 4.34 | 0.09 | 1.29 | 2.08 | 0.02 | 1.57 | 4.64 | 0.10 | 2.53 | 4.13 | 0.09 |
| min | 401.00 | 24.93 | 0.20 | 202.00 | 26.40 | 0.11 | 402.00 | 26.55 | 0.22 | 399.00 | 26.20 | 0.22 |
| max | 410.00 | 38.40 | 0.47 | 207.00 | 33.75 | 0.18 | 408.00 | 42.68 | 0.58 | 407.00 | 42.15 | 0.57 |
| n | 24 | 48 | 24 | 24 | ||||||||
| Table 2. Time scheme of sampling for both trial campaigns 2020 and 2021. T0 marks the date when the Norway spruce logs were stored at the trial sites. T1–T8 represent the sampling dates, on which log slices were cut to investigate blue-stain development. | |||||||||
| sample date ID | T0 | T1 | T2 | T3 | T4 | T5 | T6 | T7 | T8 |
| storage time 2020 (days) | 0 | 7 | 14 | 22 | 29 | 37 | 43 | 50 | 56 |
| sample date 2020 | Jul. 14th | Jul. 21st | Jul. 28th | Aug. 05th | Aug. 12th | Aug. 20th | Aug. 26th | Sept. 2nd | Sept. 8th |
| storage time 2021 (days) | 0 | 38 | 46 | 53 | 60 | 67 | 74 | 81 | 88 |
| sample date 2021 | Apr. 3rd | May. 11th | May. 19th | May. 26th | Jun. 2nd | Jun. 9th | Jun. 16th | Jun. 23rd | Jun. 30th |
The diameter of all logs was measured on both log-ends in two orthogonal directions over bark. The measurements were averaged, and a mid-diameter of each log was calculated. The log volumes were calculated using Huber`s formula (Syed Ahmad et al. 2020) . On a total of eight sampling dates per campaign (Table 2, T1–T8), four log slices were cut from each of three randomly selected logs per site according to the described cutting scheme (Fig. 2).
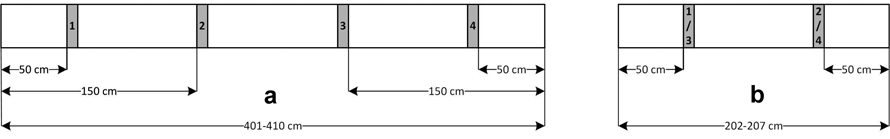
Fig. 2. Cutting scheme of the log slices that were used for the quantification of blue-stain growth in Norway spruce logs for (a) Jagerbauerngraben and Krampen 2021 and (b) Krampen 2020.
2.2 Weather data
Weather stations were installed at both sites to record air temperature, air humidity, wind speed, wind direction, liquid precipitation, and global radiation at 10-minute intervals. Values for temperature and relative humidity were aggregated to daily means and precipitation was aggregated to daily means and to daily sums for further processing (Table 3, Fig. 3ab).
| Table 3. Descriptive statistics including mean, minimum (min), maximum (max) of daily mean temperature, average relative humidity and daily precipitation for the trial sites Jagerbauerngraben (JBG) and Krampen (KRA) for the trial periods Jun. 26th (KRA) and Jul. 7th (JBG) 2020 to Sep. 8th, 2020 and Mar. 4th (JBG) and Mar. 19th (KRA) 2021 to June 30th, 2021, during which the development of blue-stain on Norway spruce logs was investigated. For precipitation the sum is also presented. | ||||||||||||
| 2020 | 2021 | |||||||||||
| Jagerbauerngraben (JBG) | Krampen (KRA) | Jagerbauerngraben (JBG) | Krampen (KRA) | |||||||||
| daily mean temperature [°C] | average relative humidity [%] | daily precipitation [mm] | daily mean temperature [°C] | average relative humidity [%] | daily precipitation [mm] | daily mean temperature [°C] | average relative humidity [%] | daily precipitation [mm] | daily mean temperature [°C] | average relative humidity [%] | daily precipitation [mm] | |
| mean | 14.86 | 87.68 | 6.35 | 14.95 | 87.26 | 4.24 | 6.57 | 79.82 | 1.80 | 7.95 | 77.89 | 2.08 |
| min | 8.63 | 70.36 | 0.00 | 9.09 | 67.66 | 0.00 | –5.64 | 50.31 | 0.00 | –4.39 | 59.39 | 0.00 |
| max | 19.78 | 100.00 | 40.20 | 20.29 | 97.34 | 50.80 | 23.11 | 99.43 | 18.40 | 20.92 | 94.26 | 19.10 |
| sum | 361.80 | 241.40 | 213.80 | 216.20 | ||||||||
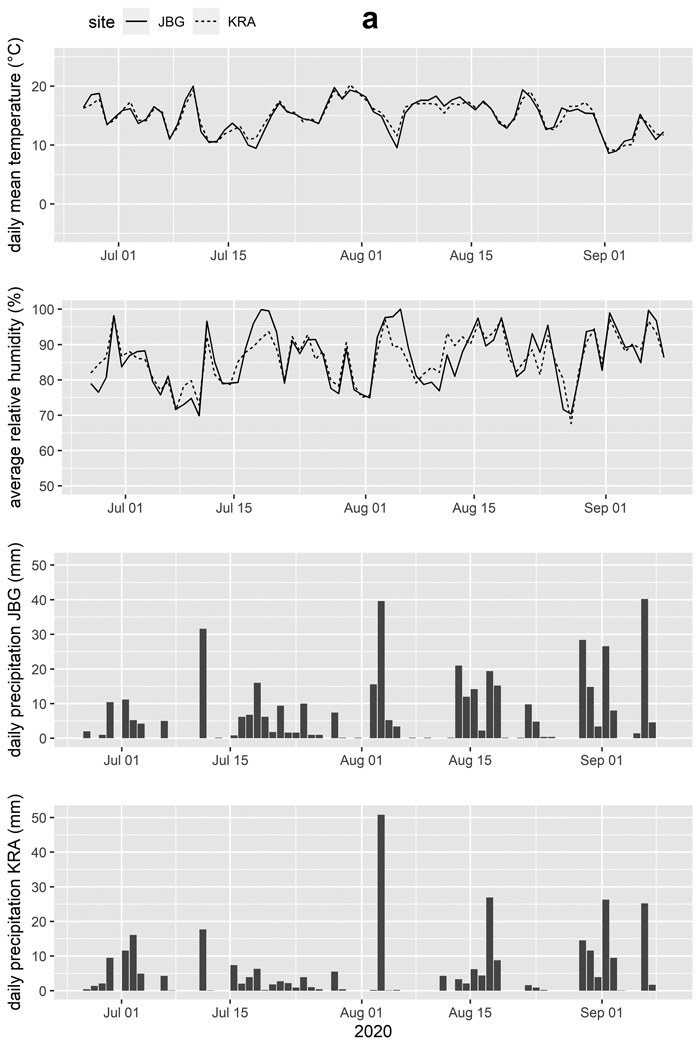
Fig. 3a. Daily mean temperature, average relative humidity and daily precipitation for the trial sites Jagerbauerngraben (JBG) and Krampen (KRA) for the trial periods (a) Jun. 26th, 2020 to Sep. 8th, 2020, during which blue-stain development in Norway spruce logs was investigated.
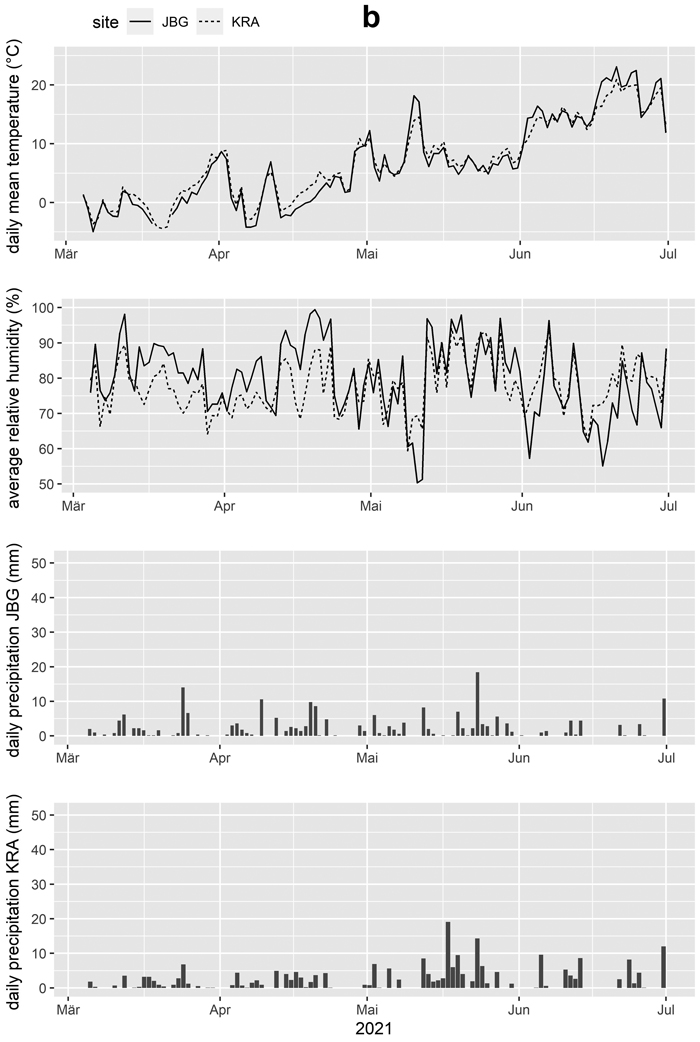
Fig. 3b. Daily mean temperature, average relative humidity and daily precipitation for the trial sites Jagerbauerngraben (JBG) and Krampen (KRA) for the trial periods Mar. 4th, 2021 to Jun. 30th, 2021, during which blue-stain development in Norway spruce logs was investigated.
The logs were checked weekly and their condition in terms of bark beetle infestation and blue-stain appearance was documented, but no samples were taken until infestation with I. typographus, the presumed main vector of blue-stain fungi on Norway spruce, was either predicted by the phenology model PHENIPS (Baier et al. 2007) or observed in the field. Due to prevailing weather conditions in 2020, the colonization of the logs by bark beetles at the JBG site was observed successively after the start of the trial (Table 2, T0). The 2021 experimental campaign started in early spring, when relatively cool weather conditions prevailed. Therefore, bark beetle swarming and infestation as well as infection by blue-stain fungi was not expected. This resulted in a longer storage period compared to the 2020 trial campaign. The first sampling began on May. 11th, 2021, after the observed as well as predicted onset of bark beetle infestation. From the first sampling date when probes were taken (T1), samples were taken weekly (T2–T8) to map the development of blue-stain in the sapwood over time.
2.3 Log slice processing
After cutting slices of the logs, the boundary between sapwood and heartwood was marked with a felt-tip pen. The logs were digitized using a tripod-mounted digital camera with a fixed focal length of 30 mm (Nikon D5500 and Sigma 30/1.4) and a resolution of 24 MegaPixel (MP). Since the low contrast between discolored and unstained sapwood surfaces makes automatic detection as described by Schubert et al. (2011) very difficult, the images were manually colorized using image processing software (GIMP - GNU Image Manipulation Program - version 2.10, 2018). To colorize the images, they were first converted from JPG format to the native XCF format of GIMP. Since there was no function in the program to convert multiple images at once, and the individual conversion is a very time-consuming task, a python-fu script “Import JPG to XCF” was written. It allows to select many JPG files at the same time, convert them to XCF files and place the generated files in a defined folder. The XCF files contain the 24 MP images (aspect ratio 3:2) of the log slices. Four additional layers were created on top of this, in which the specific areas “sapwood without discoloration” (yellow), “heartwood” (red), “blue-stained sapwood” (blue), which have been grouped into “coloring layers”, and “scale bar” (black) were marked. In the “coloring layers”, the edges of the corresponding areas on the photo were traced by hand using a “Wacom Intuos creative pen and touch tablet”. In the image processing software, the “pencil” tool was selected (pencil size: 3 pixel, pencil hardness: 100). All other parameters of the tool were set to 0, “Dynamics” was turned off, and zoom was enabled to increase accuracy. A centimeter scaling frame was imaged along with each of the log slices (Fig. 4a). A black scale bar was digitally placed over this centimeter scale in the “scale bar” layer (Fig. 4b). It covers 20 cm of the scaling and was drawn with a width of 100 pixel using the appropriate presets of the pencil tool. The bottom layer, which contains the original image, was then turned off so that only the colored areas and the scale bar were visible, and the background was transparent (Fig. 4c). The resulting image was then saved in PNG format. To enable a simultaneous export of all files opened in GIMP, another python-fu-script “Export all opened images to PNG” was written.
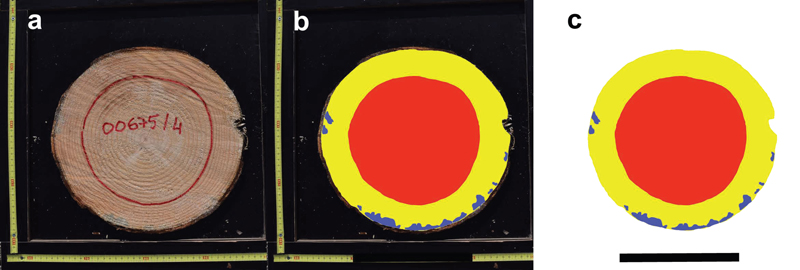
Fig. 4. (a) Norway spruce log disk 00675-4 cut at the experimental site Jagerbauerngraben at Aug. 12th, 2020 after 29 days of log storage. (b) On the log slice digitally colored areas “sapwood without discoloration” (yellow), “blue-stained sapwood” (blue) and “heartwood” (red) and (c) PNG file prepared for analysis with scaling bar. In this example, 5.56% of the sapwood area is discolored by sap-stain fungi.
A custom R script then performed the fully automated analysis of the PNG files. The script counts the number of pixels per color in the images, defined by their RGB values. Using the information that the number of black pixels (scale bar) in the image divided by 100 equals 20 cm, the area of each color could be calculated in cm2. It was also possible to calculate the ratio between the colors, i.e., the ratio of the blue-stained sapwood area to the total sapwood area or the total area of the log cross section. Using the unique identification numbers of the log slices, consisting of the sample log identification number, the disc position number in the log, and the date each log disc was sampled, the calculated area data were linked to the weather data for further statistical analysis.
Subsequently, an image analysis software (Datinf Measure 3) was used to determine the absolute area fractions of the log slices from the 2020 test campaign, subdivided into “heartwood”, “sapwood without discoloration”, and “sapwood with discoloration”. The values obtained in this way serve as reference values for testing the plausibility and accuracy of the automatic area determination routine.
The moisture content and wood density were also determined from all log slices without distinguishing between sapwood and heartwood. For this purpose, the freshly collected samples were weighed on site with a precision scale (Kern DS 30K0.1) and then dried in a drying cabinet. The drying process was carried out according to DIN EN ISO 18134-1:2015-12 (2015) . The samples were kept in the drying cabinet at a temperature of 102.5 °C until they had reached a constant moisture equilibrium. During the drying process, the bark often separated from the wood. Therefore, each sample was dried in its own paper bag, which makes it possible to match the detached bark to the correct log. Another advantage of the paper bags is that they prevent resin from dripping out of the sample during the drying process. This would distort the results in two ways. On the one hand, the weight is missing in the sample from which it drips, and on the other hand, it puts additional weight on the sample below on which it drips. An initial check weighing was performed after a minimum of 48 hours, followed by weighing every 24 hours. A sample was considered dry if its weight did not change by more than 1% of the initial fresh weight within 24 hours. Moisture content was then calculated using Eq. 1:

where:
mc = moisture content (%)
wf = fresh weight (g)
wd = dry weight (g)
The density was determined according to Archimedes’ principle. For this purpose, a container with water was placed on a digital scale and the log slices were immersed in the water. Since many air bubbles adhere around freshly dried log slices, which could alter the buoyancy, a few drops of dishwashing detergent were added to the water to improve wetting. Prior to immersion, the kiln-dried specimens were debarked by hand, the bark collected, and weighed separately. Wood density was then calculated using Eq. 2:

where:
ρ = density (kg m–3)
wd = dry weight (g)
wb = weight of dry bark (g)
wh = weight of displaced water (g)
To relate the proportion of blue-stained sapwood (BSA) from the log slices to temperature data, the mean daily temperature sum (MDTS) above 5 °C, to which the logs were exposed during the storage period was calculated for each log slice. Because most blue-stain fungi do not grow, or grow minimally, at temperatures below 5 °C (Solheim 1993; Miller 1980; Millers et al. 2017) only data from days with a mean temperature above 5 °C were considered. A schematic diagram of the experiment is shown in Fig. 5.
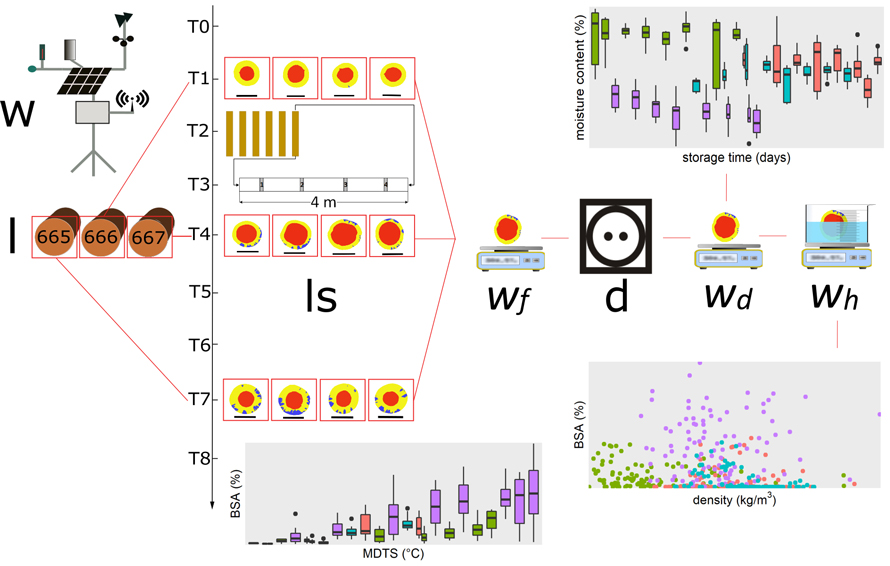
Fig. 5. Schematic diagram of the experiment (w = weather station, l = Norway spruce logs, ls = log slices with digitally colorized heartwood, sapwood and blue-stained sapwood as well as the scale bar, wf = fresh weight, d = dry cabinet, wd = dry weight, wh = weight of displaced water).
2.4 Analysis
The logs and weather data are presented as descriptive statistics. Prior to statistical analysis, a series of descriptive plots was created for visual evaluation of factors and variables related to moisture content, wood density, and BSA.
Statistical analysis was then performed using various regression techniques. Multiple comparisons of means were performed using Tukey’s honestly significant difference (HSD) test. Analysis of Covariance (ANCOVA) was used to understand the relationship between moisture content and density.
Linear regression models were used to test the influence of temperature on the proportion of blue-stain on the log cross sections. A linear interaction (LI) model and a linear mixed effects (ME) model were set up to account for possible effects between experimental sites and harvesting season. Based on the assumption that MDTS = 0means BSA = 0, the linear models were forced to pass through the origin to avoid negative predicted values.
To test the hypothesized influence of the temperature on the development of blue-stain, the observed BSA on log slices cut at sample dates T1–T8 was correlated with the MDTS above 5 °C to which the spruce logs were exposed during storage. Site and season were included as factors to test for interactions and random effects. The model hypothesis is formulated in Eq. 3:
![]()
where:
BSA = blue-stained sapwood area (%)
MDTS = mean daily temperature sum above 5 °C (°C)
Linear models often provide a very limited picture of reality, as many relationships in nature do not follow linearity, and it is worth trying to fit a non-linear (NL) model. Hence, a simple logistic growth function was fitted to the data according to the model hypothesis formulated in Eq. 4:

where:
BSA = blue-stained sapwood area (%)
MDTS = mean daily temperature sum above 5 °C (°C)
Forcing the linear regressions through the origin increases the coefficient of determination (R2/R2 adj.). Therefore, Akaike’s Information Criterion (AIC) and Root Mean Square Error (RMSE) are used to compare and evaluate the performance of the models.
All statistical analyses were performed using the statistical software R (R Core Team 2022). The packages “xlsx” (Dragulescu and Arendt 2022) and “openxlsx” (Schauberger and Walker 2021) were used for data import and export. All plots were generated with “ggplot2” (Wickham 2016). Tuckey’s HSD test was performed with the help of the “multcomp” package (Hothorn et al. 2008). Databases used for taxonomic nomenclature are the Missouri Botanical Garden (2023) and Robert et al. (2005).
3 Results
3.1 Moisture content
As shown in Fig. 6 the moisture content of the summer.KRA log slices, which were already infested by bark beetles at T0, was significantly lower than that of the other logs. Compared to the fresh logs that were studied at both sites JBG and KRA in spring 2021, the fresh logs that were studied at JBG in summer 2020 had a significantly higher moisture content. Over the storage time, the moisture content decreased for all datasets except spring.KRA, which shows a clear increase from T1 to T3, and slight decrease or no systematic change from T3 to T8.
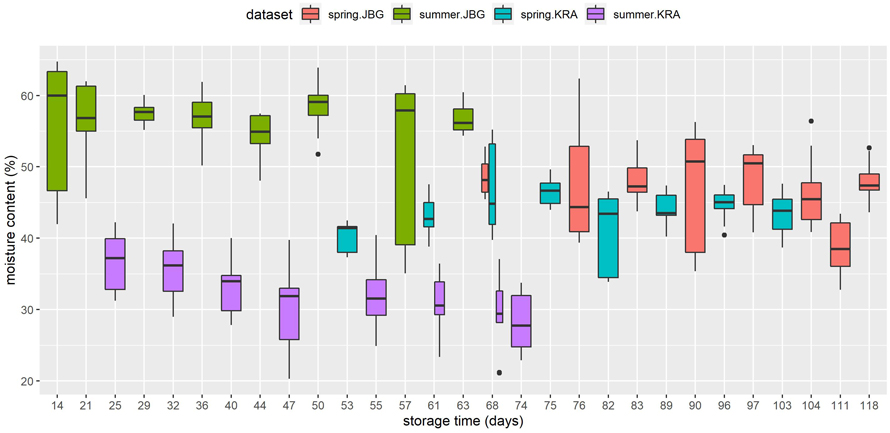
Fig. 6. Moisture content (%) of the Norway spruce log slices (sapwood and heartwood), which were used for the quantification of blue-stain development, in relation to storage time (days) for each dataset.
3.2 Density
The wood density of the investigated spruce logs (Table 4) ranged from 319 kg m–3 to 594 kg m–3 with a mean of 431 kg m–3 and a standard deviation of 51 kg m–3. While there was no significant difference between summer.KRA and spring.JBG, the wood density of summer.JBG was with a mean of 375.0 kg m–3 and a standard deviation of 46 kg m–3 significantly lower. With a mean of 464 kg m–3 and a standard deviation of 31 kg m–3 the wood density of spring.KRA was significantly higher compared to all other datasets, as shown by Tukey’s HSD test (p < 0.001, R2 = 0.43, CL = 95%).
| Table 4. Descriptive statistics of the density of the Norway spruce log slices, that were used to quantify blue-stain development, including the results of Tukey’s HSD test, mean, standard deviation (sd), minimum (min), maximum (max), the 5th,50th and 95th percentiles for the four datasets from both trial sites JBG and KRA and both trial campaigns in 2020 and 2021. The significance letters “a”, “b” and “c” in the Tukey’s HSD row indicate significant differences between the datasets with a confidence level of 0.95. | |||||
| density [kg m–3] | |||||
| summer.JBG | summer.KRA | spring.JBG | spring.KRA | overall | |
| Tukey’s HSD | a | b | b | c | |
| mean | 375 | 438 | 444 | 464 | 431 |
| sd | 46 | 40 | 36 | 31 | 51 |
| min | 319 | 368 | 380 | 400 | 319 |
| 5% | 327 | 378 | 395 | 414 | 340 |
| 50% | 364 | 432 | 440 | 463 | 431 |
| 95% | 454 | 505 | 507 | 517 | 509 |
| max | 560 | 594 | 570 | 531 | 594 |
| n | 96 | 96 | 96 | 96 | 384 |
Furthermore, a significant negative relationship between density and moisture content was observed when considering the whole data set (p < 0.001, R2 = 0.78). When looking at most of the sample dates separately (except T3 and T8), there was a negative relationship with different significance levels, when considering interactions. Ignoring possible interactions coming from site and season resulted in a significant relationship between moisture content and density for all sample dates with different levels of significance (p < 0.001 – p < 0.1).
3.3 Observed onset of blue-stain development
During the trial campaign in summer 2020 initial sap-stain was already visible after 14 days of storage at JBG. The logs that were delivered to the KRA site already showed blue-stain when delivered at T0. During the trial campaign in spring 2021, it took 82 (site KRA) or 97 days (site JBG) until blueish discoloration was observed (Fig. 7). Regarding MDTS, first discolorations were recognizable after exposure of the logs to temperature sums of at least 124 °C at JBG in 2020 and 190 °C at both sites JBG and KRA in 2021 (Fig. 8).
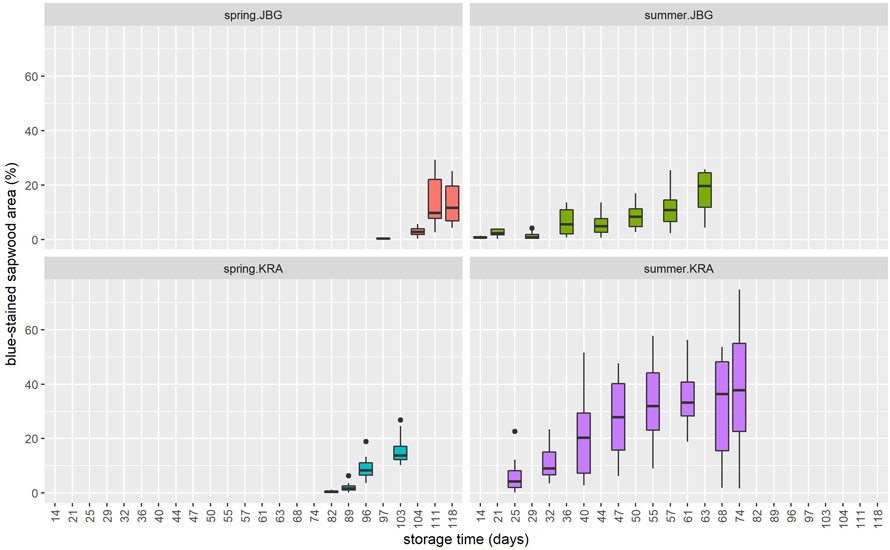
Fig. 7. Percentage of blue-stained sapwood area on Norway spruce log slices depending on the storage time (days), separated by site (KRA = Krampen, JGB = Jagerbauerngraben) and season (spring or summer). For clarity, the data is not displayed in this graph when the value for the relative blue-stained sapwood area is 0.
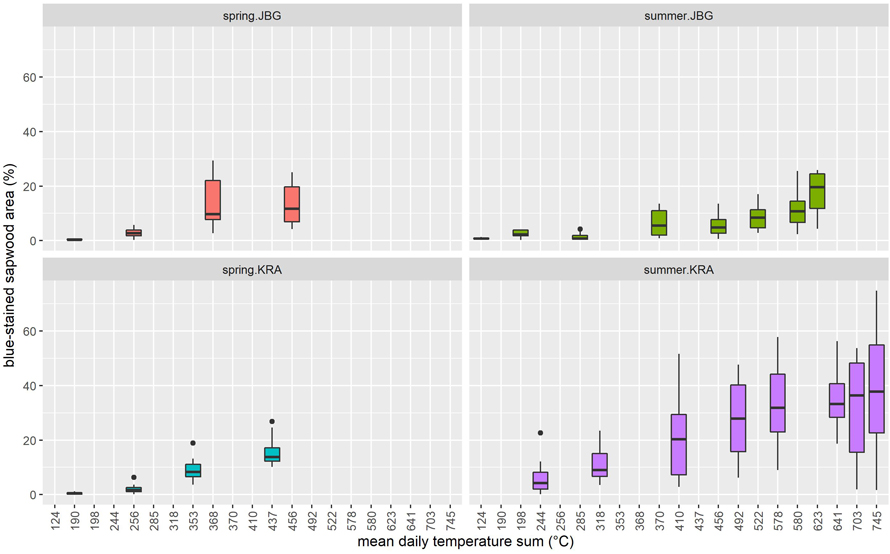
Fig. 8. Percentage of blue-stained sapwood area on Norway spruce log slices depending on the mean daily temperature sum (°C) above 5 °C, separated by site (KRA = Krampen, JGB = Jagerbauerngraben) and season (spring or summer). For clarity, the data is not displayed in this graph when the value for the relative blue-stained sapwood area is 0.
3.4 Modeling blue-stain growth
The moisture content of the log slices, the wood density and air humidity were found to have no significant effect on the BSA when ANCOVA was applied to the datasets summer.JBG, spring.JBG and spring.KRA. However, there was a significant relationship between moisture content and BSA when the compromised dataset summer.KRA was incorporated because its moisture content was extraordinarily low and the BSA was extraordinarily high due to pre-harvest bark beetle infestation and fungal inoculation.
The results of the ANCOVAs are presented in Table 5. The LI model supports the hypothesis that the effective MDTS above 5 °C had a significant effect (p < 0.001) on the development of blue-stain fungi. Furthermore, there were significant interactions with the factors site and season. While the differences between all datasets were significant, the summer.KRA data particularly were out of line, as indicated by the relatively high estimate of site [KRA] × season [summer] interaction (13.72) compared to the estimates of the other datasets and the total data.
| Table 5. Summary of the results of the ANCOVAs, which tested the effect of the mean daily temperature sum to which the Norway spruce logs were exposed, on the percentage of sapwood that was discolored by sap-staining fungi, taking site effects, season effects and interactions into account (LI, ME, MDTS = mean daily temperature sum, R2 = coefficient of determination, σ2 = variance of the residuals, τ00 = variance of random effects, RMSE = root mean square error, AIC = Akaike’s information criterion). | ||||||
| Predictors | Linear Interactions (LI) | Mixed Effects (ME) | ||||
| Estimates | CI | p | Estimates | CI | p | |
| MDTS | 0.04 | 0.04 – 0.05 | <0.001 | 0.03 | 0.03 – 0.04 | <0.001 |
| site [JBG] | –5.33 | –7.39 – –3.28 | <0.001 | |||
| site [KRA] | –5.36 | –7.40 – –3.32 | <0.001 | |||
| season [summer] | –5.25 | –7.88 – –2.63 | <0.001 | |||
| site [KRA] × season [summer] | 13.72 | 10.25 – 17.19 | <0.001 | |||
| Random effects: | ||||||
| σ2 | 18.88 | |||||
| τ00 | 0.00 site | |||||
| 31.61 season | ||||||
| Observations | 384 | 288 | ||||
| R2 / R2 adjusted | 0.756 / 0.753 | |||||
| Marginal R2 / Conditional R2 | 0.643 / NA | |||||
| RMSE | 8.40 | 4.32 | ||||
| AIC | 2736.701 | 1692.266 | ||||
Hence, the summer.KRA data was excluded in a next step. To ensure, that the site and seasonal effects did not interfere with the effect of the MDTS and jeopardize the model, the two factors were treated as random effect variables in the ME model. The factors “site” and “season” showed a variance (τ00) of 0.00 and 31.61, respectively, indicating that the site has no effect on the BSA with the reduced dataset, while in contrast, there was a random effect originating from the season.
However, after eliminating the site effect and quantifying the seasonal effect, a predictive model driven only by temperature data would be preferable from an application perspective. Therefore, a non-linear (NL) regression model was generated. The results of the nonlinear least squares regression are shown in Table 6. The model estimates two parameters (a, b). The parameter “a” represents the amplitude of the exponential curve, while “b” represents the rate of decay of the exponential curve. The model estimates that the value of b is –662.17 with a standard error of 71.81, while the value of a is estimated to be 43.87 with a standard error of 6.85. Estimates both for “a” and “b” are statistically significant (p < 0.001). The variance explained by the NL model (R2) is 0.56. The AIC with 1687.284 is lower compared to the fitted linear regression models (LI, ME) indicating a better explanation of the data. The RMSE is 4.48 and is somewhat larger than the RMSE of the ME model (4.32). This indicates that the average magnitude of the prediction errors is 0.16% BSA larger for the NL model, compared to the ME model. The regression line of the NL model is plotted along with the underlying data points in Fig. 9a. In Fig. 9b the observed BSA is plotted against the BSA predicted by the NL model. The datapoints are clustered below the dashed line that represents the line of perfect fit, which indicates that the NL model is generally overestimating the BSA. This is especially true for the early stages during spring storage and for the entire summer storage period, while the model underestimates the BSA of logs harvested in spring towards the end of the storage period in June 2021 (T7, T8) after the air temperature had increased.
| Table 6. Summary of the results of the non-linear least square regression analysis, which tested the effect of the mean daily temperature sum to which the Norway spruce logs were exposed, on the percentage of sapwood that was discolored by sap-staining fungi (R2 = coefficient of determination, RMSE = root mean square error, AIC = Akaike’s Information Criterion). | |||||
| Non-Linear (NL) | |||||
| Term | Estimates | Std.error | t-statistics | p | CI95 |
| a | 43.87 | 6.85 | 6.40 | <0.001 | 30.37, 57.36 |
| b | –662.17 | 71.81 | –9.22 | <0.001 | –803.63, –520.70 |
| Observations | 288 | ||||
| R2 | 0.56 | ||||
| RMSE | 4.48 | ||||
| AIC | 1687.284 | ||||
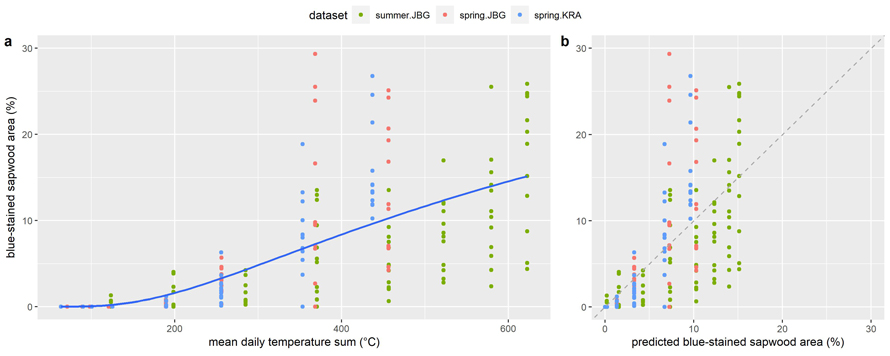
Fig. 9. Percentage of blue-stained sapwood area on Norway spruce log slices in relation to (a) mean daily temperature sum (°C) above 5 °C including the regression line of the NL model (Table 6) that was obtained from the datasets summer.JBG, spring.JBG and spring.KRA and (b) the percentage of blue-stained sapwood, that was predicted by the NL model. The dashed line represents the line of perfect fit (y = x). View larger in new window/tab.
4 Discussion
4.1 Moisture content and wood density
The observed differences in moisture content between the two data sets, summer.JBG and summer.KRA, as shown in Fig. 6, are most likely due to a synergistic effect between the low wood density of the former and the prior bark beetle infestation of the latter. The exceptionally high moisture content of the fresh summer.JBG logs is most likely due to their low wood density. The differences in wood density within a species of ring porous and most conifer wood depend on the width of the tree rings (Friend et al. 2022), which were apparently wider than in the other samples. The proportion of early wood is high, which provides more space for voluminous xylem cells where water could be transported and stored (Hao et al. 2013).
The low and even negative drying rates observed in 2021 were caused by the cold and wet weather conditions (Fig. 3b) that prevailed at the trial site in April and May, which determine log drying rates (Erber et al. 2015). Although the bark beetle-infested summer.KRA logs were already relatively dry when delivered to the trial site, further decrease of moisture content during on-site storage between T1 and T8 was the highest among the four datasets.
It has been reported in the literature that extraordinarily high moisture content in freshly cut wood inhibits fungal growth (Seifert 1993), but considering the immediate blue-stain onset in the summer.JBG logs, which had the highest moisture content among the datasets, an appropriate limit was not exceeded.
4.2 Blue-stain development and air temperature
The observed differences in onset time, measured in days, between the two trial campaigns 2020 and 2021 as shown in Fig. 7 are most likely due to the different harvesting seasons. The relatively cold weather conditions in April 2021 (Fig. 3b) hindered bark beetle activity and probably hampered transmission of air- and waterborne spores, what delayed the appearance of sap-stain at both sites.
In contrast, warm weather conditions prevailed in June 2020 (Fig. 3a). Ips typographus was already modeled to be active at T0 by PHENIPS (Baier et al. 2007), but bark beetle infestation of the summer.JBG logs was not observed until T2 (Kanzian et al. 2021; Rauch et al. 2022) . However, slight blueish discoloration caused by sap-stain fungi was detected on four of the twelve log slices that were cut at T1. This leads to the conclusion that the early appearance of blue-stain on summer.JBG logs is primarily due to airborne blue-stain introduced through the extensive bark injuries caused by logging and transportation. Although many discolored areas are surrounded by bark, but blue-stain fungi can also penetrate through microscopically small injuries to the bark or trunk surface.
The observed effect of harvesting season on the onset time of blue-stain development and the results from the mixed effects model indicate that the harvesting season has a decisive influence. As one of the summer datasets was compromised due to bark beetle infestation prior to storage, these findings should be treated as a strong hint but further research for validation is necessary. However, the findings are consistent with the results of Yang and Beauregard (2001), who found no significant discoloration caused by blue-stain fungi on jack pine logs during the first 4 weeks after spring harvest and the results of Szewczyk et al. (2020) that show quicker blue-stain onset after summer felling than after spring felling. Furthermore, McCarthy et al. (2012) found that sap-staining increased more rapidly after summer felling compared to winter felling, where a lag phase was observed before temperatures rose and sap-staining increased. This is consistent with the findings of Dimou (2012), showing that logs harvested in late fall could be stored over winter without any development of blue-stain.
The significant difference in onset of discoloration in relation to MDTS above 5 °C (Fig. 8) between the two campaigns 2020 and 2021 is partly due to the described seasonal effect and partly because the summer.KRA logs were already infested by bark beetles at the beginning of the experimental period.
A possible explanation for the underestimation of BSA by the NL model towards the end of the storage period after spring harvest could be the increased growth rate as the air temperature approaches the temperature optimum for blue-stain fungal growth, which is for many species between approximately 23.9 °C and 29.4 °C, as reported by Miller (1980).
The model overestimated the BSA at the logs from the summer.JBG dataset. A possible explanation could be that the logs were heavily damaged during transportation leaving a low amount of undamaged bark (Fig. 1a), which serves as breeding material for phloem feeding insects that were assumed to be vectors of blue-stain fungi. This is in contrast to the findings of Szewczyk et al. (2020) and Uzunovic et al. (1999), who showed that mechanically harvested wood is more susceptible to blue-stain fungi compared to wood that was felled and delimbed by chainsaw, due to the extensive bark damage caused by the processor. However, this is not necessarily in conflict with the present results, because then bark beetles were excluded as vectors but fungal spores were transmitted by small arthropods or abiotically, and pine species are quite susceptible to these means of blue-stain fungal transmission. Following this line of reasoning might lead to the conclusion that the relative importance of abiotic vectors was small after bark beetle infestation between T1 and T2.
4.3 Predicting blue-stain development
As a result of technological advances and increasing computing power (Bauer et al. 2015), weather- and short- to medium-term climate models such as the ECMWF (European Centre for Medium-Range Weather Forecasts) model are now reliable enough to provide fairly accurate estimates of expected daily mean temperatures for a few weeks. This recent development allows the implementation of weather- and climate forecast models in operational management tasks.
Having that in mind, the NL model could deliver valuable information about forthcoming sap-stain development. With the introduction of a threshold value for degradation of log quality to a lower class, the predictive model could serve as a tool within a decision support system to estimate lead times and develop quality based transportation strategies (Kogler and Rauch 2023) . A survey of professionally trained wood inspectors, who evaluated and classified images of log ends with varying degrees of blue-stain, found that logs with more than 5% blue-stain over the total cross sectional area were likely to be downgraded to a lower quality class (Kanzian et al. 2021; Rauch et al. 2022) . Considering a ratio of 0.50 between sapwood and total cross-sectional area within the reduced data set, a threshold value of 10% BSA can be assumed. Based on this assumption and the results of the NL model, a degradation to a lower quality class and consequently a significant loss in value would occur after reaching a MDTS of 448 °C under the given circumstances. This estimate could be used to assess the urgency of transport out of the forest to avoid financial losses from blue-stain fungi.
4.4 Limitations of the study
The authors are aware, that the experimental design has some weaknesses. One could only make an educated guess as to how long the logs were stored before being delivered to the experimental site, because the exact harvesting date is unknown. Quantifying the BSA found on the logs at T0 and an exact harvesting date would have allowed reasonable incorporation of this data set into the model, but this was not done because the experiment was designed for fresh logs without any discoloration.
Another flaw in the experimental design is that the logs were laid side by side rather than in a stack (Fig. 1). This was necessary to allow access for weekly sampling to obtain data for a time series. As a result, the sun shined directly on the topside of the logs, which considerably increased the bark temperature and may have degraded the habitat quality for the phloem feeding insects, which are thought to be important vectors of blue-stain fungi. In addition, drying rates in the sun-facing parts of the logs are likely to be higher than in the ground-facing parts, implying differences in substrate quality for sap-stain fungi. It was observed that sap-staining occurred mostly at the ground- and side-facing parts of the logs, which leads to the conclusion that the percentage of BSA in a wood stack would be higher.
Furthermore, distinguishing between sapwood and heartwood, and further between sun- and ground-facing sapwood in the determination of moisture content and density may have increased resolution and provided further insights but was not feasible due to labor and time constraints in this study.
5 Conclusions
An experiment was conducted over two years and at two different sites to understand the effect of temperature on the development of blue stain on Norway spruce logs. Strong evidence for a harvesting season effect was found. The influence of the temperature sum to which the logs had been exposed since harvest was confirmed and a non-linear model was developed to use temperature data to infer on blue-stain development over time. Based on the model metrics and residual analysis, the nonlinear approach seems to provide valuable insights, considering that the dependence of blue-stain development on temperature is most interesting in its early stages, before degradation to a lower quality class could occur. With the increasing accuracy of weather forecasting, a predictive model to estimate the timing of this degradation could be of practical use and serves as a sub-model for simulating wood quality degradation. However, further research is needed to better understand the temperature dependence of blue-stain spread and to address questions that were left open in the present study.
Acknowledgements
The authors gratefully acknowledge the contribution made by Thomas Holzfeind, former employee of the Institute of Forest Engineering of the University of Natural Resources and Life Sciences, Vienna (BOKU). We would also like to thank Friedrich Zott, staff member of the Institute of Mountain Risk Engineering (BOKU), for the technical support with the weather stations, and Österreichische Bundesforste AG, in particular Stefan Friedl and his team as well as Monika Kanzian, for the support and materials provided.
Funding
This research was funded within the GreenLane project by the Austrian Federal Ministry of Agriculture, Forestry, Environment and Water Management (ForestValue Joint Call 2017) and Österreichische Bundesforste AG.
Authors’ contribution
| S. Böhm | P. Baier | T. Kirisits | C. Kanzian | ||
| Concept development | x | x | |||
| Method development | x | x | x | x | |
| Data Acquisition | x | x | x | ||
| Data analysis | x | x | |||
| Interpretation of data and results | x | x | |||
| Scientific writing | x | ||||
| Critical revising | x | x | x |
Declaration of openness of research materials, data, and code
- The used data is available as R - data frame and the R - code for the statistical analysis is available under https://doi.org/10.5281/zenodo.10203190.
- The investigated spruce logs are not available anymore. They were in the possession of the Austrian Federal Forests and their fate is unclear. However, images of the log slices as shown in Fig. 4a and Fig. 4c are available upon request.
- The study is not preregistered.
- The analysis plan is not preregistered.
References
Baier P, Pennerstorfer J, Schopf A (2007) PHENIPS – a comprehensive phenology model of Ips typographus (L.) (Col., Scolytinae) as a tool for hazard rating of bark beetle infestation. Forest Ecol Manag 249: 171–186. https://doi.org/10.1016/j.foreco.2007.05.020.
Ballard RG, Walsh MA, Cole WE (1982) Blue-stain fungi in xylem of lodgepole pine: a light-microscope study on extent of hyphal distribution. Can J Botany 60: 2334–2341. https://doi.org/10.1139/b82-285.
Ballard RG, Walsh MA, Cole WE (1984) The penetration and growth of blue-stain fungi in the sapwood of lodgepole pine attacked by mountain pine beetle. Can J Bot 62: 1724–1729. https://doi.org/10.1139/b84-233.
Bauer P, Thorpe A, Brunet G (2015) The quiet revolution of numerical weather prediction. Nature 525: 47–55. https://doi.org/10.1038/nature14956.
BMLFUW (2022) Holzeinschlagsmeldung über das Kalenderjahr 2021. [Logging report on the calendar year 2021]. Prem J, Bauer H (eds) Bundesministerium für Land- und Forstwirtschaft, Umwelt und Wasserwirtschaft. Vienna, Austria.
Böhm S, Kanzian C (2023) Dataset used in the paper ‘Blue stain development on Norway spruce (Picea abies (L.) H. Karst.) logs under alpine conditions’. Zenodo [Data set]. https://doi.org/10.5281/zenodo.10203190.
Byrne A (2003) Characterising the properties of wood containing beetle-transmitted bluestain: background, material collection, and summary of findings: part A. Forestry Innovation Investment, Vancouver, British Columbia.
Dimou V (2012) Harvest-time related blue-stain spread in logs in the forest of Elatia, Greece. Wood Res-Slovakia 57: 241–250.
Dimou V, Kaziolas DN, Zygomalas I, Avtzis N (2017) Influence of biotic factors on the mechanical properties of wood, taking into account the time of harvesting. Wood Sci Technol 12: 140–148. https://doi.org/10.1080/17480272.2015.1063004.
DIN EN ISO 18134-1:2015-12 (2015) Solid biofuels: determination of moisture content: oven dry method – Part 1: Total moisture - reference method.
Dragulescu A, Arendt C (2022) xlsx: read, write, format Excel 2007 and Excel 97/2000/XP/2003 files R package version 0.6.5.9000. https://github.com/colearendt/xlsx.
Friedl K (2007) Blue stain on Norway spruce – quality loss and effect on the storage time. In: Kanzian C (eds) Meeting the needs of tomorrows´ forests – new developments in forest engineering. Proceedings of Austro2007/FORMEC´07 Vienna and Heiligenkreuz. University of Natural Resources and Life Sciences, Vienna, Austria.
Friend AD, Eckes-Shephard AH, Tupker Q (2022) Wood structure explained by complex spatial source-sink interactions. Nat Commun 13, article id 7824. https://doi.org/10.1038/s41467-022-35451-7.
Hao G-Y, Wheeler JK, Holbrook NM, Goldstein G (2013) Investigating xylem embolism formation, refilling and water storage in tree trunks using frequency domain reflectometry. J Exp Bot 64: 2321–2332. https://doi.org/10.1093/jxb/ert090.
Hofstetter RW, Dinkins-Bookwalter J, Davis TS, Klepzig KD (2015) Symbiotic associations of bark beetles. In: Vega FE, Hofstetter RW (eds) Bark beetles. Elsevier, pp 209–245. https://doi.org/10.1016/B978-0-12-417156-5.00006-X.
Hothorn T, Bretz F, Westfall P (2008) Simultaneous inference in general parametric models. Biometrical J 50: 346–363. https://doi.org/10.1002/bimj.200810425.
Jandl R (2020) Climate-induced challenges of Norway spruce in Northern Austria. Trees For People 1, article id 100008. https://doi.org/10.1016/j.tfp.2020.100008.
Jankowiak R, Szewczyk G, Bilański P, Jazłowiecka D, Harabin B, Linnakoski R (2021) Blue‐stain fungi isolated from freshly felled Scots pine logs in Poland, including Leptographium sosnaicola sp. nov. Forest Pathol 51, article id e12672 51. https://doi.org/10.1111/efp.12672.
Jonsson M (2012) Dry and wet storage of Picea abies and Pinus contorta roundwood with and without bark. Wood Mater Sci Eng 7: 41–48. https://doi.org/10.1080/17480272.2012.654819.
Kanzian C, Holzfeind T, Böhm S, Gobakken LR, Baier P, Kirisits T, Eliasson L, Kogler C, Rauch P, Fjeld D (2021) Validated value development sub-models. GreenLane Technical Note 2: 1–57. https://www.scopus.com/inward/record.uri?eid=2-s2.0-85153471768&partnerID=40&md5=0b5a7e41821825407912a586b0074f2c.
Kirisits T (2004) Fungal associates of european bark beetles with special emphasis on the ophiostomatoid fungi. In: Lieutier F, Day KR, Battisti A, Grégoire J-C, Evans HF (eds) Bark and wood boring insects in living trees in Europe, a synthesis. Dordrecht, Springer Netherlands, pp 181–236. https://doi.org/10.1007/978-1-4020-2241-8_10.
Kogler C, Rauch P (2023) Lead time and quality driven transport strategies for the wood supply chain. Res Transp Bus, article id 100946. https://doi.org/10.1016/j.rtbm.2023.100946.
Lum C, Byrne T, Casilla R (2006) Mechanical properties of lodgepole pine containing beetle-transmitted blue stain. Forest Prod J 56: 45–50.
McCarthy JK (2011) The role of bark beetles as vectors in the colonisation of windthrown timber by fungi. University of Canterbury.Canterbury, New Zealand.
McCarthy JK, Hood IA, Brockerhoff EG, Carlson CA, Pawson SM, Forward M, Walbert K, Gardner JF (2010) Predicting sapstain and degrade in fallen trees following storm damage in a Pinus radiata forest. Forest Ecol Manag 260: 1456–1466. https://doi.org/10.1016/j.foreco.2010.07.044.
McCarthy JK, Hood IA, Kimberley MO, Didham RK, Bakys R, Fleet KR, Brownlie RK, Flint HJ, Brockerhoff EG (2012) Effects of season and region on sapstain and wood degrade following simulated storm damage in Pinus radiata plantations. Forest Ecol Manag 277: 81–89. https://doi.org/10.1016/j.foreco.2012.04.018.
Miller DJ (1980) Blue stain growth requirements and some related control procedures. Forest Research Laboratory, Oregon State University, Corvallis, Oregon.
Millers M, Magaznieks J, Gžibovska Z (2017) Blue stain development of Scots pine (Pinus sylvestris L.) roundwood and its influencing factors. In: Treija S, Skujeniece S (eds) Research for rural development. Latvia University of Agriculture, Jelgava, Latvia, pp 120–126. https://www2.llu.lv/research_conf/proceedings2017_vol_1/docs/LatviaResRuralDev_23rd_2017_vol1.pdf. Accessed 18 May 2023.
Missouri Botanical Garden (2023) https://tropicos.org. Accessed 05 May 2023.
Netherer S, Ehn M, Blackwell E, Kirisits T (2016) Defence reactions of mature Norway spruce (Picea abies) before and after inoculation of the blue-stain fungus Endoconidiophora polonica in a drought stress experiment. Forestry J 62: 169–177.
Öhrn P, Berlin M, Elfstrand M, Krokene P, Jönsson AM (2021) Seasonal variation in Norway spruce response to inoculation with bark beetle-associated bluestain fungi one year after a severe drought. Forest Ecol Manag 496, article id 119443. https://doi.org/10.1016/j.foreco.2021.119443.
R Core Team (2022) R: a language and environment for statistical computing. R Foundation for Statistical Computing, Vienna, Austria. https://www.R-project.org/.
Rauch P, Kogler C, Kanzian C, Holzfeind T, Kirisits T, Baier P (2022) Holzqualität und Resilienz in der Holzbereitstellung. [Wood quality and resilience in wood supply]. GreenLane Endbericht. [GreenLane Final Report]. Bundesministerium für Land- und Forstwirtschaft, Umwelt und Wasserwirtschaft. ForestValue ERA-NET Cofund Call, Vienna, Austria.
Rice AV, Thormann MN, Langor DW (2008) Mountain pine beetle-associated blue-stain fungi are differentially adapted to boreal temperatures. Forest Pathol 38: 113–123. https://doi.org/10.1111/j.1439-0329.2007.00525.x.
Robert V, Stegehuis G, Staplers J (2005) The MycoBank engine and related databases. https://www.MycoBank.org/. Accessed 05 May 2023.
Schauberger P, Walker A (2021) openxlsx: read, write and edit xlsx files R package version 4.2.5. https://CRAN.R-project.org/package=openxlsx.
Schubert M, Mourad S, Schwarze FWMR (2011) Automated image processing for quantification of blue-stain discolouration of Norway spruce wood. Wood Sci Technol 45: 331–337. https://doi.org/10.1007/s00226-010-0328-4.
Seidl R, Schelhaas M-J, Lexer M J (2011) Unraveling the drivers of intensifying forest disturbance regimes in Europe. Global Change Biol 17: 2842–2852. https://doi.org/10.1111/j.1365-2486.2011.02452.x.
Seifert K (1993) Sapstain of commercial lumber by species of ophiostoma and ceratocystis. In: Wingfield MJ, Seifert K, Webber JF (eds) Ophiostoma and ceratocystis: taxonomy, ecology, and pathogenicity. Amer Phytopathological Society, pp 141–151.
Solheim H (1986) Species of Ophiostomataceae isolated from Picea abies infested by the bark beetle Ips typographic. Nord J B 6: 199–207. https://doi.org/10.1111/j.1756-1051.1986.tb00874.x.
Solheim H (1991) Oxygen deficiency and spruce resin inhibition of growth of blue stain fungi associated with Ips typographus. Mycol Res 95: 1387–1392. https://doi.org/10.1016/S0953-7562(09)80390-0.
Solheim H (1993) Ecological aspects of fungi associated with the spruce bark beetle Ips typographus in Norway. In: Wingfield MJ, Seifert K, Webber JF (eds) Ophiostoma and ceratocystis: taxonomy, ecology, and pathogenicity. Amer Phytopathological Society, pp 235–242.
Syed Ahmad SS, Mohd Mushar SH, Zamah Shari NH, Kasmin F (2020) A comparative study of log volume estimation by using statistical method. EJSMT 7: 22–28. https://doi.org/10.37134/ejsmt.vol7.1.3.2020.
Szewczyk G, Jankowiak R, Mitka B, Bożek P, Bilański P, Kulak D, Barycza A, Kunys G (2020) Development of blue stain in mechanically harvested Scots pine (Pinus sylvestris) logs during storage. Can J For Res 50: 42–50. https://doi.org/10.1139/cjfr-2019-0112.
Uzunovic A, O’Callahan D, Kreber B (2004) Mechanical tree havesters spread fungal inoculum onto freshly felled Canadian and New Zealand pine logs. Forest Prod J 54: 34–40.
Uzunovic A, Webber JF, Peace AJ, Dickinson DJ (1999) The role of mechanized harvesting in the development of bluestain in pine. Can J For Res 29: 242–251. https://doi.org/10.1139/x98-195.
Wickham H (2016) ggplot2: elegant graphics for data analysis. Springer Cham. https://doi.org/10.1007/978-3-319-24277-4.
Yang D-Q, Beauregard R (2001) Sapstain development on jack pine logs in Eastern Canada. Wood Fiber Sci 33: 412–424.
Total of 48 references.
Send to email
