Samuel Egbäck  ,
Bo Karlsson,
Karl-Anders Högberg,
Kenneth Nyström,
Mateusz Liziniewicz,
Urban Nilsson
,
Bo Karlsson,
Karl-Anders Högberg,
Kenneth Nyström,
Mateusz Liziniewicz,
Urban Nilsson
Effects of phenotypic selection on height-diameter ratio of Norway spruce and Scots pine in Sweden
Egbäck S., Karlsson B., Högberg K.-A., Nyström K., Liziniewicz M., Nilsson U. (2018). Effects of phenotypic selection on height-diameter ratio of Norway spruce and Scots pine in Sweden. Silva Fennica vol. 52 no. 2 article id 7738. https://doi.org/10.14214/sf.7738
Highlights
- Swedish plus-tree selection promoted less slender Norway spruce trees and more slender Scots pine trees compared to neighboring trees
- Similar results were also found for progeny trials which indicated that genetics played a prominent role in phenotypic appearance.
Abstract
Genetically improved Norway spruce (Picea abies (L.) Karst.) and Scots pine (Pinus sylvestris L.) are extensively used in operational Swedish forestry plantations. However, relatively little is known about the stem slenderness (height-diameter ratio) of genetically improved material. Thus, in this study we investigated effects of plus-tree selection on stem slenderness of Norway spruce and Scots pine in Sweden by evaluating both the plus-tree selection and a large number of progeny trials. Species-specific models for predicting the height-diameter ratio were estimated using regression and mixed model approach. Our results show that phenotypic plus-tree selection promoted less slender Norway spruce trees and more slender Scots pine trees compared to neighboring trees. Similar results were also found for the progeny trials which indicated that genetics played a prominent role in the phenotypic appearance. Compared to the progeny of neighboring trees, Norway spruce plus-tree progenies had a 5.3% lower height-diameter ratio, while Scots pine plus-tree progenies had a 1.5% greater height-diameter ratio. The narrow sense heritability for height-diameter ratio was 0.19 for Norway spruce and 0.11 for Scots pine, indicating that it is possible to modify the height-diameter ratio by breeding. Correlation coefficients between breeding values for height-diameter ratio and diameter were negative for Scots pine (–0.71) and Norway spruce (–0.85), indicating that selection for diameter only would result in less slender stems of both species. Similar correlations were also found between breeding values for height-diameter ratio and height of Scots pine (–0.34) and Norway spruce (–0.74).
Keywords
Pinus sylvestris;
Picea abies;
genetic correlations;
heritability;
Genetic selection;
slenderness
-
Egbäck,
Swedish University of Agricultural Sciences, Southern Swedish Forest Research Centre, P.O. Box 49, 230 53 Alnarp, Sweden
E-mail
samuel.egback@slu.se
- Karlsson, Skogforsk, Ekebo, 268 90 Svalöv, Sweden E-mail bo.karlsson@skogforsk.se
- Högberg, Skogforsk, Ekebo, 268 90 Svalöv, Sweden E-mail karl-anders.hogberg@skogforsk.se
- Nyström, Swedish University of Agricultural Sciences, Department of Forest Resource Management, Skogsmarksgränd, 901 83 Umeå, Sweden E-mail kenneth.nystrom@slu.se
- Liziniewicz, Skogforsk, Ekebo, 268 90 Svalöv, Sweden E-mail Mateusz.Liziniewicz@skogforsk.se
- Nilsson, Swedish University of Agricultural Sciences, Southern Swedish Forest Research Centre, P.O. Box 49, 230 53 Alnarp, Sweden E-mail urban.nilsson@slu.se
Received 30 May 2017 Accepted 16 February 2018 Published 26 February 2018
Views 107070
Available at https://doi.org/10.14214/sf.7738 | Download PDF

1 Introduction
A common and effective method to begin a breeding program is to select outstanding phenotypes, so called plus-trees, in natural forests and plantations (Zobel and Talbert 1984). This enables early genetic gains and provides robust foundations for future breeding efforts. In Sweden, plus-trees of Norway spruce (Picea abies (L.) Karst.) and Scots pine (Pinus sylvestris L.) were first selected, from mature and often naturally regenerated stands, in the 1940s (Karlsson and Rosvall 1993; Wilhelmsson and Andersson 1993). To increase the size of the breeding population, a second round of plus-tree selection was carried out during 1970s–1980s. In this round, trees were selected from even-aged planted or sown homogenous stands with high survival rates and good stem and branch quality and aged between 20–50 years old (equivalent to about 1/3–1/2 of the total rotation time). In both the first and second round of plus-tree selection, tree height was an important selection trait (Werner et al. 1981), because height has been found to be less influenced by stand density than diameter (Hamilton and Christie 1974; Braastad 1979; Haveraaen 1981; Persson and Persson 1992), and it was hypothesized that this would equate to more effective selection with respect to future volume growth. Other important selection traits were diameter, vitality and stem quality (Werner et al. 1981). Nowadays, detailed genetic analysis of material in progeny trials allows further selections for breeding programs based on composite traits representing combinations of desirable tree traits. The relative contributions of traits such as tree height and diameter to the breeding objective can be specified by weights determined by their genetic properties and economic value (Magnussen 1990; Berlin 2009; Berlin et al. 2010).
From a growth modeling perspective, it is important to analyze effects of genetic selection to determine whether adjustments of current growth models are needed (Kurinobu and Shingai 1987; Adams et al. 2006; Gould et al. 2008; Haapanen et al. 2016). The estimated genetic gain compared to unimproved plant material with respect to maximum mean annual volume growth (MAImax) is currently in the range of 10–20% for both Norway spruce and Scots pine (Rosvall et al. 2001). In coming years this genetic gain in volume growth is expected to increase to 25% as new seed orchards start to produce seeds (Rosvall et al. 2001). Besides incorporating increased growth rates in yield forecasts, it is also important for the models to account for genetic differences in stem slenderness (height-diameter ratio). Failure to do so may lead to biased volume predictions (Egbäck et al. 2015) and suboptimal forest management practices. In Swedish conditions, genetic differences in stem slenderness might justify adjustments of (for example) the diameter-height models presented by Fahlvik and Nyström (2006). Furthermore, stem slenderness is often used to determine tree stability and susceptibility to windthrow and snow damage (Cremer et al. 1983; Lohmander and Helles 1987; Harrington and DeBell 1996). In a study on five tree species in Canada, Wang et al. (1998) found that stem slenderness was negatively correlated with tree diameter at breast height (dbh), height, crown length and age, but positively correlated with stand density, species composition, and site index. Different tree species may also react differently to competitive stress with respect to stem slenderness. Notably, Nilsson (1993) found that the height-diameter ratio is more strongly influenced by competition in Scots pine than in Norway spruce, i.e. Scots pine is more plastic with respect to competition than Norway spruce.
Environmental factors and silvicultural treatments largely determine stem slenderness (Kroon et al. 2008), although genetic factors may also play an important role (Harrington and De Bell 1996). In a study of Scots pine, Andersson et al. (2007) found that plus-tree progenies were more slender than progenies of unimproved trees. However, they examined material in experimental single-tree plots, which can give biased estimates of growth traits that are affected by competition (Vergara et al. 2004). To adjust for possible bias due to differences in competitive environments, Andersson et al. (2007) therefore calculated and applied correction factors based on neighboring trees. Ideally, block plot trials should be used when analyzing genetic differences in stem slenderness (Andersson et al. 2007; Gould et al. 2011). This is because placing each genetic entry in a separate large plot prevents initially fast growing genetic entries dominating and suppressing neighboring genetic entries. In such a trial differences in stem slenderness have been found between improved and unimproved loblolly pine (Pinus taeda L.) material (Buford and Burkhart 1987). However, this was merely an effect of differences in the intercept of the height-diameter curves, indicating that if an appropriate site index was chosen there was no need to change the height-diameter ratio when modeling improved material. The improved material was more slender than the unimproved material because it grew more rapidly, and thus was exposed to more intense competition in the plots, rather than because of genetic differences in stem slenderness. It is important to note that the trees were analyzed at the same age and not at the same height. Similar results have been found in block-plot trials of jack pine (Pinus banksiana Lamb.) (Weng et al. 2008) and loblolly pine (Sabatia and Burkhart 2013; Egbäck et al. 2015). Nevertheless, the extent to which stem slenderness changes with the level of genetic improvement in Norway spruce and Scots pine is still unclear and needs further investigation.
The objective of this study was to investigate how phenotypic plus-tree selection has affected the stem slenderness of Norway spruce and Scots pine in Sweden. More specifically, we examined whether stem slenderness is heritable, and whether there are differences in the slenderness of progenies of selected plus trees and progenies of neighboring unselected trees.
2 Materials and methods
2.1 Effect of plus-tree selection on slenderness
Data used in the first analysis (data set 1) originated from records of plus-trees selected during the 1970s–1980s in even-aged commercial stands over the whole of Sweden (Karlsson and Rosvall 1993; Wilhelmsson and Andersson 1993). In total, about 5200 Norway spruce and 4700 Scots pine plus-trees were selected in southern, central and northern Sweden and several traits were measured. In addition, approximately 5% of them were sampled for more thorough measurements, and both the height and diameter at breast height (dbh) of their 14 closest neighbors were measured, excluding those within 3 m, which were assumed to be affected by competition from the plus-trees (Lindenbaum et al. 1985). In total, 308 groups of 15 Norway spruce trees and 238 groups of 15 Scots pine trees, each consisting of a plus-tree and 14 neighbors, were examined in detail. Neighboring trees were considered to be genetically unimproved since the stands were established before seed orchard seeds were available. The plus-trees were generally larger than the neighboring trees in terms of both height and dbh (Table 1). To evaluate whether there were differences in stem slenderness between the phenotypically selected plus-trees and corresponding neighboring trees, regression analysis was used. A tree category indicator variable was constructed to divide plus-trees and neighboring trees into separate classes. The prediction variable used was individual tree stem slenderness modeled as a function of variables describing local conditions, tree size and the tree category indicator variable. To obtain more homogenous variance, the dependent variable height-diameter ratio was transformed using the natural logarithm. Site mean slenderness (SMS), defined as the average height-diameter ratio of each group of 15 trees described above, was used to account for differences in local conditions. In addition, two indicator variables for southern and middle Sweden were used for differences in local conditions. In total, four tree height parameters were used (h, h–1, ln(h), Relh), described below. The following general linear model was used based on individual tree data:
![]()
, where ln(h/dbh) is the natural logarithm of stem slenderness (m/cm), μ is the intercept, SMS is the site mean slenderness, SMS2 is site mean slenderness raised to the power of two, h is tree height (m), h–1 is the inverted tree height, ln(h) is the natural logarithm of tree height, Relh is the relative height (defined as the ratio between height of the focal tree and height of the tallest of the corresponding group of 15 trees), C is the indicator variable for tree category (C = 1 if the tree category is plus-tree, otherwise C = 0), S is the indicator variable for southern Sweden (S = 1 if the trees were located in southern Sweden, otherwise S = 0), M is the indicator variable for middle Sweden (M = 1 if the trees were located in middle Sweden, otherwise M = 0) where northern Sweden was set as reference level of geographical location and e is the random error term. The variables C, S and M were treated as a fixed effect while the other variables were covariates. The PROC GLM procedure in SAS software ver. 9.3 (SAS Institute, Inc. 2010) was used for the parameter estimations.
| Table 1. Mean values of studied traits for plus-trees and neighboring Norway spruce or Scots pine trees (data set 1). | |||||
| Variable | Scots pine, 3560* | Norway spruce, 4615* | |||
| Plus-trees, 238* | Neighboring trees, 3322* | Plus-trees, 308* | Neighboring trees, 4307* | ||
| height (m) | 11.7 (3.3) | 9.1 (3.1) | 12.8 (3.5) | 9.6 (3.6) | |
| diameter at breast height (cm) | 16.0 (3.5) | 12.3 (3.8) | 16.7 (4.6) | 11.3 (4.4) | |
| height-diameter ratio | 0.73 (0.12) | 0.75 (0.20) | 0.77 (0.10) | 0.86 (0.16) | |
| * Number of trees. Standard deviations are given in parenthesis. | |||||
2.2 Phenotypic or genetic differences?
In order to evaluate the importance of genetic factors for the phenotypic slenderness of the plus-trees, cones from plus-trees and neighboring trees were collected during the round of plus-tree selection described in section 2.1. For Norway spruce, the plus-trees and neighboring trees were selected from three stands in southern Sweden, while the corresponding selection for Scots pine was made in 23 stands in northern Sweden. For both species, neighboring trees were randomly selected cone-bearing trees in the proximity of the selected plus-trees. For Norway spruce, the total number of plus-trees with neighboring trees (PTWNT) and neighboring trees (NT) were 24 and 66, respectively. Corresponding numbers for Scots pine were 178 and 179, respectively. This material was assumed to provide good representations of the material included in the first analysis (as described in section 2.1). The height-diameter ratios of the 24 PTWNT and 66 NT of Norway spruce were 0.77 and 0.81, respectively, indicating that this material had similar height-diameter ratios to the material described in section 2.1 (see Table 1). For Scots pine, no such analysis was possible as the diameter and height of the cone bearing trees were not measured.
The progeny from PTWNT and NT along with progeny from other plus-trees were used in 12 Norway spruce progeny trials and 24 Scots pine progeny trials (data set 2, see Table 2). The Norway spruce trials were located in southern Sweden on rather productive sites, while the Scots pine trials were located in northern Sweden on relatively poor sites. All 36 trials were single-tree plot trials and were established between 1986 and 1994. In total, the trials included more than 140 000 trees representing more than 1700 families. Within the trials, 6–64 families were progenies of PTWNT and 12–64 families were progenies of NT. The material in the trials was analyzed at the age of 15–22 years when the mean height was 3.2–8.3 m and mean dbh was 3.0–11.9 cm. In order to reduce confounding effects of competition in the analysis, inter-tree competition was calculated in line with the study by Kroon et al. (2008):

, where ICm is the sum of neighboring tree diameter (D) raised to the power of two divided by the Euclidian distance between subject tree m and neighbor m´. Trees included in the indices were the first-order neighboring trees immediately adjacent to the sides and corners of subject tree m. Thus, the maximum number for v was eight. Initially, we tested using also the second- and third-order neighboring trees. However, this did not improve the model according to Akaike information criterion.
| Table 2. List of trials for data set 2. | |||||||||||
| Trial no. | Tree species | Spacing (m) | Total no. of families | No. of families from PTWNT* | No. of families from NT** | No. of replicates | Established (year) | Age at measurement (years) | Mean dbh (cm) | Mean height (m) | Mean h/dbh (m/cm) |
| 1021 | Spruce | 1.4×1.4 | 81 | 8 | 24 | 24 | 1986 | 15 | 5.1 | 4.7 | 0.96 |
| 1022 | Spruce | 1.4×1.4 | 81 | 8 | 24 | 24 | 1986 | 15 | 6.1 | 5.4 | 0.97 |
| 1023 | Spruce | 1.4×1.4 | 81 | 8 | 24 | 24 | 1986 | 15 | 3.3 | 3.4 | 1.26 |
| 1024 | Spruce | 1.4×1.4 | 81 | 8 | 24 | 24 | 1986 | 15 | 5.6 | 5.6 | 1.03 |
| 1025 | Spruce | 1.4×1.4 | 81 | 7 | 18 | 24 | 1986 | 15 | 4.2 | 3.9 | 0.98 |
| 1026 | Spruce | 1.4×1.4 | 81 | 7 | 18 | 24 | 1986 | 15 | 5.2 | 4.7 | 1.02 |
| 1027 | Spruce | 1.4×1.4 | 81 | 7 | 18 | 24 | 1986 | 15 | 3.0 | 3.2 | 1.33 |
| 1028 | Spruce | 1.4×1.4 | 81 | 7 | 18 | 24 | 1986 | 15 | 5.7 | 5.6 | 1.03 |
| 1029 | Spruce | 1.4×1.4 | 81 | 9 | 24 | 24 | 1986 | 15 | 4.4 | 4.1 | 0.95 |
| 1030 | Spruce | 1.4×1.4 | 81 | 9 | 24 | 24 | 1986 | 15 | 5.4 | 4.6 | 0.95 |
| 1031 | Spruce | 1.4×1.4 | 81 | 9 | 24 | 24 | 1986 | 15 | 3.7 | 3.4 | 1.00 |
| 1032 | Spruce | 1.4×1.4 | 81 | 9 | 24 | 24 | 1986 | 15 | 6.3 | 5.8 | 0.95 |
| 448 | Pine | 2.2×1.5 | 160 | 6 | 12 | 16 | 1987 | 21 | 7.6 | 5.5 | 0.76 |
| 449 | Pine | 2.4×2.2 | 195 | 13 | 16 | 19 | 1987 | 21 | 4.3 | 3.3 | 0.84 |
| 450 | Pine | 2.2×2.2 | 257 | 18 | 19 | 20 | 1987 | 22 | 11.3 | 7.7 | 0.70 |
| 451 | Pine | 2.2×1.5 | 222 | 15 | 18 | 19 | 1987 | 22 | 7.0 | 4.6 | 0.70 |
| 452 | Pine | 2.2×2.2 | 185 | 11 | 16 | 18 | 1987 | 22 | 4.2 | 3.3 | 0.96 |
| 466 | Pine | 2.2×1.5 | 318 | 31 | 31 | 13 | 1988 | 21 | 9.7 | 7.3 | 0.77 |
| 467 | Pine | 2.2×1.5 | 318 | 31 | 31 | 13 | 1988 | 21 | 10.1 | 7.7 | 0.79 |
| 469 | Pine | 2.2×1.5 | 318 | 31 | 31 | 13 | 1988 | 21 | 10.0 | 7.5 | 0.77 |
| 470 | Pine | 2.2×1.5 | 318 | 31 | 31 | 13 | 1988 | 21 | 11.9 | 8.3 | 0.74 |
| 495 | Pine | 2.0×1.5 | 331 | 34 | 34 | 14 | 1990 | 22 | 7.1 | 4.4 | 0.65 |
| 496 | Pine | 2.2×2.2 | 331 | 35 | 34 | 14 | 1990 | 21 | 5.3 | 4.0 | 0.80 |
| 497 | Pine | 2.2×1.5 | 331 | 35 | 35 | 14 | 1990 | 22 | 8.5 | 6.5 | 0.80 |
| 498 | Pine | 2.2×1.5 | 331 | 34 | 34 | 14 | 1990 | 21 | 6.8 | 4.6 | 0.73 |
| 499 | Pine | 2.2×1.5 | 331 | 34 | 34 | 14 | 1990 | 21 | 5.6 | 4.5 | 0.87 |
| 506 | Pine | 2.0×1.0 | 378 | 64 | 64 | 17 | 1991 | 20 | 7.7 | 6.3 | 0.91 |
| 507 | Pine | 2.2×1.5 | 378 | 64 | 64 | 17 | 1991 | 20 | 6.9 | 5.6 | 0.86 |
| 508 | Pine | 2.2×1.5 | 378 | 64 | 64 | 18 | 1991 | 20 | 6.8 | 4.0 | 0.63 |
| 509 | Pine | 2.2×1.5 | 378 | 64 | 64 | 20 | 1991 | 20 | 9.1 | 7.2 | 0.82 |
| 510 | Pine | 2.2×1.5 | 378 | 64 | 64 | 22 | 1991 | 20 | 8.4 | 4.9 | 0.61 |
| 560 | Pine | 2.2×1.5 | 457 | 30 | 30 | 10 | 1993 | 20 | 5.8 | 3.7 | 0.68 |
| 561 | Pine | 2.3×1.5 | 457 | 30 | 30 | 13 | 1993 | 20 | 6.7 | 4.2 | 0.67 |
| 565 | Pine | 2.2×1.5 | 386 | 26 | 27 | 14 | 1994 | 20 | 4.6 | 3.5 | 0.82 |
| 566 | Pine | 2.2×1.5 | 386 | 26 | 27 | 14 | 1994 | 20 | 5.6 | 3.6 | 0.70 |
| 567 | Pine | 2.2×1.5 | 386 | 28 | 29 | 16 | 1994 | 20 | 5.4 | 3.4 | 0.69 |
| * PTWNT = Plus-trees with neighboring trees. ** NT = Neighboring trees. | |||||||||||
Variance components were estimated for each tree species separately using the whole data set, covering more than 200 Norway spruce families and more than 1500 Scots pine families. The following mixed linear model was used:
![]()
, where Yijklm is an observation of each trait (height, dbh, height-diameter ratio) of the ijklmth tree, μ is the overall mean, Ti is the fixed effect of trial, Bj(i) is the fixed effect of block nested within trial, Ck is the fixed effect of the indicator variable tree category (plus-tree family – neighbor family), Fl is the random effect of family, ICm is the fixed effect of the covariate inter tree competition and eijklm is the residual. The indicator variable tree category was included to avoid the risk of exaggerated variance. ASReml software (Gilmour et al. 2009) was used to estimate variance components.
Estimated family ![]() and residual
and residual ![]() variances were translated into additive genetic variances
variances were translated into additive genetic variances ![]() and phenotypic variances
and phenotypic variances ![]() as (Falconer and Mackay 1996):
as (Falconer and Mackay 1996):
![]()
![]()
Based on these genetic variances, narrow sense heritability was estimated as:

Standard errors of the genetic parameters were estimated with the ASReml software using a Taylor series approximation (Gilmour et al. 2009).
Breeding values for height, diameter and height-diameter ratios were predicted by Eq. 3. Pearson correlation coefficients among breeding values (hereafter correlations, for convenience) were calculated, using PROC CORR in SAS software version 9.3 (SAS Institute Inc. 2010) to evaluate relations of traits. The average breeding values for the PTWNT were compared with the average breeding values for the NT.
3 Results
3.1 Effect of plus-tree selection on slenderness
Adjusted R2 values for the Norway spruce and Scots pine slenderness models were 0.44 and 0.54, respectively (Table 3). All of the parameters were significant at p < 0.0001, except for tree category indicator variable (C), which was significant at p < 0.05 and height (h) which was significant at p < 0.001 for Scots pine and site mean slenderness raised to the power of two (SMS2) which was significant at p < 0.01 for Norway spruce. For Scots pine the indicator variable S was included and significant at p < 0.01. For Norway spruce the indicator variable M was included and significant at p < 0.05. The most important variables were site mean slenderness (SMS) and site mean slenderness raised to the power of two (SMS2), which explained much of the variation among sites and slenderness of trees at given sites. Initially, the site of the groups of 15 trees was also used as an explanatory class variable, but as SMS explained more variation it was removed. To reduce a curvilinear trend for the residuals, site mean slenderness raised to the power of two (SMS2) was included for both species. All four tree height parameters (h, h–1, ln(h) and relh) were useful for explaining the variation between Norway spruce trees of different sizes, while for Scots pine, h–1 and ln(h) were not significant and thus were excluded. The four tree height parameters (h, h–1, ln(h) and relh) were correlated, but all helped in explaining the variation. Initially, tree height raised to the powers of two (h2) and three (h3) were tested as explanatory variables. However, these were found to have low explanatory value.
| Table 3. Slenderness models for Scots pine and Norway spruce. | |||||
| Variable | Scots pine | Norway spruce | |||
| Parameter estimates | Standard error | Parameter estimates | Standard error | ||
| Intercept | –1.9430 | 0.0855 | –2.7841 | 0.1558 | |
| SMS | 3.5859 | 0.2153 | 1.9061 | 0.2723 | |
| SMS2 | –1.5444 | 0.1382 | –0.4578 | 0.1562 | |
| h | 0.0037 | 0.0013 | –0.0513 | 0.0043 | |
| h–1 | - | - | 2.2541 | 0.1671 | |
| ln(h) | - | - | 0.8105 | 0.0592 | |
| Relh | –0.2682 | 0.0290 | –0.3186 | 0.0226 | |
| C | 0.0265 | 0.0116 | –0.0313 | 0.0090 | |
| M | - | - | 0.0206 | 0.0080 | |
| S | 0.0232 | 0.0078 | - | - | |
| RMSE | 0.15 | 0.13 | |||
| Adjusted R2 | 0.54 | 0.44 | |||
| SMS = Site mean slenderness. h = Tree height (m). C = Tree category, C = 1 if plus-tree, otherwise C = 0. M = 1 if the trees were located in the midst of Sweden, otherwise M = 0. S = 1 if the trees were located in the south of Sweden, otherwise S = 0. | |||||
The tree category indicator variable (C) significantly improved (p < 0.05) the models for both species. In conjunction with the regression functions, Scots pine plus-trees had 0.0265 added to the logarithm of their height-diameter ratio compared to neighboring trees. For an average Scots pine plus-tree this would equate to an increase in slenderness of 2.7%. In contrast, Norway spruce plus-trees had 0.0313 removed from the logarithm of their height-diameter ratio compared with neighboring trees, which would equate to a 3.2% reduction in slenderness for an average Norway spruce plus-tree. The developed model behaved adequately, and no severe bias was detected from the model residuals over tree height and region of Sweden (Figs. 1–4).
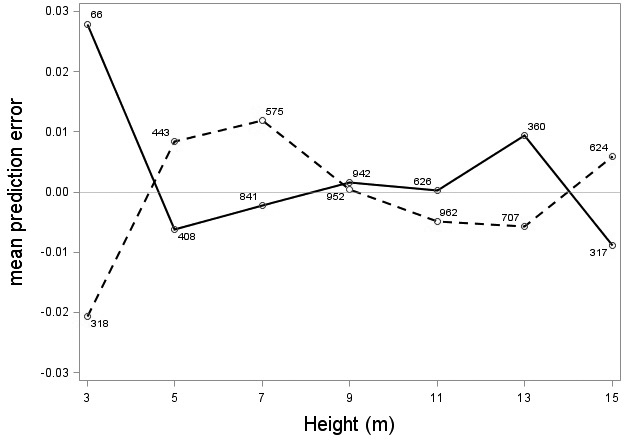
Fig. 1. Mean prediction error of logarithmic height-diameter ratio over height for Scots pine (solid line) and Norway spruce (dashed line). The numbers in the graph represent the number of trees in each class.
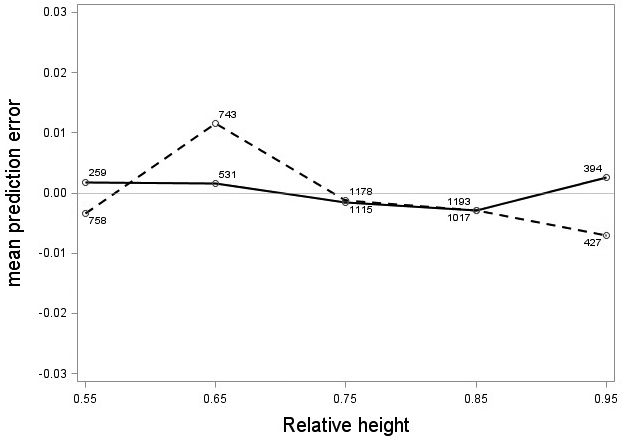
Fig. 2. Mean prediction error of logarithmic height-diameter ratio over relative height for Scots pine (solid line) and Norway spruce (dashed line). The numbers in the graph represent the number of trees in each class.
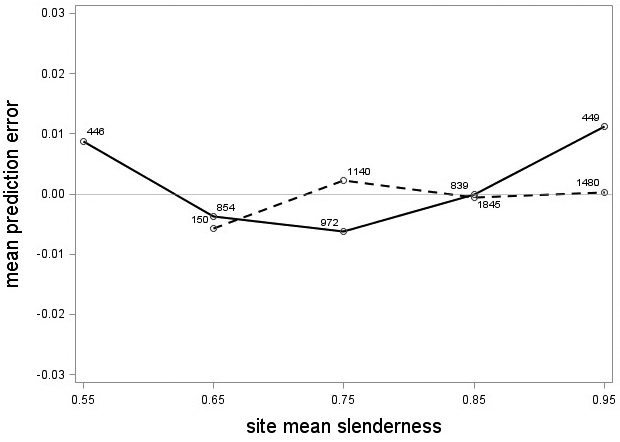
Fig. 3. Mean prediction error of logarithmic height-diameter ratio over site mean slenderness for Scots pine (solid line) and Norway spruce (dashed line). The numbers in the graph represent the number of trees in each class.
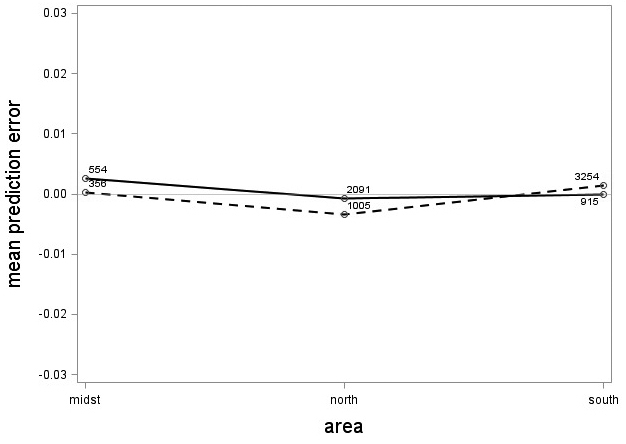
Fig. 4. Mean prediction error of logarithmic height-diameter ratio over region in Sweden for Scots pine (solid line) and Norway spruce (dashed line). The numbers in the graph represent the number of trees in each class.
3.2 Phenotypic or genetic differences?
All of the variables in model 3 were significant for both species and all traits at p < 0.0001, except tree category which was significant for height-diameter ratio of Scots pine at p < 0.01 and inter tree competition which was not significant for diameter of Norway spruce (p = 0.1102). The general picture for tree category indicated that there was difference between plus-trees and neighboring trees, and that its inclusion reduced risks of overestimating heritabilities (Table 4). The precision of the heritability estimates, as indicated by standard errors, was higher for Scots pine than for Norway spruce. The average standard error for height, dbh and height-diameter ratio was 0.01 for Scots pine and 0.03 for Norway spruce. The difference can be explained by the lower number of Norway spruce families. For both species, the narrow sense heritability of height-diameter ratio was low to moderate (0.11–0.19) and slightly lower than that of diameter (0.24–0.37) and height (0.31–0.35). The general picture for both tree species was that the inclusion of inter tree competition improved the model.
| Table 4. Narrow sense heritabilities and associated standard errors for indicated traits of Scots pine and Norway spruce. | ||||
| Scots pine | Norway spruce | |||
| Heritability | Standard error | Heritability | Standard error | |
| height | 0.35 | 0.02 | 0.31 | 0.03 |
| diameter | 0.24 | 0.01 | 0.37 | 0.04 |
| height-diameter ratio | 0.11 | 0.01 | 0.19 | 0.02 |
The correlation between breeding values for height-diameter ratio and diameter was negative for both species, indicating that selecting for diameter would generate less slender trees (Fig. 5). For Scots pine and Norway spruce, the correlation between breeding value for height-diameter ratio and diameter was –0.71 (p < 0.0001) and –0.85 (p < 0.0001), respectively. Similarly, the correlation between breeding values for height-diameter ratio and height was negative for both species, indicating that selecting for height would generate less slender trees (Fig. 5). For Scots pine and Norway spruce, the correlation between breeding value for height-diameter ratio and height was –0.34 (p < 0.0001) and –0.74 (p < 0.0001), respectively. The correlation estimates showed that diameter more strongly affected the height-diameter ratio than height. The correlation between breeding value for diameter and height was 0.84 (p < 0.0001) for Scots pine and 0.96 (p < 0.0001) for Norway spruce.
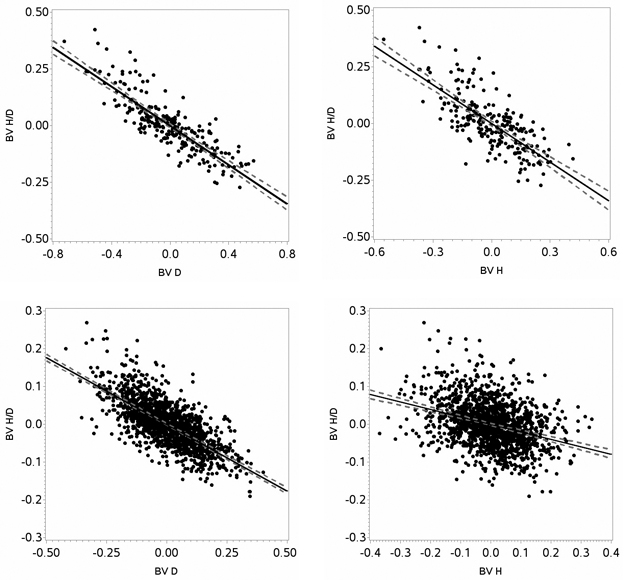
Fig. 5. Estimated breeding values (BV) for height (H), diameter (D) and height-diameter ratio (H/D) for Norway spruce (upper panels) and Scots pine (lower panels) including regression lines (black lines) with confidence intervals (grey dotted lines).
The average breeding value for height-diameter ratio of the PTWNT was 0.003 for Scots pine and 0.002 for Norway spruce. Corresponding values for the NT of Scots pine and Norway spruce were –0.012 and 0.054, respectively. This means that the Scots pine plus-trees were genetically 1.5% more slender, while the Norway spruce plus-trees were genetically 5.3% less slender, than their neighbors.
4 Discussion and conclusion
The first part of this study examined which tree phenotypes were selected in commercial stands during the plus-tree selection, with respect to stem slenderness. By using site mean slenderness in the regression, the model accounted for differences in local conditions (weather, wind, snow etc.), past silvicultural activities regulating stand density and possible provenance differences. Generally, tall trees with large relative heights (relh) were less slender than small trees with small relative heights, in accordance with findings presented by Wang et al. (1998). From these results we would expect plus-trees to be less slender than their neighboring trees, as dominance in the stands was the main selection criterion. This expectation was met for Norway spruce, but Scots pine plus-trees were significantly more slender than their neighboring trees, indicating that other traits apart from the size of the trees were important in the plus-tree selection. From the report by Werner et al. (1981), we know that vitality and timber quality were also considered during plus-tree selection. Thus, slender trees may have been favored more in the Scots pine selection than in the Norway spruce selection because stem quality was weighted more strongly. For example, trees with large branch diameter may have been avoided more in the Scots pine selection, resulting in more slender pine trees, because branching degrees and slenderness are negatively and positively correlated with competition, respectively (Pfister et al. 2007; Lasserre et al. 2009).
To evaluate the genetic impact of the phenotypic plus-tree selection, data for extensive material distributed over large environmental gradients (in 36 trials scattered across all Sweden) were used, making the results suitable for generalization. The results indicated that there was a 5.3% genetic difference in slenderness between the plus-trees (PTWNT) and neighboring randomly selected trees (NT) of Norway spruce. Thus, the observed phenotypic difference in slenderness between plus-trees and neighboring trees was partly caused by genetic factors. In fact, when environmental factors were taken into account using the progeny trials, the differences in height-diameter ratio were enlarged suggesting that the environment masked some of the genetic differences in the phenotypic selection. In contrast, progeny of Scots pine PTWNT were more slender than progeny of NT. Our results suggest that the plus-tree selection of Scots pine resulted in a 1.5% genetic increase in the height-diameter ratio, corresponding fairly well to findings by Andersson et al. (2007) that improved Scots pine had a 5.5% greater height-diameter ratio than unimproved material. In the cited study correction factors based on neighboring trees were used to adjust for bias due to differences in competitive environments. In this study however, competition effects were taken into account by using competition indices. Another difference between the two studies is that Andersson et al. (2007) used just three to six control seed lots from other stands than the plus-trees stands to reflect unimproved material, while we used progenies from 12–64 neighboring trees in the same stands. By comparing PTWNT and NT selected from the same stands we reduced possible provenance effects, thereby strengthening the results. The genetic differences in slenderness between PTWNT and NT of Scots pine indicate that the phenotypic differences were partly due to genetic differences.
The results indicate that plus-tree selection can unintendedly change the height-diameter ratio genetically, despite the strong environmental influences on this trait. In addition, the low to moderate heritability indicates that height-diameter ratios could be modified by selection and breeding, given that the variation is large enough. In this study, the estimated heritabilities for height-diameter ratio were 0.11 for Scots pine and 0.19 for Norway spruce, which corresponds fairly well to the estimated heritability of 0.22 reported by Kroon et al. (2008) for Scots pine in northern Sweden. Our findings in this study suggest that selecting for height or diameter will both results in less slender Scots pine and Norway spruce trees. The correlation between breeding value for height-diameter ratio and height was –0.34 for Scots pine and –0.74 for Norway spruce. Similar figures for height-diameter ratio and diameter was –0.71 for Scots pine and –0.85 for Norway spruce. These results confirm our earlier findings from the phenotypic plus tree selection, that tall trees with large relative heights were less slender than small trees with small relative heights. The findings also correspond well to the findings presented by Wang et al. (1998), where stem slenderness was negatively correlated with tree diameter at breast height and height. Thus, large trees seems to allocate relatively more resources on diameter growth compared to smaller trees which leads a lower height diameter ratio. However, our findings do not correspond well to the study by Kroon et al. (2008), where the genetic correlation between diameter-height ratio and height was estimated to –0.62 for Scots pine. In the study by Kroon et al. (2008) the mean height of competitors, environmental inter tree competition index and genetic inter tree competition index were used which could have over compensated for competitive effects. Given the significant negative correlation detected between breeding values of height-diameter ratios and height and diameter for Scots pine and Norway spruce, the breeding programs for these species need to select for other traits in order to avoid reductions in the height-diameter ratio in improved material. However, maintaining the same height-diameter ratio as unimproved material may not necessarily be optimal, as there may be sound silvicultural and commercial reasons for adjusting it (Cremer et al. 1983; Lohmander and Helles 1987; Harrington and DeBell 1996).
An important element of this study was to account for environmental effects when evaluating differences in stem slenderness. This was done using two sharply contrasting approaches. In the first analysis trees from numerous commercial stands were studied, taking differences in stem slenderness due to variations in tree size and local conditions into consideration. In the second analysis the data originated from numerous well-designed progeny trials, enabling the model to account for site and block within site. To further reduce confounding effects of environmental factors and site variability, especially competition effects, on the results an inter-tree competition index was used, which significantly improved the estimates.
To conclude, the results of this study show that plus-tree selection in Sweden promoted less slender Norway spruce trees and more slender Scots pine trees compared to neighboring trees. Similar results were found from the analysis of genetic effects based on the progeny, indicating that observed phenotypic differences in slenderness between plus-trees and neighboring trees were partly caused by genetic factors. The relatively high heritability estimates for height-diameter ratio indicate that it is possible to modify stem slenderness by breeding. Selecting for diameter or height would result in less slender Norway spruce trees and Scots pine trees since the correlation between breeding values for diameter and height and height-diameter ratio was negative for both species.
Acknowledgements
This study was financially supported by the Swedish Forest Tree Breeding Association, TC4F and the research program Future Forests. We thank Ola Rosvall for constructive suggestions for the manuscript.
References
Adams J.P., Matney T.G., Land S.B., Belli K.L., Duzan H.W. (2006). Incorporating genetic parameters into a loblolly pine growth-and-yield model. Canadian Journal of Forest Research 36(8): 1959–1967. https://doi.org/10.1139/X06-087.
Andersson B., Elfving B., Persson T., Ericsson T., Kroon J. (2007). Characteristics and development of improved Pinus sylvestris in northern Sweden. Canadian Journal of Forest Research 3781): 84–92. https://doi.org/10.1139/x06-224.
Berlin M. (2009). Development of economic forest tree breeding objectives. Dissertation. Swedish University of Agricultural Sciences, Uppsala.
Berlin M., Lönnstedt L., Jansson G., Danell Ö., Ericsson T. (2010). Developing a Scots pine breeding objective: a case study involving a Swedish sawmill. Silva Fennica 44(4): 643–656. https://doi.org/10.14214/sf.132.
Braastad H. (1979). Growth and stability in a spacing experiment with Picea abies. Meddelelser fra det Norske Skogsforsoksvesen 34: 169–215. [In Norwegian with English summary].
Buford M.A., Burkhart H.E. (1987). Genetic-improvement effects on growth and yield of loblolly-pine plantations. Forest Science 33: 707–724.
Cremer K.W., Carter P.R., Minko G. (1983). Snow damage in Australian pine plantations. Australian Forestry 46(1): 53–66. https://doi.org/10.1080/00049158.1983.10674378.
Egbäck S., Bullock B.P., Isik F., McKeand S. (2015). Height-diameter relationships for different genetic planting stock of loblolly pine at age 6. Forest Science 61(3): 424–428. https://doi.org/10.5849/forsci.14-015.
Fahlvik N., Nyström K. (2006). Models for predicting individual tree height increment and tree diameter in young stands in southern Sweden. Scandinavian Journal of Forest Research 21(S7): 16–28. https://doi.org/10.1080/14004080500487292.
Falconer D.S., Mackay T.F.C. (1996). Introduction to quantitative genetics. Longman group Ltd., Harlow, England.
Gilmour A.R., Gogel B.J., Cullis B.R., Thompson R. (2009). ASReml user guide. 3rd ed. VSN International Ltd, Hemel Hempstead, UK.
Gould P.J., Johnson R., Marshall D., Johnson G. (2008). Estimation of genetic-gain multipliers for modelling Douglas-fir height and diameter growth. Forest Science 54: 588–596.
Gould P.J., St Clair J.B., Anderson P.D. (2011). Performance of full-sib families of Douglas-fir in pure-family and mixed-family deployments. Forest Ecology and Management 262(8): 1417–1425. https://doi.org/10.1016/j.foreco.2011.06.042.
Haapanen M., Hynynen J., Ruotsalainen S., Siipilehto J., Kilpeläinen M.-L. (2016). Realized and projected gains in growth, quality and simulated yield of genetically improved Scots pine in southern Finland. European Journal of Forest Research 135(6): 997–1009. https://doi.org/10.1007/s10342-016-0989-0.
Hamilton G.J., Christie J. (1974). Influence of spacing on crop characteristics and yield. United Kingdom Forestry Commission, Bulletin 52.
Harrington C.A., DeBell D.S. (1996). Above- and below-ground characteristics associated with wind toppling in a young Populus plantation. Trees 11(2): 109–118. https://doi.org/10.1007/PL00009655.
Haveraaen O. (1981). Growth-development in a 20 years old planting spacing experiment with spruce, Picea abies (L.) Karst. Meldinger fra Norges Lantbrukshogskole 60: 1–12.
Karlsson B., Rosvall O. (1993). Breeding programmes in Sweden: 2. Norway spruce. In: Lee S.J. (ed.). Progeny testing and breeding strategies. Proceedings of the Nordic group of tree breeding. Edinburgh, 6–10 October 1993. Forestry Commission. p. 128–134.
Kroon J., Andersson B., Mullin T. (2008). Genetic variation in the diameter-height relationship in Scots pine (Pinus sylvestris). Canadian Journal of Forest Research 38(6): 1493–1503. https://doi.org/10.1139/X07-233.
Kurinobu S., Shingai Y. (1987). Stand-volume prediction of improved trees based on the realized gain in progeny tests of Hinoki (Chamaecyparis obtusa Endl.). Silvae Genetica 36: 159–164.
Lasserre J.-P., Mason E.G., Watt M.S., Moore J.R. (2009). Influence of initial planting spacing and genotype on microfibril angle, wood density, fibre properties and modulus of elasticity in Pinus radiata D. Don corewood. Forest Ecology and Management 258(9): 1924–1931. https://doi.org/10.1016/j.foreco.2009.07.028.
Lindenbaum U., Strömberg S., Rosvall O. (1985). Resultat och erfarenheter från plusträdsurval av tall och gran i Norrland under 1980–1984. In: Årsbok 1985. Föreningen skogsträdsförädling, Institutet för skogsförbättring, Uppsala, Sweden. p. 110–154. [In Swedish].
Lohmander P., Helles F. (1987). Windthrow probability as a function of stand characteristics and shelter. Scandinavian Journal of Forest Research 2(1–4): 227–238. https://doi.org/10.1080/02827588709382460.
Magnussen S. (1990). Selection index: economic weights for maximum simultaneous genetic gain. Theoretical and Applied Genetics 79(3): 289–293. https://doi.org/10.1007/BF01186069.
Nilsson U. (1993). Competition in young stands of Norway spruce and Scots pine. Dissertation. Swedish University of Agricultural Sciences, Alnarp.
Persson A., Persson B. (1992). Survival, growth and quality of Norway spruce (Picea abies (L.) Karst.) provenances at the three Swedish sites of the IUFRO 1964/68 provenance experiment. Department of Forest Yield Research, Report 29. 67 p.
Pfister O., Wallentin C., Nilsson U., Ekö P.M. (2007). Effects of wide spacing and thinning strategies on wood quality in Norway spruce (Picea abies) stands in southern Sweden. Scandinavian Journal of Forest Research 22(4): 333–343. https://doi.org/10.1080/02827580701504951.
Rosvall O., Jansson G., Andersson B., Ericsson T., Karlsson B., Sonesson J., Stener L.G. (2001). Genetiska vinster i nuvarande och framtida fröplantager och klonblandningar. Redogörelse nr 1, SkogForsk. [In Swedish].
Sabatia C.O., Burkhart H.E. (2013). Height and diameter relationships and distributions in loblolly pine stands of enhanced genetic material. Forest Science 59(3): 278–289. https://doi.org/10.5849/forsci.11-093.
SAS/STAT software version 9.3. SAS Institute Inc. Copyright 2002–2010. Cary, N., USA.
Vergara R., White T.L., Huber D.A., Shiver B.D., Rockwood D.L. (2004). Estimated realized gains for first-generation slash pine (Pinus elliottii var. elliottii) tree improvement in the southeastern United States. Canadian Journal of Forest Research 34(12): 2587–2600. https://doi.org/10.1139/x04-136.
Wang Y., Titus S.J., LeMay V.M. (1998). Relationships between tree slenderness coefficients and tree or stand characteristics for major species in boreal mixedwood forests. Canadian Journal of Forest Research 28(8): 1171–1183. https://doi.org/10.1139/x98-092.
Weng Y.H., Kershaw J., Tosh K., Adams G., Fullarton M.S. (2008). Height–diameter relationships for jack pine seedlots of different genetic improvement levels. Silvae Genetica 57(1–6): 276–282. https://doi.org/10.1515/sg-2008-0042.
Werner M., Hadders G., Rosvall O. (1981). Förädlingsprogram för tall, gran och contortatall. In: Årsbok 1980. Föreningen skogsträdsförädling, Institutet för skogsförbättring, Uppsala, Sweden. p. 59–111. [In Swedish].
Wilhelmsson L., Andersson B. (1993). Breeding programmes in Sweden: 3. Breeding of Scots pine (Pinus sylvestris) and lodgepole pine (Pinus contorta ssp. latifolia). In: Lee S.J. (ed.). Progeny testing and breeding strategies. Proceedings of the Nordic group of tree breeding, Edinburgh, 6–10 October 1993. Forestry Commission. p.135–145.
Zobel B., Talbert J. (1984). Applied forest tree improvement. The Blackburn press, New Jersey.
Total of 36 references.
