Xingji Jin,
Timo Pukkala  ,
Fengri Li,
Lihu Dong
,
Fengri Li,
Lihu Dong
Developing growth models for tree plantations using inadequate data – a case for Korean pine in Northeast China
Jin X., Pukkala T., Li F., Dong L. (2019). Developing growth models for tree plantations using inadequate data – a case for Korean pine in Northeast China. Silva Fennica vol. 53 no. 4 article id 10217. https://doi.org/10.14214/sf.10217
Highlights
- The permanent sample plots of Chinese plantation trees have not been designed for producing data for growth modeling
- We used various methods to deal with the inadequacies of sample plot data
- Optimization was used to fit diameter increment and survival models using data with varying measurement intervals and tree identification errors
- Quantile regression was used to model self-thinning limit.
Abstract
Korean pine (Pinus koraiensis Siebold & Zucc.) is economically the most important tree species in northeast China. Korean pine plantations are established and managed for the production of timber and seeds. Despite the importance of the species, few models have been developed for the comparison of alternative management schedules. Model development is affected by the fact that permanent sample plots and thinning experiments have not been designed and managed for modeling purposes. The permanent sample plots include few non-thinned plots, and weak trees are removed in thinning treatments, leading to low mortality rate. Moreover, the measurement interval is irregular. This study used optimization-based modeling approach in tree-level diameter increment and survival modeling to deal with the above problems. Models for self-thinning limit were developed to alleviate the problem of underestimated mortality arising from the features of the data. In addition, improved site index and individual-tree height models were developed. The model of Lundqvist and Korf was used as the site index model and the model proposed by Schumacher as the height model. Quantile regression was used to model the maximum stand basal area and maximum number of trees as a function of mean tree diameter and site index. Tree diameter, stand basal area, basal area in larger trees and site index were used as the predictors of diameter increment and tree survival. The models developed in this study constitute a model set that is suitable for simulation and optimization studies. The models produced simulation results that correspond to measured stand development.
Keywords
Pinus koraiensis;
optimization-based modeling;
quantile regression;
self-thinning
-
Jin,
Key Laboratory of Sustainable Forest Ecosystem Management - Ministry of Education, School of Forestry, Northeast Forestry University, Harbin 150040, Heilongjiang, People’s Republic of China
 http://orcid.org/0000-0003-2971-2709
E-mail
xingji_jin@163.com
http://orcid.org/0000-0003-2971-2709
E-mail
xingji_jin@163.com
-
Pukkala,
Key Laboratory of Sustainable Forest Ecosystem Management - Ministry of Education, School of Forestry, Northeast Forestry University, Harbin 150040, Heilongjiang, People’s Republic of China; University of Eastern Finland, P.O. Box 111, FI-80101 Joensuu, Finland
E-mail
timo.pukkala@uef.fi
-
Li,
Key Laboratory of Sustainable Forest Ecosystem Management - Ministry of Education, School of Forestry, Northeast Forestry University, Harbin 150040, Heilongjiang, People’s Republic of China
http://orcid.org/0000-0002-4058-769X
E-mail
fengrili@126.com
-
Dong,
Key Laboratory of Sustainable Forest Ecosystem Management - Ministry of Education, School of Forestry, Northeast Forestry University, Harbin 150040, Heilongjiang, People’s Republic of China
http://orcid.org/0000-0002-3985-9475
E-mail
ldonglihu2006@163.com
Received 24 June 2019 Accepted 14 November 2019 Published 21 November 2019
Views 78321
Available at https://doi.org/10.14214/sf.10217 | Download PDF

Supplementary Files
1 Introduction
Korean pine (Pinus koraiensis Siebold & Zucc.) is an important tree species in China, Korea, Japan and Russia (Zheng and Fu 2008). It is the most important species in the northeastern provinces of China (Heilongjiang, Jilin, and Liaoning) where it occurs both in natural forests and plantations. The area of Korean pine plantation in the northeastern provinces is 272 400 ha, of which 172 400 ha are in Heilongjiang province (State Forestry Administration 2014).
Korean pine plantations are established for both wood and cone production. Korean pine seeds are edible, having high protein content and positive health effects (Meng et al. 2008). Oil extracted from the seeds is composed of approximately 11.5% of pinolenic acid. It is unsaturated fatty acid, which is used for instance to suppress hunger and help with weight loss (Shen 2003).
Management of Korean pine plantations requires information on the growth rate and survival of trees, and on the cone production of trees during different stages of stand development. Growth models for tree stands may be stand-level models, diameter distribution models, or individual tree models (Avery and Burkhart 1994). Individual-tree models are either distance-dependent or distance-independent. In northeast China, the recent trend has been to develop distance-independent individual-tree models (Jin et al. 2016, 2017; Peng et al. 2018).
Some growth models for Chinese Korean pine plantations have already been developed (Jin et al. 2017) but earlier models suffer from a few weaknesses. For example, the diameter increment model of Jin et al. (2017) does not include site variables as predictors, which limits its use to a narrow range of site class. The site index model of Jin et al. (2017) is based on the guide curve method (Clutter 1963), which may result in biased predictions if the site distribution of the modeling data is different in young and older stands. Moreover, the model is based on average tree height instead of dominant height.
There is a reasonable amount of repeated measurements available on Korean pine plots in the Heilongjiang province. However, the permanent sample plots of Korean pine and other plantation species have not been established for modeling purposes. There are very few unthinned ‘control plots’ and few plots in which the planting density deviates from normal densities. Weak trees are often removed in thinning treatments, i.e., shortly before they would die. Therefore, mortality is very low in the empirical datasets, which may lead to models that underestimate mortality, especially when predictions are made for high stand densities, old stands and large trees. The authors and users of previous models have recognized these problems and restricted their calculations to normal stand densities and rotation ages (Jin et al. 2017; Peng et al. 2018). The previous models cannot be used to analyze the optimal management schedules for carbon sequestration, for example.
The problem of unreliable survivor functions can be alleviated by using self-thinning models to prevent the stand density from becoming unrealistically high in simulations (White 1981). There is much overall knowledge on the relationship between mean tree size and the maximum possible number of trees in even-aged stands (e.g., Yoda et al. 1963; White 1981). Self-thinning limit can be modeled based on temporary sample plot measurements, which are often available and cover larger ranges of variation in stand state, compared to permanent sample plot data.
Another typical feature of the permanent plot data for Korean pine and other plantation species of northeast China is the unequal measurement interval. This complicates modeling because it cannot be assumed that the trees grow or survive with a constant rate for the whole time between two consecutive measurements. The study of Juma et al. (2014) suggests that using the measurement interval as model predictor is a too simplistic way to deal with varying measurement interval. Therefore, periodical measurements cannot be easily converted to unbiased estimates of for instance five-year increment and five-year survival rate (Cao 2000; Nord-Larsen 2006; Pukkala et al. 2011; de-Miguel et al. 2014).
Optimization-based modeling (Juma et al. 2014) and other methods (Cao 2000; Nord-Larsen 2006) have been proposed as solutions to the problem of unequal measurement interval. The idea of the optimization-based method is to optimize the parameters of the growth and survival models when they are used in a software that simulates the stand development in 1-year steps between two measurement occasions. This optimization minimizes a loss function, which measures the deviation of the simulated diameter distribution from the measured distribution at the end of the measurement interval. The optimization-based approach also eliminates problems arising from the misidentification of trees, i.e., when a certain ID number has been given to different trees is successive measurements (de-Miguel et al. 2014).
The aim of this study was to develop an improved set of models for site index, tree height, diameter increment and survival rate of Korean pine plantations so that the above mentioned problems are addressed. These models enhance the possibilities to optimize the management and develop management instructions for Korean pine plantations. The site index and tree height models described in this article are nonlinear fixed- or mixed-effect models. Optimization approach was used to simultaneously fit the diameter increment and survival models. This method (Pukkala et al. 2011) was employed due to the properties of the modeling data, where the interval between successive measurements varied from 1 to 7 years, and the data included many instance where a certain ID number was used for different trees in successive measurements. The optimization-based approach eliminated the adverse effect of these data properties on the outcome of modeling.
2 Methods
2.1 Data
Permanent sample plots measured in the Maoer Mountains and Mengjiagang forest farms in Heilongjiang province were used for modeling. The dataset of Maoer Mountains included one silvicultural experiment while two experiments were available in Mengjiagang.
The dataset of Maoer Mountains consisted of seven plots measured two times, the measurement interval being 4 years except one plot where the interval was 7 years. In the first Mengjiagang dataset (henceforth referred to as Mengjiagang 1) there were 19 plots with 3 measurements per plot, their interval being 2–4 years. The other dataset (Mengjiagang 2) consisted of 21 plots with 5 measurements with an interval ranging from 1 to 6 years. The total number of tree level measurement intervals (two consecutive measurements from the same tree) was 19 576 (Table 1). The size of the sample plot ranged from 0.04 to 0.16 ha and the measurement year ranged from 1998 to 2018.
| Table 1. Descriptive statistics of modeling data. The number of diameter increment measurements was 19 567 (two consecutive diameter measurements from the same tree), and the number of tree height measurements was 16 407. The number of plot level measurement intervals (two consecutive measurements of the same plot) was 129 and the number of plots was 47. | |||||
| Variables | N | Mean | Sdev | Minimum | Maximum |
| Diameter (cm) | 19 576 | 17.7 | 5.4 | 1.1 | 37.3 |
| Height (m) | 16 407 | 12.0 | 2.1 | 2.6 | 23.4 |
| Dominant height (m) | 129 | 11.7 | 2.3 | 7.2 | 19.4 |
| Age (year) | 129 | 37.7 | 9.0 | 17.0 | 50.0 |
| Stand basal area (m2 ha–1) | 129 | 22.9 | 8.3 | 5.4 | 48.5 |
| Number of trees per ha | 129 | 1175 | 910 | 231 | 3920 |
| Site index (m) | 129 | 12.8 | 2.3 | 10.3 | 17.2 |
| Sdev = standard deviation. | |||||
All trees taller than 1.3 m were measured for diameter at breast height and survival, and most trees also for height. To calculate the dominant height of the plot, a plot- and measurement-specific diameter/height curve was fitted, using the function of Näslund (1937). Dominant height was calculated as the mean height of 100 thickest trees in breast height diameter per hectare.
2.2 Dominant height and site index modeling
Altogether 129 pairs of stand age (age since planting) and dominant height were available for dominant height and site index modeling. Dominant height at the latter measurement was predicted from dominant height at the previous measurement and stand age in the two measurements. The following nine algebraic difference models (ADA models) were fitted to the data: McDill-Amateis (1992), two ADA variants of the model of Schumacher (1939), Lundqvist-Korf (Korf 1939), three ADA versions of Chapman-Richards model (Richards 1959), Sloboda (1971) and Hossfeld (Peschel 1938). Alternative models (Supplementary file S1) were evaluated in terms of fitting statistics (square root of the mean of squared errors (RMSE) and Bayesian information criterion (BIC)). The site index curves were plotted for different site indices to evaluate the credibility of the models both within and outside the modeling data. Both fixed- and mixed-effects models with random plot factors were fitted. The formulas for RMSE and BIC were:

![]()
where![]() is measured value,
is measured value, ![]() is model prediction, n is number of observations, k is number of parameters and L is likelihood function.
is model prediction, n is number of observations, k is number of parameters and L is likelihood function.
2.3 Modeling height-diameter relationship
The number of height observations available for individual tree height model was 16 407. Many height measurements were available from each plot. In the case of height modeling, mixed-effects models led to better fitting statistics than fixed-effect models. The best combination of random plot factors was obtained by testing all possible combinations and selecting the one that led to the smallest BIC statistic.
Based on the study of Mehtätalo et al. (2015), the following models were tested: Näslund (1937), Curtis (1967) and Schumacher (1939). These two-parameter models were mostly the best ones among the 28 datasets and 3717 sample plots used in Mehtätalo et al. (2015). The best three-parameter models were either marginally better than or equally good as the best two-parameter models. In our modeling, the two parameters of each candidate model were assumed to depend on the dominant height of the stand. The following Schumacher model, including random plot effects for three parameters had the best fitting statistics:

where hij and dij are the height and diameter at breast height of tree i of plot j, respectively, Hj is the dominant height of plot j, α0, α1, β0 and β1 are fixed parameters, and a0j, a1j and β1j are random plot-specific parameters having trivariate normal distribution. The errors εij are independent, with mean equal to 0and constant variance.
2.4 Diameter increment and survival modeling
The modeling data were characterized by variable measurement intervals, ranging from 1 to 7 years. Another feature was the existence of tree identification errors, especially in the Maoer Mountains and Mengjiagang 1 datasets. These errors were due to the fact that a certain ID number was given to different trees in two successive measurements. This led to either negative or unrealistically high positive growths for some trees, when growth was calculated as the difference in the diameter of the same ID number in two successive measurements (Fig. 1).
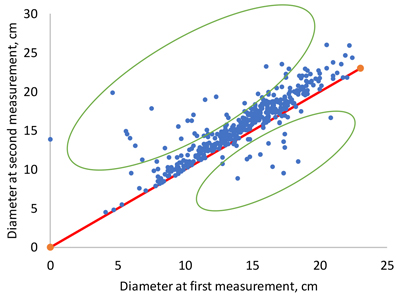
Fig. 1. Examples of unrealistically low or high diameter increments as a consequence of mistakes in tree numbering (dots within green ellipses).
Since linear growth rate or constant survival rate for the whole interval cannot be assumed (Cao 2000; Nord-Larsen 2006), the optimization approach suggested by Pukkala et al. (2011) and later used by de-Miguel et al. (2014) and Juma et al. (2014) was used to fit the diameter increment and survival models. The aim of the method is to find such parameters for the diameter increment and survival models that minimize the difference between the measured and simulated diameter distributions of the plots at the end of the measurement interval when the simulation begins from the diameters of trees at the beginning of the interval. Diameter increment and survival were simulated in 1-year time steps.
As the first step in modeling, predictors and model forms were selected based on previous literature, preliminary regression analyses and preliminary optimizations. In preliminary regression analysis, periodical diameter increments were converted into one-year increment by assuming a linear increase in breast height diameter between two successive measurement occasions. The following model forms were selected:
Diameter increment model:

Survival model:
where id is diameter increment (cm/year), s is annual survival rate, d diameter at breast height (cm), G is stand basal area (m2 ha–1), BAL is basal area in larger trees (m2 ha–1), SI is site index (m) and α0–α5, β0–β4 are regression coefficients.
The two models were fitted simultaneously by using the simulation-optimization-based approach (Pukkala et al. 2011). In this approach, several values of the parameters of diameter increment and survival models are evaluated via simulation. The trees of the first measurement occasion form an initial stand, the development of which is simulated for the length of the measurement interval. Then, the cumulative diameter distributions of stand basal area and number of trees per hectare are compared to those obtained from trees measured in the second occasion. When evaluating a certain set of model parameters, all measurement intervals of all plots were simulated and the minimized objective function was calculated over all plots and intervals.
The minimized loss function was as follows:

where θ is the set of coefficients (α0–α5, β0–β4), K is the number of plots, Jk is the number of measurement intervals of plot k, Ij is the number of 3-cm diameter classes in measurement interval j of plot k, Gjkm(dijk) and Gjks(dijk) are, respectively, measured and simulated cumulative basal area (m2 ha–1) at diameter dijk (upper limit of diameter class i) at the end of measurement interval j of plot k, and Fjkm(dijk) and Fjks(dijk) are, respectively, measured and simulated cumulative number of trees per hectare at diameter dijk at the end of measurement interval j of plot k (see e.g. Pukkala et al. 2011 for details).
The optimization produces simultaneously the coefficients for a 1-year diameter increment model and a 1-year survival model. Three different optimization methods were tested, namely the method of Nelder and Mead (1965), evolution strategy optimization (Storn and Price 1997; Pukkala 2009) and particle swarm optimization (Kennedy and Eberhart 1995). Although earlier research suggests that particle swarm optimization should perform better than the Nelder and Mead method or evolution strategy optimization, we found out that in our modeling problem Nelder and Mead turned out to be the best. It was therefore used to develop the diameter increment and survival models.
Optimization (model fitting) was repeated 100 times. Then, 10 additional optimizations were conducted in such a way that the best solution (best set of model parameters) found so far was included in the initial population of solutions used in a new optimization (Pukkala et al. 2011).
Since ordinary fitting statistics could not be calculated for the diameter increment and survival models, bootstrapping was used to evaluate the significance of the parameters. Bootstrapping consisted of taking random samples with replacement from the modeling data and fitting the model for every dataset. In our analysis, bootstrapping consisted of 30 or 60 samples and optimization processes. Two different numbers of repeated samplings and model fittings were used to see the sensitivity of Bootstrapping results to the number of model fittings. The size of each sample was equal to the number of plot-level measurement intervals (number of pairs of plot measurement). Each of the 30 or 60 optimization processes was conducted exactly in the same way as in model fitting. The results of bootstrap optimizations gave information on the means and standard deviations of parameter estimates.
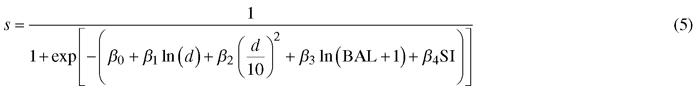
2.5 Modeling self-thinning limit
Due to the low number of dense and unthinned plots and the fact that weak trees are often harvested in thinning treatments, there was very little mortality in the data. Therefore, self-thinning limit was also modeled to alleviate the problem of underestimated mortality when the models are used in simulations. Additional data for self-thinning limit were obtained from Naozhi (37 plots) and Sanpeng (33 plots) forest farms in JiLin province and 40 permanent plots located in Heilongjiang province. The dataset for modeling self-thinning limit consisted of 237 observations, the range of variation being 6.2–37.3 cm for mean diameter, 0.6–56.3 m2 ha–1 for basal area, and 80–3920 for the number of trees per ha.
A self-thinning limit was fitted for both number of trees per hectare and stand basal area. To avoid subjective selection of plots that might be on the self-thinning boundary, quantile regression was used to fit models for the 95% quantile of the relationship between mean tree size and stand density. Based on earlier research (Bi 2001, 2004), the following model forms were used:
![]()
![]()
where lnNτ and lnGτ is the τth quantile of logarithmic number of trees and stand basal area, respectively, D is quadratic mean diameter of trees (cm) and SI is site index (m). In quantile regression, the τth quantile of the conditional probability distribution of a response variable Y with a given vector of predictor variables, can be estimated for any value of τ (0 > τ > 1) (Koenker 2017). The estimator of proposed by Koenker and Basset (1978) minimizes the following loss function:

which gives weight τ for positive residuals and weight 1-τ for negative residuals. The R package quantreg was used to fit the quantile regression models (Koeneker 2018).
3 Results
3.1 Site index model
The fixed-effects version of the Lundqvist and Korf equation (Korf 1939) was selected as the site index model because its behavior was evaluated to be the most logical outside the age and dominant height ranges of modeling data, and its RMSE was the second best after McDill and Amateis (1992) (Suppl. file S1). The model is as follows:
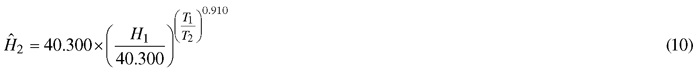
where T1 and T2 is stand age in the first and second measurement, respectively, and H1 and H2 are dominant heights in the two measurement occasions. The RMSE was 1.104 m. According to the model (Fig. 2), dominant height differences between site indices increase for 35 first years of stand development, after which they no longer increase. The shape of the dominant height curve was somewhat different from that of the previous model (Jin et al. 2017). Mixed-effects modeling did not result in more plausible models or better fitting statistics than the fixed-effects version of the selected model, most probably because the number of observations from the same plot was small (1–4).
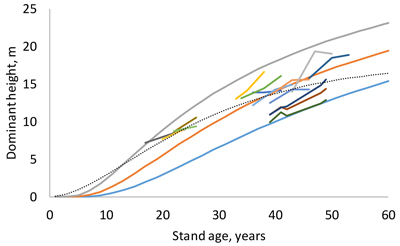
Fig. 2. Site index curves for site indices 10, 14 and 18 m and examples of measured sequences of age and dominant height (short lines). The dotted thin line is the guide curve of Jin et al. (2017).
3.2 Height model
The height model of Schumacher (1939) turned out to have better fit than the models of Näslund (1937) and Curtis (1967). The model included three random plot effects (Eq. 1, Table 2). The RMSE of the full model was 1.136 m and that of the fixed part was 1.307 m. When the model was fitted as a fixed-effect model, its RMSE was 1.241 m. As can be seen from Fig. 3, the diameter-height curve climbs up when the stand develops. Compared to the model of Jin et al. (2017), our new model predicts more within-stand variation in tree height. The residuals were normally distribution with a constant variance at different diameters (Fig. 4).
| Table 2. Parameter estimates of the mixed-effects height model (Eq. 3). | |||
| Fixed parameter | Estimate | t value | |
| α0 | 9.645 | 11.556 | |
| α1 | 0.475 | 7.103 | |
| β0 | 9.110 | 10.995 | |
| β1 | –0.199 | –2.678 | |
| Random parameter | Sdev | Correlations | |
| α0j | 3.460 | α0j | α1j |
| α1j | 0.264 | –0.885 | |
| β1j | 0.173 | 0.008 | 0.382 |
| Sdev = standard deviation. | |||
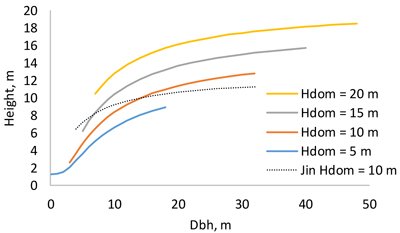
Fig. 3. Dependence of tree height on breast height diameter at different dominant heights. The thin dotted line is the model of Jin et al. (2017) for dominant height 10 m.
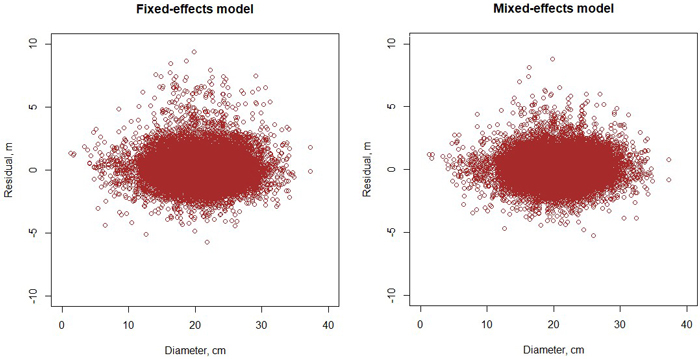
Fig. 4. Residuals of the fixed-effects (left) and mixed-effects (right) height model.
3.3 Diameter increment and survival models
The diameter increment model obtained from the optimization was as follows:

When a Korean pine plantation develops, the model predicts that diameter increment is fastest when the trees are 7–10 cm thick in breast height diameter (Fig. 5 A). However, in a certain stand, large trees grow faster than the more suppressed small trees (Fig. 5 B). The “shape” of the diameter increment model is very similar to that of the earlier model (Jin et al. 2016) in the sense that breast height diameter, stand basal area and BAL affect diameter increment in the same way in both models. However, our new model seems to predict better growth rates for certain diameter, stand basal area and BAL, although exact comparison is difficult because the model of Jin et al. (2017) does not have site index as a predictor.
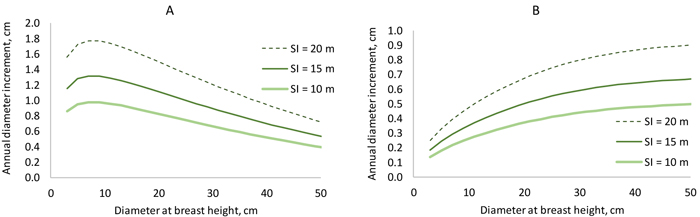
Fig. 5. Diameter increment model. On the left, stand basal area increases from 6 to 30 m2 ha–1 when diameter increases from 3 to 5 cm (BAL = 0.3×G). On the right, basal area is constant (25 m2 ha–1), and BAL decreases from 25 to 6 m2 ha–1 when diameter increases from 3 to 50 cm. View larger in new window/tab
The survival model was as follows:
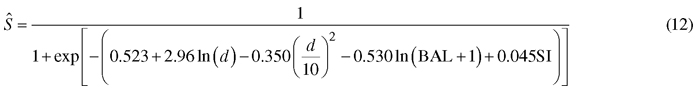
The model predicts very high annual survival rates (about 0.999) for the typical growing densities and tree diameters of Korean pine plantations. This is logical since the modeling data included few dead trees due to the practice of removing weak trees in thinning treatments. However, the signs of all predictors are logical. According to the model, small trees of a dense stand have the highest probability of mortality. Opposite to the model of Jin et al. (2017), the new model predicts increasing mortality also towards large tree diameters.
3.4 Self-thinning model
The self-thinning models were as follows:
![]()
![]()
The models predict that a better site can sustain higher stand densities (Fig. 6). It may be concluded that the 95% quantile is a good estimator of the self-thinning limit since there are very few plots beyond the self-thinning limit predicted for good sites (SI 20 m). The shapes of the self-thinning lines are logical and the slope coefficient of the model for maximum number of trees per ha (–1.4169) is close to the theoretically derived value of –1.5 (Yoda et al. 1963).
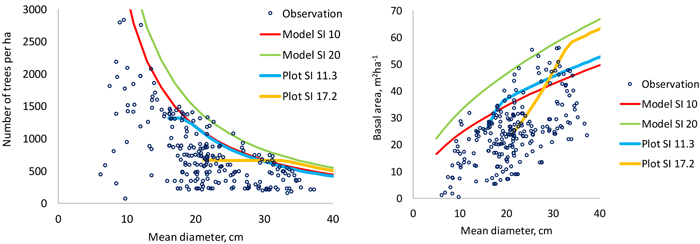
Fig. 6. Data points used to model the 95% quantile of number of trees per hectare (left) and stand basal area (right). The thin continuous lines are model predictions for two site indices and the thicker lines are simulations made for two plots using the models developed in this study. The plot shown with blue line (SI 11.3) is the only non-thinned permanent plot in the modeling data of this study. View larger in new window/tab
3.5 Validity of the models
Bootstrapping, which consisted of 30 or 60 model fittings with different samples from the modeling data, indicated that different fittings produced fairly similar parameter estimates (Table 3). The mean of the 30 or 60 parameter estimates divided by their standard deviation was higher than 2 for all parameters except the intercept of the survival model. The conclusions about the significance of the parameters were the same with both numbers of repeated optimizations, suggesting that 60 model fittings are enough to draw conclusions about the significance of the parameters.
| Table 3. Bootstrapping results for diameter increment and survival modeling. The results are based on 60 optimization-based model fittings but the ratio between mean value of the coefficient and its standard deviation is also shown for 30 model fittings (30 MF). The dataset in each fitting was a random sample of the data. Random sampling with replacement was used. | ||||||||||
| Variable | Diameter increment model | Survival model | ||||||||
| Min | Max | Mean | Mean/Sdev | Min | Max | Mean | Mean/Sdev | |||
| 60 MF | 30 MF | 60 MF | 30 MF | |||||||
| Constant | 0.498 | 1.099 | 0.627 | 5.452 | 4.915 | –0.645 | 1.689 | 0.525 | 1.036 | 0.859 |
| ln(d) | 0.446 | 0.531 | 0.498 | 29.092 | 26.872 | 2.010 | 3.608 | 2.935 | 9.685 | 8.874 |
| (d/10)2 | –0.020 | –0.011 | –0.015 | –6.101 | –6.210 | –0.498 | –0.137 | –0.365 | –4.525 | –4.435 |
| ln(G) | –0.938 | –0.876 | –0.909 | –77.286 | –75.768 | - | - | - | - | - |
| ln(BAL+1) | –0.249 | –0.228 | –0.235 | –43.483 | –38.963 | –0.920 | –0.200 | –0.594 | –3.268 | –3.285 |
| SI | 0.040 | 0.062 | 0.057 | 12.907 | 11.857 | 0.011 | 0.118 | 0.062 | 2.565 | 2.765 |
| d is diameter at the breast (cm); G is stand basal area (m2 ha–1); BAL is basal area in large trees (m2 ha–1); SI is site index (m); Sdev is standard deviation. | ||||||||||
When the growth and survival of trees were simulated from the start to the end of the measurement interval, the ending cumulative diameter distribution was very close to the measured one. Logically, deviations were greatest for the longest measurement intervals (Fig. 7).
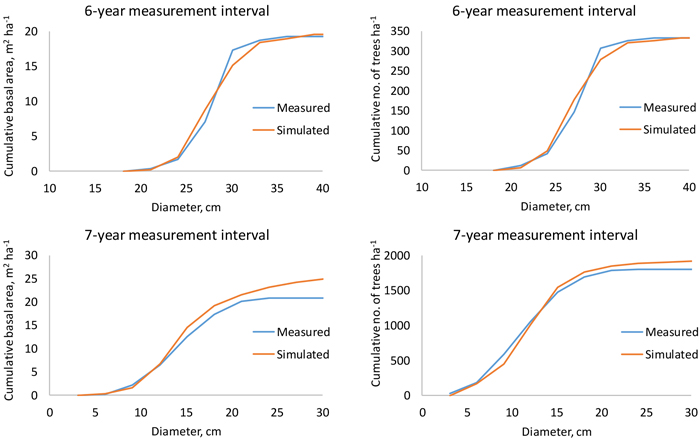
Fig. 7. Measured and simulated cumulative stand basal area (left) and number of trees per hectare (right) in a 48-year-old (top) and 24-year-old (bottom) plantation when the measurement interval is 6 or 7 years.
As expected, simulated basal area growth varied less than the measured (Fig. 8). The average mean annual basal area increment was 10% lower, as compared to the measured growth. The few plots with very high measured basal area increments did not draw the simulated growth up, due to the fact that the optimization-based approach minimized a different objective function than regression analysis.
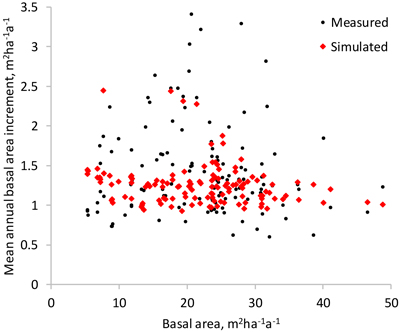
Fig. 8. Measured and simulated mean annual basal area increment of the study plots (the difference of the basal area in the beginning and at the end of the measurement interval divided by the length of the interval).
All models developed in this study were used in a simulation where the starting point was the first measurement of the only non-thinned sample plot. When the calculated self-thinning limit (either for number of trees or basal area) was exceed, the predictions of the individual-tree survival model were adjusted so that the stand density was exactly at the self-thinning limit. The adjustment was done as follows: If the number of trees or stand basal area was, after simulating diameter increment (Eq. 11) and survival (Eq. 12) for one year, higher than the self-thinning limit, two correction factors were calculated as Nmax/N and Gmax/G (Nmax and Gmax represent self-thinning limits and N and G are simulated values) and the smaller one of the two correction factors was selected. Then, the survival rates of trees were calculated again with Eq. 12, and each of them was multiplied with the correction factor. This led to the outcome where most trees died from those diameter classes where the tree-level survival probability was lowest. Since the individual-tree survival model was used also below the self-thinning limit, some mortality was simulated before the self-thinning limit was reached.
The simulations (Fig. 9) do not indicate any marked deviations from the measured stand development, which shows some irregularities due for instance to measurement errors. The simulations for two plots shown in Fig. 6 also suggest logical behavior of the models.
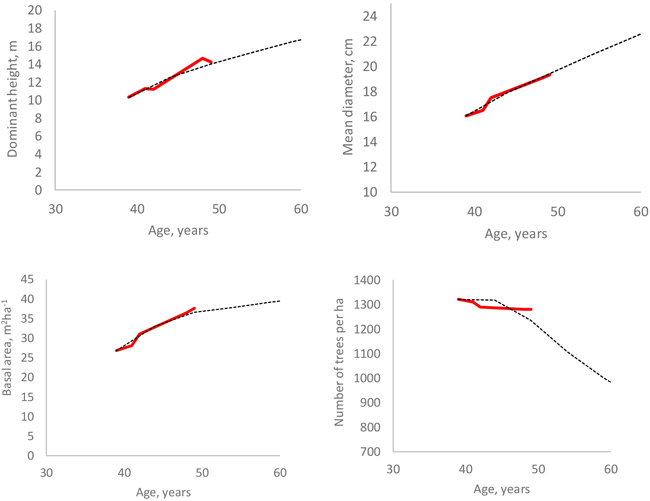
Fig. 9. Measured (red line) and simulated (black dotted line) development of four stand attributes in a non-thinned plot.
4 Discussion
The article used optimization for diameter increment and survival modeling to deal with varying measurement intervals and tree identification errors. Model biases and simulation errors caused by the lack of trees growing under intense competition was dealt with by fitting a model for self-thinning limit, using quantile regression analysis. In simulations, the self-thinning model was used simultaneously with the individual-tree survival model. Bootstrapping, simulations and subjective assessments were used to evaluate the adequacy of the models, in addition to statistical criteria. For example, the dominant height model of McDill and Amateis (1992) had the best fitting statistics, but it sometimes predicted unrealistically high dominant height increments outside modeling data (for young stands on very good sites and for old stands on very poor sites). Therefore, when the modeling data is scanty and do not cover the whole ranges of variation in site, stand and tree characteristics, it is necessary to assess the models subjectively with the help of simulations and visualizations.
The new growth models developed for Korean pine differ from the previous models (Jin et al. 2017) in a few respects. First, the ADA approach was used in site index modeling instead of the guide curve modeling (Clutter 1963) of Jin et al. (2017). ADA is less prone to bias caused by unequal site fertility distributions in different age classes of the modeling data. Second, site index was used as a predictor in diameter increment and survival models, which is a significant improvement since the application range of the new models is wider than that of the previous models. Third, self-thinning limit was modeled as a function of mean diameter and site index, which prevents the model set from predicting unrealistically high growing stock volumes for non-thinned stands.
With a certain diameter, stand basal area and competition (BAL), the new models appear to give higher diameter increments for sites corresponding to the same site productivity class as the guide curve model of Jin et al. (2017). A partial reason for this discrepancy might be the different origins of the modeling data in these two studies. The current dataset was four times larger than that of Jin et al. (2017). Although there were some obvious errors in tree numbering, tree diameters were measured carefully, using a 1.3-m stick to measure breast height. In one of the three experiments, the measurement height was marked on the tree stem with paint. Therefore, we are confident that the growth level predicted by our new models corresponds to the growth rate of the current Korean pine plantations.
The survival model indicated very high survival rate, which is explained by the fact that weak trees are removed in thinning treatments, and very few trees are left to die. From the modeling point of view, it would be better to leave more plots unthinned, to improve the validity of the model in management that goes beyond normal management practices. In the new model, mortality started to increase again at very large tree diameters (see Eq. 12). This is also an improvement compared to Jin et al. (2017) who had to devise an additional senescence model to have mortality among very old and large trees. Despite the fact that mortality rate increased toward large diameters, the models still underestimate mortality if stand development is simulated for long time periods without thinning treatments. The self-thinning models effectively prevent this kind of outcome. However, it is likely that mortality starts to increase already before the self-thinning limit, due to decreased vigor of trees under intense competition. This phenomenon could be modeled with the function of Vanclay and Sands (2009). However, our data did not allow us to fit this model. Decreased vigor also decreases diameter increment, which may lead to biased diameter increment predictions at high stand densities if weak trees are systematically removed from plots that are used as modeling data.
We developed models for both maximum basal area and maximum number of trees per hectare. Both models can be used simultaneously in simulation so that self-thinning is simulated if either of the two self-thinning limits is exceeded. The individual-tree survival model can be used to allocate the mortality to different diameter classes.
The fitting statistics calculated for the individual-tree height model (Eq. 3) may be too optimistic since trees that were used as observations in height modeling were also used to calculate the dominant height of the stand, which was a predictor in the height model. However, another height model, where site and stand age were used as predictors instead of dominant height, resulted in lower RMSE than obtained for Eq. 3 (see Suppl. file S2), which suggests that the bias in fitting statistics is not large.
Seeds are equally important products of Korean pine plantations as timber. Although preliminary models for seed production have been suggested (e.g., Jin et al. 2017; Nguyen et al. 2017), there is room for improvement since the previous models are either unsuitable for simulation (Nguyen et al. 2017) or are based on small datasets and partly on expert knowledge (Jin et al. 2017). Better models for seed production would enhance possibilities to optimize the management of Korean pine plantations in multifunctional forestry. In addition to timber and seed yields, carbon sequestration is also an important function of Chinese forests (Zhang et al. 2018). Calculation of the carbon stock requires models for the biomass of different parts of the trees, including roots. Such models have already been developed (Dong et al. 2016). In addition, there are measurements of the carbon content of different part of Korean pine trees (Yang et al. 2017).
The new models developed in this study could be combined with existing biomass and taper models (Dong et al. 2016; Jin et al. 2017), timber assortment specifications and economic data to optimize the management of Korean pine plantations in timber productions. The models for stem taper and biomass may be regarded more reliable than the previous model for dominant height, diameter increment, survival and tree height. Therefore, reliable simulations and optimizations can be conducted using the models developed in this study together with the taper and biomass models developed earlier.
Acknowledgments
This research was financially supported by the National Natural Science Foundation of China (31600511), the National Key Point Research and Development Program of China (2017YFD0600601-01-03), the Fundamental Research Funds for the Central Universities of the People’s Republic of China (2572017CA04) and the Heilongjiang Touyan Innovation Team Program (Technology Development Team for High-efficient Silviculture of Forest Resources). We thank the graduate students of Northeast Forestry University of China (Harbin) and the staff of Mengjiagang forest farm (Heilongjiang province) for collecting field data for this study.
References
Avery T.E., Burkhart H.E. (1994). Forest measurements, 4th ed. McGraw-Hill, Inc, New York.
Bi H. (2001). The self-thinning surface. Forest Science 47: 361–370.
Bi H. (2004). Stochastic frontier analysis of a classic self-thinning experiment. Austral Ecology 29(4): 408–417. https://doi.org/10.1111/j.1442-9993.2004.01379.x.
Cao Q.V. (2000). Prediction of annual diameter growth and survival for individual trees from periodic measurements. Forest Science 46: 127–131.
Clutter J.L. (1963). Compatible growth and yield models for loblolly pine. Forestry Chronicle 9: 354–371.
Curtis R.O. (1967). Height-diameter and height-diameter age equations for second-growth Douglas fir. Forest Science 13(4): 365–375.
de-Miguel S., Pukkala T., Morales M. (2014). Using optimization to solve tree misidentification and uneven measurement interval problems in individual-tree modeling of Balsa stand dynamics. Ecological Engineering 69: 232–236. https://doi.org/10.1016/j.ecoleng.2014.04.008.
Dong L., Zhang L., Li F. (2016). Developing two additive biomass equations for three coniferous plantation species in northeast China. Forests 7(7): 136. https://doi.org/10.3390/f7070136.
Jin X., Pukkala T., Li F., Dong L. (2017). Optimal management of Korean pine plantations in multifunctional forestry. Journal of Forestry Research 28(5): 1027–1037. https://doi.org/10.1007/s11676-017-0397-4.
Juma R., Pukkala T., de-Miguel S., Muchiri M. (2014). Evaluation of different approaches to individual tree growth and survival modeling using data collected at irregular intervals – a case for Pinus patula in Kenya. Forest Ecosystems 1:14. 13 p. https://doi.org/10.1186/PREACCEPT-9097767721272407.
Kennedy J., Eberhart R. (1995). Particle swarm optimization. Proceedings of IEEE International Conference on Neural Networks IV. p. 1942–1948. https://doi.org/10.1109/ICNN.1995.488968.
Koenker R. (2017). Quantile regression: 40 years on. Annual Review of Economics 9: 155–176. https://doi.org/10.1146/annurev-economics-063016-103651.
Koenker R. (2018). quantreg: quantile regression. R package version 5.38. https://CRAN.R-project.org/package=quantreg.
Koenker R., Basset G. (1978). Regression quantiles. Econometrica 46(1): 33–50. https://doi.org/10.2307/1913643.
Korf V. (1939). A mathematical definition of stand volume growth law. Lesnicka Prace 18: 337–339.
McDill M.E., Amateis R.L. (1992). Measuring forest site quality using the parameters of a dimensionally compatible height growth function. Forest Science 38(2): 409–429.
Mehtätalo L., de-Miguel S., Gregoire T.G. (2015). Modeling height-diameter curves for prediction. Canadian Journal of Forest Research 45(7): 826–837. https://doi.org/10.1139/cjfr-2015-0054.
Meng T., Wang M., Liang L., He Y. (2008). Dynamic analysis on ecological landscape pattern of Changbai Mountain. Global Geology 27(3): 338–344. [In Chinese].
Näslund M. (1937). Skogsförsöksanstaltens gallringsförsök i tallskog. [Forest research intitute’s thinning experiments in Scots pine forests]. Meddelanden från Statens Skogsförsöksanstalt Häfte 29.
Nelder J.A., Mead R. (1965). A simplex method for function minimization. The Computer Journal 7(4): 308–313. https://doi.org/10.1093/comjnl/7.4.308.
Nguyen T.T., Tai D.T., Zhang P., Shen H.-L. (2017). Effect of thinning intensity on tree growth and temporal variation of seed and cone production in a Pinus koraiensis plantation. Journal of Forestry Research 30(3): 835–845. https://doi.org/10.1007/s11676-018-0690-x.
Nord-Larsen T. (2006). Modeling individual-tree growth from data with highly irregular measurement intervals. Forest Science 52(2): 198–208.
Peng W., Pukkala T., Jin X., Li F. (2018). Optimal management of larch (Larix olgensis A. Henry) plantations in Northeast China when timber production and carbon stock are considered. Annals of Forest Science 75:63. 15 p. https://doi.org/10.1007/s13595-018-0739-1.
Peschel W. (1938). Die mathematischen Methoden zur Herleitung der Wachstumsgesetze von Baum und Bestand und die Ergebnisse ihrer Anwendung [Mathematical methods for deriving growth laws for trees and stands with application experiences]. Tharandter Forstliches Jahrburch 89: 169–247.
Pukkala T. (2009). Population-based methods in the optimization of stand management. Silva Fennica 43(2): 261–274. https://doi.org/10.14214/sf.211.
Pukkala T., Lähde E., Laiho O. (2011). Using optimization for fitting individual-tree growth models for uneven-aged stands. European Journal of Forest Research 130(5): 829–839. https://doi.org/10.1007/s10342-010-0475-z.
Richards F.J. (1959). A flexible growth function for empirical use. Journal of Experimental Botany 10(2): 290–300. https://doi.org/10.1093/jxb/10.2.290.
Schumacher F.X. (1939). A new growth curve and its application to timber yield studies. Journal of Forestry 37: 819−820.
Shen H.L. (2003). Korean pine as a nut production species in China present situation and future development. Acta Horticulture 620: 187–191. https://doi.org/10.17660/ActaHortic.2003.620.20.
Sloboda B. (1971). Zur Darstellung von Wachstumprozessen mit Hilfe von Differentialgleichungen erster Ordung. [Descriping the growth process with first-order differential models]. Mitteillungen der Badenwürttembergischen Forstlichen Versuchs und Forschungsanstalt, Freiburg.
Storn R., Price K. (1997). Differential evolution – a simple and efficient heuristic for global optimization over continuous spaces. Journal of Global Optimization 11: 341–359. https://doi.org/10.1023/A:1008202821328.
State Forestry Administration (2014). The eighth forest resource survey report. http://211.167.243.162:8085/8/index.html.
Vanclay J.K., Sands P.J. (2009). Calibrating the self-thinning frontier. Forest Ecology and Management 259(1): 81–85. https://doi.org/10.1016/j.foreco.2009.09.045.
White J. (1981). The allometric interpretation of the self-thinning rule. Journal of Theoretical Biology 89(3): 475–500. https://doi.org/10.1016/0022-5193(81)90363-5.
Yang G., Li F., Yin T. et al. (2017). Research on the distribution and dynamics of forest carbon storage in Heilongjiang province. Northeast Forestry University Press, Harbin. 154 p. [In Chinese].
Yoda K., Kira T., Ogawa H., Hozumi K. (1963). Self-thinning in overcrowded pure stands under cultivated and natural conditions (Intraspecific competition among higher plants XI). Journal of Biology 14: 107–129.
Zhang H., Li F., Xu H. (2018). Research methods and practice of forest management. China Forestry Publishing House, Beijing. 475 p. ISBN 978-7-5038-9616-3.
Zheng W.J., Fu L.G. (1978). Flora Republicae Popularis Sinicae. Vol. 7. Science Press, Beijing. 213 p.
Total of 38 references.
