Aarne Hovi  ,
Matti Mõttus,
Jussi Juola,
Farshid Manoocheri,
Erkki Ikonen,
Miina Rautiainen
,
Matti Mõttus,
Jussi Juola,
Farshid Manoocheri,
Erkki Ikonen,
Miina Rautiainen
Evaluating the performance of a double integrating sphere in measurement of reflectance, transmittance, and albedo of coniferous needles
Hovi A., Mõttus M., Juola J., Manoocheri F., Ikonen E., Rautiainen M. (2020). Evaluating the performance of a double integrating sphere in measurement of reflectance, transmittance, and albedo of coniferous needles. Silva Fennica vol. 54 no. 2 article id 10270. https://doi.org/10.14214/sf.10270
Highlights
- Adaptation of a compact double integrating sphere for spectral measurements of coniferous needles
- Double integrating sphere is fast to operate and suitable for monitoring purposes and collection of large spectral databases
- Measured spectra showed negative bias, which could potentially be reduced by building an optimized measurement setup.
Abstract
Leaf reflectance and transmittance spectra are essential information in many applications such as developing remote sensing methods, computing shortwave energy balance (albedo) of forest canopies, and monitoring health or stress of trees. Measurement of coniferous needle spectra has usually been carried out with single integrating spheres, which has involved a lot of tedious manual work. A small double integrating sphere would make the measurements considerably faster, because of its ease of operation and small sample sizes required. Here we applied a compact double integrating sphere setup, used previously for measurement of broad leaves, for measurement of coniferous needles. Test measurements with the double integrating sphere showed relative underestimation of needle albedo by 5–39% compared to a well-established single integrating sphere setup. A small part of the bias can be explained by the bias of the single sphere. Yet the observed bias is quite significant if absolute accuracy of measurements is required. For relative measurements, e.g. for monitoring development of needle spectra over time, the double sphere system provides notable improvement. Furthermore, it might be possible to reduce the bias by building an optimized measurement setup that minimizes absorption losses in the sample port. Our study indicates that double spheres, after some technical improvement, may provide a new and fast way to collect extensive spectral libraries of tree species.
Keywords
vegetation;
albedo;
reflectance;
transmittance;
needle carrier;
spectra
-
Hovi,
Aalto University, School of Engineering, Department of Built Environment, P.O.Box 14100, FI-00760 Aalto, Finland
 https://orcid.org/0000-0002-4384-5279
E-mail
aarne.hovi@aalto.fi
https://orcid.org/0000-0002-4384-5279
E-mail
aarne.hovi@aalto.fi
-
Mõttus,
VTT Technical Research Centre Finland, P.O. Box 1000, FI-02044 VTT, Finland
https://orcid.org/0000-0002-2745-1966
E-mail
matti.mottus@gmail.com
- Juola, Aalto University, School of Engineering, Department of Built Environment, P.O.Box 14100, FI-00760 Aalto, Finland E-mail jussi.juola@aalto.fi
-
Manoocheri,
Aalto University, School of Electrical Engineering, Metrology Research Institute, Maarintie 8, FI-02150 Espoo, Finland
https://orcid.org/0000-0003-3935-3930
E-mail
farshid.manoocheri@aalto.fi
-
Ikonen,
VTT Technical Research Centre Finland, P.O. Box 1000, FI-02044 VTT, Finland; Aalto University, School of Electrical Engineering, Metrology Research Institute, Maarintie 8, FI-02150 Espoo, Finland
https://orcid.org/0000-0001-6444-5330
E-mail
erkki.ikonen@aalto.fi
-
Rautiainen,
Aalto University, School of Engineering, Department of Built Environment, P.O.Box 14100, FI-00760 Aalto, Finland; Aalto University, School of Electrical Engineering, Department of Electronics and Nanoengineering, P.O. Box 15500, FI-00760 Aalto, Finland
https://orcid.org/0000-0002-6568-3258
E-mail
miina.a.rautiainen@aalto.fi
Received 22 November 2019 Accepted 26 February 2020 Published 3 March 2020
Views 53937
Available at https://doi.org/10.14214/sf.10270 | Download PDF

Supplementary Files
1 Introduction
Radiative transfer (RT) or canopy reflectance models are necessary tools in remote sensing of forest and ecophysiological studies of trees. These models can be used in inverse mode, to retrieve vegetation biophysical parameters from remote sensing measurements (see reviews by Liang 2004 and Verrelst et al. 2015). To constrain the model inversion, information on leaf optical properties is however needed (Myneni et al. 2002). Leaf optical properties are important also in forward mode simulations to model shortwave energy balance (albedo) or productivity of forest canopies (Kuusinen et al. 2014; Hovi et al. 2016). In addition to use in modeling, in situ and laboratory measurements of leaf optical properties contribute to our general understanding of leaf spectral variability between and within tree species, which can aid, for example, in interpretation of species-specific spectral signatures observed in remote sensing data.
Directional-hemispherical reflectance and transmittance spectra – typical input variables in RT models – are usually measured with integrating spheres. Performing these measurements for coniferous needles is particularly challenging. A literature review of coniferous needle optical properties measurements was given by Yáñez-Rausell et al. (2014a). The main difficulty is that coniferous needles are narrow and do not fully cover the sample port in integrating spheres. Special sample holders, often called needle carriers, are used for holding the needles in the sample port during the measurement. In the most commonly used method, the needles are placed in the carrier side by side, with some gaps between individual needles (Daughtry et al. 1989). A placement in which needles are at least 0.5 needle widths apart is preferred to avoid multiple scattering between the needles (Yáñez-Rausell et al. 2014b). The gap fraction in the sample needs to be determined to remove its effect from the measurements. This can be done by painting the needles in black (Daughtry et al. 1989), or using image analysis techniques applied to digital photographs (Mesarch et al. 1999) or images acquired by scanners (Malenovský et al. 2006). The principle of removing the effect of gaps is already relatively well established and applied in many earlier studies (Middleton et al. 1997; Malenovský et al. 2006; Lukeš et al. 2013; Yáñez-Rausell et al. 2014b). In addition to the effect of gap fractions, the measured signal can be influenced by the needle carrier. This is either ignored or can be corrected empirically by using the needle carrier in both sample and white reference measurements. The latter was demonstrated by Yáñez-Rausell et al. (2014b). It would be preferable to model the effect of needle carrier physically and incorporate it already in the measurement equations. This would enable removal of its effect computationally.
In addition to technical challenges described above, one very practical challenge is time consumption of the measurements. Placement of the needles in the carrier is laborious manual work. In addition, many of the integrating spheres commonly used in field measurements require maneuvering with the light source and sample port configurations between reflectance and transmittance measurements. From these limitations it follows that collecting large spectral databases, which are needed e.g. for accurate inversion of RT models, is limited by the available time and resources. A small double integrating sphere would be fast to operate, because it requires less maneuvering with the light and the sample, and because the sample port and light beam are small, and therefore relatively small sample sizes (e.g. only 1–3 needles) are required. On the other hand, multiple scattering occurs between the two spheres, which complicates modeling of the measured signal mathematically. Equations that quantify the radiative power detected in double integrating spheres were presented by Pickering et al. (1992, 1993). Mõttus et al. (2017) applied a compact double integrating sphere setup for measurement of leaves of broadleaved trees. To date, an application to measurement of coniferous needles has not been reported.
The general objective of our work was to test a small double integrating sphere in measurement of directional-hemispherical reflectance and transmittance of coniferous needles. We start by modifying the equations that quantify the radiative power detected in double integrating spheres, by taking into account the effects of attenuation of radiation due to the needle carriers and gap fractions between needles. We apply the modified equations to a set of test measurements performed with single and double integrating spheres. Based on these results, we evaluate the potential of double integrating spheres in measurements of needle optical properties.
2 Materials and methods
2.1 Adapting the measurement equations for needle measurements
2.1.1 Equations for radiative power detected in a double integrating sphere
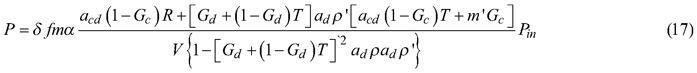
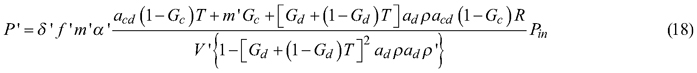
The equations that describe the power detected in a double integrating sphere with collimated light incident upon a flat sample covering the entire sample port were derived and presented in their original form by Pickering et al. (1992). To give the necessary background, we present the equations here. We use the same notation as in Mõttus et al. (2017). Symbols and abbreviations are listed in Table 1. Equations for radiative power detected in the reflectance (P) and transmittance (P’) spheres are:


| Table 1. List of symbols and abbreviations. Only unprimed symbols, representing the reflectance sphere, are given here. Corresponding primed symbols refer to the same quantities in the transmittance sphere. | |
| Symbol | Explanation |
| P | Detected power in the sample measurement |
| P(SPC) | Detected power when the sample port is covered by white reference panel (Spectralon) |
| P(0) | Detected power in an empty sphere |
| Pin | Incoming power |
| δ | Fraction of the sphere inner surface area taken up by the detector |
| s | Fraction of the sphere inner surface area taken up by the sample port |
| h | Fraction of the sphere inner surface area taken up by the other ports |
| α | Fraction of the sphere inner surface area not taken up by ports |
| m | Reflectance of the sphere coating |
| r | Reflectance of the other ports |
| f | Fraction of sphere inner surface seen by the detector |
| Rc | Specular reflectance for collimated light beam incident upon the sample |
| Rcd, Rcd,0 | Diffuse reflectance for collimated light beam incident upon the sample (with/without carrier) |
| Rd, Rd,0 | Diffuse reflectance for diffuse light incident upon the sample (with/without carrier) |
| RSPC | Reflectance of white reference panel (Spectralon) |
| Tc | Direct transmittance for collimated light beam incident upon the sample |
| Tcd, Tcd,0 | Diffuse transmittance for collimated light beam incident upon the sample (with/without carrier) |
| Td, Td,0 | Diffuse transmittance for diffuse light incident upon the sample (with/without carrier) |
| V | Average absorption of the sphere inner surface when there is a sample in the sample port |
| V0 | Average absorption of the sphere inner surface when there is no sample in the sample port |
| VSPC | Average absorption of the sphere inner surface when there is a Spectralon in the sample port |
| ρ | Sphere constant when there is a sample in the sample port |
| ρ0 | Sphere constant when there is no sample in the sample port |
| acd | Attenuation factor for collimated radiation that is diffusely scattered by the sample |
| ad | Attenuation factor for diffuse radiation that is diffusely scattered by the sample |
| a0 | Attenuation factor for diffuse radiation traveling through an empty sample port |
| Gc | Gap fraction for the collimated light beam incident upon the sample |
| Gd | Gap fraction for the diffuse radiation field incident upon the sample |
| R | Diffuse reflectance of the sample material |
| T | Diffuse transmittance of the sample material |
| Rb | Reflectance of black background |
| DIS | Double integrating sphere (OceanOptics SpectroClip-TR) |
| SIS | Single integrating sphere (ASD RTS-3ZC) |
| SISref | Reference single integrating sphere |
The reflectance and transmittance quantities, denoted by R and T with various subscripts, respectively, include Rcd for diffuse and Rc for specular reflection of collimated light incident upon the sample, Rd for diffuse reflection of diffuse light incident upon the sample, Tcd for diffuse and Tc for direct transmission of collimated light incident upon the sample, and Td for diffuse transmission of diffuse light incident upon the sample. Other variables in Eqs. 1 and 2 describe the measurement system: m is the reflectance of the sphere inner surface material, Pin is the input power, and the term δfmα models the response of the detector. Symbols without primes apply to the reflectance sphere, the primed symbols are their counterparts for the transmittance sphere.
We can define the constants V and ρ, the average absorption of the sphere inner surface, and the sphere constant, respectively. For an empty sphere (no sample in the sample port) the constants are:
![]()

For a sphere with a sample in the sample port they become:
![]()

2.1.2 Attenuation due to needle carriers
In needle optical properties measurements, the needles are usually placed into a needle carrier. In order to minimize the effect of carrier on measurements, the carrier is painted with a spectrally absorbing paint and has an opening that is of the same size or slightly larger than the sample port of the integrating sphere (Fig. 1). The sample is attached to the opening of the carrier (Fig. 1), and is illuminated with a collimated light beam, which is typically smaller than the sample port. The carrier cannot be made infinitely thin. Therefore, the distance of the sample from the sphere port increases compared to a measurement without carrier. This leads to some loss of the non-collimated radiation flux traveling from the sphere to the sample into the lateral directions, as well as the radiation flux that is diffusely scattered by the sample. These lateral fluxes, absorbed by the carrier, depend on the angular distributions of the incoming non-collimated radiation and radiation scattered by the sample, as well as on the distance between the port opening and the sample, i.e. thickness of the carrier. We propose attenuation factors to model the absorption losses. The largest losses, quantified by attenuation factor ad, are expected for the diffuse illumination that enters the sample from the sphere. In this case, the absorption occurs both when the radiation travels from the sphere to the sample, and when the radiation scattered by the sample travels back to the sphere. The second relevant case is the direct illumination of the sample with the collimated light beam. In this case, no losses are expected for the incident photons, and the radiation is attenuated only when it is diffusely scattered by the sample (attenuation factor acd). Assuming that the angular distributions of diffusely reflected and transmitted radiation are equal, we can apply the same attenuation factors to both reflectance and transmittance measurements. The reflectance and transmittance quantities therefore become:
![]()
![]()
![]()
![]()
where Rcd,0, Rd,0, Tcd,0, and Td,0 are the reflectance and transmittance quantities for the pure sample, without attenuations. The attenuation factor acd is expected to be larger (closer to unity indicating smaller losses) than ad because the area illuminated by the direct beam is smaller than port opening and the specular reflectance component will generally be scattered at a relatively small angle relative to sample normal, thus contributing little to the lateral flux. In addition to ad and acd, a third attenuation factor is possibly needed for modeling the attenuation of diffuse radiation that travels through the sample port, i.e. from one sphere to the other, when there is no sample but only the carriers in the port. We denote this by a0, and it corresponds to transmittance of an empty sample port with carriers.
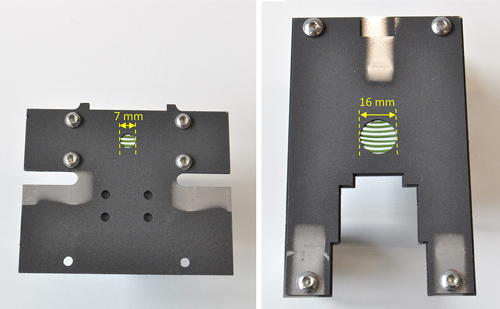
Fig. 1. Photographs of needle carriers with Norway spruce needles attached in the carrier opening. The carrier on the left was designed for Ocean Optics SpectroClip-TR double integrating sphere, and the carrier on the right was designed for ASD RTS-3ZC single integrating sphere. Diameters of the sample ports in these two measurements setups were 6 mm and 15 mm, respectively. See Section 2.2 and Supplementary file S1 for detailed description of these two measurement setups.
To illustrate the magnitude of the different attenuation factors we performed a ray tracing simulation. We assumed that the sample covers the entire sample port and has Lambertian reflectance. Further, we assumed that the collimated light beam entering the sample has uniform irradiance distribution, hits exactly at the center of the sample port, and its diameter is half of the diameter of the sample port. The diffuse radiation entering the sample port was assumed to originate equally from all sphere walls (sphere diameter = 3.5 × sample port diameter) and was thus close to isotropic. The carrier was assumed to have zero reflectance and its opening was assumed to have the same diameter as the sample port of the sphere, which corresponds to a typical measurement configuration. Results of the simulations for different sample port sizes and carrier thickness are shown in Fig. 2. As expected, acd was larger than the other two attenuation factors. The attenuation factors decreased, i.e. absorption increased, when the carrier thickness increased, or when the sample port became smaller. Both of these factors resulted in larger fraction of the scattered or incoming diffuse radiation to be absorbed by the carrier. Finally, we see that ad and a0 were almost equal.
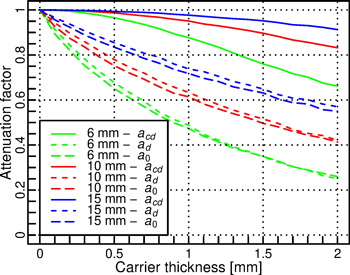
Fig. 2. Simulated attenuation factors for different sphere port diameters (6, 10, and 15 mm) and carrier thicknesses. The attenuation factors are defined separately for collimated radiation that is diffusely scattered by the sample (acd), for diffuse radiation that is diffusely scattered by the sample (ad), and for diffuse radiation traveling through an empty sample port (a0).
2.1.3 Gap fractions in the needle sample
If we assume that the specular reflection and direct transmission of the needles are zero, we can denote needle reflectance with R, and transmittance with T. In addition, there can be direct transmission through the sample port, if there are gaps between needles. The reflectance and transmittance quantities for the sample, including needles and the gaps between them, become:
![]()
![]()
![]()
![]()
![]()
![]()
where Gc is the gap fraction for the collimated light beam incident upon the sample, i.e. the probability for a photon in the collimated beam to pass the needles unscattered, and Gd is the gap fraction for the diffuse radiation field incident upon the sample. Substituting Eqs. 7–16 into Eqs. 1–2 gives the measurement equations for needle samples, which enable computation of R and T for needles. The computation is detailed in Section 2.3.
2.2 The experiment
2.2.1 Measurement setups
We performed an experiment with commercial double and single integrating spheres commonly used in measuring optical properties of plant leaves. The experiment comprised two parts. First, we compared the double and single integrating spheres to a reference method, to set a baseline against which all subsequent measurements can be compared. Second, a more detailed set of measurements was performed with the double and single integrating spheres only, to evaluate the performance of the double sphere in needle measurements.
Our primary measurement setups were SpectroClip-TR double integrating sphere (DIS) and ASD RTS-3ZC single integrating sphere (SIS). Descriptions of the setups were given in Hovi et al. (2018), and a more detailed description of DIS was given in Mõttus et al. (2017). Technical details of the setups are also explained in the Supplementary file S1. Needle carriers were made of 0.3-mm-thick stainless steel, and spray-painted with dark black Nextel Suede Coating that has directional-hemispherical reflectance of approx. 4% (Fig. 1). Technical drawings of the carriers are provided in Suppl. file S2. The sample port sizes were 6 mm for DIS and 15 mm for SIS, and the carrier openings were 1 mm wider (Fig. 1). The diameters of the collimated light beams used to illuminate the samples were approximately 3 mm for DIS and 7 mm for SIS. The illumination angle relative to the sample normal was 8° in DIS, and 0° and 13° in the transmittance and reflectance measurements by SIS, respectively. Measurements with DIS and SIS were performed at 1 nm intervals, starting from 350 nm and extending up to 2500 nm. However, due to absorption by the optical fibers applied, the usable wavelength range in DIS was 400–2100 nm, and all the results for DIS and SIS are therefore presented using this wavelength range.
The reference method measured reflectance and transmittance using a reference spectrometer including a light source, and a detection system based on a single integrating sphere with an internal diameter of 150 mm (Manoocheri and Nevas 2018). The reference method is used in calibrations of the national reference standards for hemispherical reflectance and transmittance in Finland, and is hereafter referred to as SISref. The sample port of the sphere was 25 mm, and the collimated light beam was approximately 7 mm in diameter. The illumination angle relative to the sample normal in both reflectance and transmittance measurements with SISref was 8°. The measurements were performed at 50 nm intervals, starting from 400 nm and extending up to 950 nm in wavelength, for which the performance of the setup has been validated. The sphere is rotated 180° between the reflectance and the transmittance measurements and the results are corrected for both configurations where the light reflected by the sphere wall contributes to the detected signal.
2.2.2 Sample materials
We measured samples of man-made materials and needles of Norway spruce (Picea abies (L.) Karst.). The man-made materials were white Whatman 114 laboratory chromatography paper and white transparent, 0.5-mm-thick silicon. These materials are hereafter referred to as “paper” and “silicon”. The paper was the same as measured by Hovi et al. (2018). The silicon was selected for comparison, because it had high T and low R, whereas the paper had low T and high R. The measurements of spruce needles were made on two days (5th–6th December 2018). The needles were taken from sample branches collected from approximately 8 m height from south (sun-exposed) side of a tree growing in the vicinity of Aalto University campus in Otaniemi, Finland (60°11´N, 24°50´E). The branches were collected from the tip of the same main branch of the tree in the morning (~9 AM) on both measurement days. The branches were stored in a refrigerator, and the measurements were performed within 12 hours from the branch collection. The needles were detached from the branches and placed in the needle carrier immediately before each measurement. To minimize the effect of potential temporal changes in the needles, we measured needle samples alternately with each method (i.e. one sample with DIS, two samples with SIS, two samples with DIS, etc.).
2.2.3 Measurements
Overview of the measurements is given below and in Table 2. Detailed descriptions of the measurement protocols and carrier configurations in the measurement setups are given in the Suppl. file S1.
| Table 2. Overview of samples measured in the experiment. For each sample two measurements were made: one for each side of sample. See Suppl. file S1 for the list of spectrometer readings recorded for each sample. | |||
| Double integrating sphere (DIS) | Single integrating sphere (SIS) | Reference method (SISref) | |
| Paper, leaf-like, without carriers a | 4 | 4 | 2 |
| Silicon, leaf-like, without carriers a | 4 | 4 | 2 |
| Paper, leaf-like, with carriers a | 4 | 4 | - |
| Silicon, leaf-like, with carriers a | 4 | 4 | - |
| Paper, needle-like | 6 | 6 | - |
| Norway spruce needles | 6 | 6 | - |
| a The same four samples were measured with all methods to minimize the effect of random variations. The reference method is an exception: a subset of two samples was measured with it due to time consumption. | |||
Comparison of SIS and DIS to SISref was performed by measuring leaf-like samples of the man-made materials. “Leaf-like” here refers to a sample that covers the entire sample port i.e. it has no gaps. No needle carriers were used in these measurements. The samples were labeled, i.e. exactly the same samples were measured with all methods. This ensured comparability of measurements, even though the number of samples was small.
Evaluation of DIS in measuring needles included two types of measurements that were performed with DIS and SIS only. First, the labeled leaf-like samples described above were re-measured so that they were placed in the needle carriers, to determine the effect of needle carriers on the measured spectra. Second, “needle-like” samples, i.e. 1-mm-wide slices cut from the paper, and real spruce needles were measured, to determine how accurately the effects of gaps in the sample can be corrected. During the measurements, three needles (or needle-like samples) were placed in the carrier of DIS, and seven needles (needle-like samples) in the carrier of SIS, at regular spacing so that the gap fractions were between 0.37–0.56 (Fig. 1). To avoid squeezing of the needles and thus changes in their shape, we placed thin metal plates in between the carriers when measuring needles. The total thickness of the plates was 0.6 mm. The needles were slightly thicker than this (up to 1 mm), but 0.6 mm was a compromise that ensured that the needles were not badly squeezed but, at the same time, did not move in the carriers during the measurements. The method can be easily adapted to different size of needles by changing the thickness of the plates in between the carriers.
2.3 Computation of reflectance and transmittance
2.3.1 Overview of computations
This section explains how reflectance and transmittance were computed from the measurements. We start by explaining computations for DIS (Section 2.3.2). These require as input the sphere constants and attenuation factors. We explain their derivation in Section 2.3.3. The computations for SIS are a special case of the general equations for DIS, and are presented in Section 2.3.4. Stray light and dark current were removed before the computations (see Suppl. file S1) and thus they can be ignored in all the formulas. Finally, gap fractions were needed as input when computing spectra of needles and needle-like samples. Measurement of gap fractions is explained in Section 2.3.5. For details of reflectance computations in SISref, the reader is referred to Manoocheri and Nevas (2018). The measurements of spectral transmittance were treated according to a similar procedure.
2.3.2 Solving for reflectance and transmittance in double integrating sphere
The complete measurement equations for coniferous needles, including gap fractions and attenuation factors, are obtained by substituting Eqs. 7–16 into Eqs. 1–2:
where:
![]()

In the DIS setup that we used, three different reference measurements are possible (Mõttus et al. 2017). These include measurement of white reference panel in the reflectance sphere (P(SPC)), measurement of empty reflectance sphere (P(0)) and measurement of empty transmittance sphere (P’(0)). We performed the reference measurements with the same carrier configuration as the sample measurements (see Suppl. file S1). Thus, the equations of the reference measurements were also extended to include the attenuation factors:


Division of P with P(SPC) and P’ with P’(0) gives two second order equations, which have two solutions for R and T. The physically meaningful solutions, yielding R and T values between 0and 1, are:


where
![]()
![]()

![]()


By setting gap fractions (Gc, Gd) to zero and the attenuation factors (a0, ad, acd/m’) to 1, the Eqs. 24–25 simplify to Equations 15 and 17 in Mõttus et al. (2017). The computation of R and T is thus similar to that presented for broad leaves in that publication: the Eqs. 24 and 25 are iterated until the solutions for R and T stabilize. An initial solution for either R or T is however needed. We obtained it by measuring the needles against a black background (Metal Velvet coating by Acktar Ltd., which had reflectance of 1%). The black background prevented the exchange of radiation between the spheres, and R could be derived directly from measurements of P and P(SPC), without knowledge on T:
where Rb is the reflectance of the black background. Because Eq. 34 was used only to give an initial approximation of R, we did not measure Rb, but used the nominal reflectance value (Rb = 0.01) given by the manufacturer.
2.3.3 Sphere constants and attenuation factors for the double integrating sphere
Noteworthy in Eqs. 24–33 is that the sphere constants that appeared in the original equations (Eqs. 1–2) are replaced with products of sphere constants and attenuation factors (adρ0, adρ0’, a0ρ0, a0ρ0’). The attenuation factors are therefore sphere properties that remain constant in all measurements. This implies also that the attenuation factors ad and a0 need not be solved separately: for reflectance and transmittance computations it is enough to know the products of the sphere constants and attenuation factors.
We start by solving the sphere constants for the reflectance sphere. As shown by Mõttus et al. (2017), the sphere constant ρ0, or, in our case a0ρ0, can be estimated using the ratio of P(0) to P’(0):

Eq. 35 is based on the assumption that the optical pathways from both spheres to the spectrometer are equal. In theory, it might be possible to estimate adρ0 separately, using measurements of known reflectance targets. However, based on our ray tracing computations shown earlier, ad is almost equal to a0, and therefore we assumed in all further calculations that adρ0 equals a0ρ0.
The remaining unknown parameters are acd/m’ and the sphere constant for transmittance sphere (a0ρ0’ = adρ0’). If either of them is known, the other can be solved from the ratio of P(0) to P(SPC). Based on simulation results in Fig. 2, acd is relatively small and can be ignored for perfectly designed spheres and small carrier thickness. In the DIS setup that we used, however, there are black-coated metal walls of approximately 0.7 mm thickness surrounding the sample ports. We measured reflectance of the black metal (the sphere outer surface is composed of the same material), and it was close to zero in visible wavelengths, increasing to approximately 0.8 in the near- and shortwave-infrared. The black walls therefore act as extra “carriers”, attenuating the signal particularly in the visible wavelengths. From Fig. 2 it is seen that 0.7-mm-thick walls having zero reflectance would result in acd value of approx. 0.93, when the sample port diameter is 6 mm (as it is in DIS). If we assume that the reflectance and transmittance spheres are equal (i.e. a0ρ0 = a0ρ0’), we can compute acd/m’ as:

The spheres in DIS are almost identical: the reflectance sphere only has one extra port (diameter 4 mm) from which the light enters the sphere. An alternative approach would be to assume that acd/m’ equals one, and estimate a0ρ0’ separately for the transmittance sphere, as was done in Mõttus et al. (2017).
Fig. 3 shows acd and a0ρ0 computed using Eqs. 35–36, with and without needle carriers. To obtain acd, we multiplied acd/m’ with the reflectance of the sphere wall (Spectralon). This was done for illustration purposes: in the reflectance and transmittance formulas acd always occurs together with m’, as long as similar needle carriers are used in the sample and reference measurements. The values of acd were the lowest in the visible wavelength region, which is logical because in those wavelengths the black walls surrounding the sample ports have high absorption. The high absorption in the visible wavelengths by the black walls is seen also as a decrease in a0ρ0 in the visible wavelengths. The values of acd and a0ρ0 shown in Fig. 3 were applied in all reflectance and transmittance computations. In addition, to test the results against the algorithm published by Mõttus et al. (2017), we tested setting acd/m’ to 1. This made the computation similar as used by Mõttus et al. (2017), except for small difference in the sphere constant for transmittance sphere, which however, had negligible impact on results.
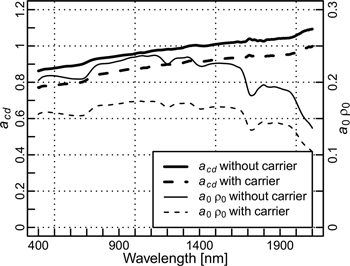
Fig. 3. Estimates of attenuation factor acd and sphere constant a0ρ0 in the double integrating sphere, with and without needle carriers.
2.3.4 Solving for reflectance and transmittance in single integrating sphere
Similarly as in computations for DIS, equations for reflectance and transmittance in SIS can be obtained by dividing P with P(SPC) (Eqs. 17 and 21) and P’ with P’(0) (Eqs. 18 and 23). The terms that model multiple scattering between two spheres can be ignored (i.e., [Gd+(1–Gd)T]adρ’[acd(1–Gc)T+m’Gc] in Eq. 17 and [Gd+(1–Gd)T]adρacd(1–Gc)R in Eq. 18 are set to zero, and {1–[Gd+(1–Gd)T]2adρadρ’} in Eqs. 17 and 18 and (1–a0ρ0a0ρ0’) in Eq. 23 are set to unity). Further, because the measurements were made in comparison mode, V equals VSPC, and V’ equals V0’. Finally, because the reference measurement for transmittance (P’(0)) was obtained by illuminating a Spectralon panel placed in a sample port, and a carrier was used also in that measurement, m’ is replaced with acdRSPC. Thus, the equations for reflectance and transmittance become:


These equations are similar as used by other authors for single spheres (Mesarch et al. 1999; Yáñez-Rausell et al. 2014b).
2.3.5 Measuring gap fractions
The gap fractions were estimated from 8-bit grayscale images obtained by scanning the carriers with needles. First, we prepared “light masks” that quantified the irradiance distributions of the direct illumination beams (both DIS and SIS), and that of the diffuse irradiance field incident upon the sample (DIS only). Second, the scanned images were binarized to obtain binary images (gap/no gap), and the gap fraction within the light mask was then computed as a weighted average of the binary image, with the values of the light mask as weights (sum of weights = 1).
The light masks for direct illumination beams, which were needed for computing the direct gap fraction (Gc), were prepared by measuring the light beam’s irradiance distribution, using a digital camera. The procedure is described in detail in Suppl. file S1. The diffuse irradiance field upon the sample port could not be measured from photographs. The light mask needed for computation of the diffuse gap fraction in DIS (Gd) was therefore generated by ray tracing simulation assuming perfectly diffuse irradiance at port surface. Because the sample port typically covers small fraction of the sphere inner surface area (e.g., in our DIS ~2%), the sensitivity to inaccuracies in diffuse gap fraction (Gd) is small.
For scanning the needle samples, we used a digital film scanner (Epson perfection V550). The scan resolution was 800 dpi, which has been used also previously (Yáñez-Rausell 2014b; Hovi et al. 2017), and was confirmed for this study by scanning needles with different resolutions and performing the binarization for each resolution, which revealed that gap fractions were unchanged for resolutions from 800 dpi upwards. For image binarization we applied a global threshold i.e. the same threshold for all samples of similar material. We determined suitable threshold values using measurements with SIS. For the needle-like paper samples we searched for a threshold that minimized the difference to the measurement of leaflike paper samples with carriers. For coniferous needles no reference was available, and we therefore searched for a threshold value that resulted in zero transmittance at blue wavelengths (410–420 nm). The obtained threshold values were applied to image binarization in both SIS and DIS.
3 Results
3.1 Comparison of double and single integrating spheres to reference
When measuring leaf-like samples without needle carriers, SIS overestimated transmittance by 5–6% in relative terms compared to SISref (Fig. 4a,b, Table 3). On the other hand, DIS underestimated transmittance by 8–13% when acd/m’ was assumed to be 1. When acd/m’ deviated from unity, transmittance became closer to the reference (0–4% underestimation). The results for reflectance depended on the measured material (Fig. 4c,d, Table 3). For paper, differences were small, i.e. 0–2% overestimation independent of measurement setup. For silicon, DIS underestimated reflectance considerably (17–28%), and SIS moderately (6–9%). The reflectance and transmittance differences influenced also albedo i.e. the sum of reflectance and transmittance (Fig. 4e,f, Table 3), which was slightly overestimated by SIS (1–3%), and underestimated by DIS with acd/m’ set to 1 (0–14%). When acd/m’ deviated from unity, DIS produced almost unbiased albedo for the paper (1% overestimation), but still underestimated albedo of the silicon considerably (8–10%), mainly due to the reflectance underestimation. The estimated values of attenuation coefficient acd were slightly larger than 1 for wavelengths above 1300 nm (Fig. 3), which indicates that the estimate of acd/m’ was affected by the assumption of equal spheres, and is thus slightly inaccurate. However, because use of acd/m’ deviating from unity improved the match between DIS and reference measurement, it was used in all results reported hereafter.
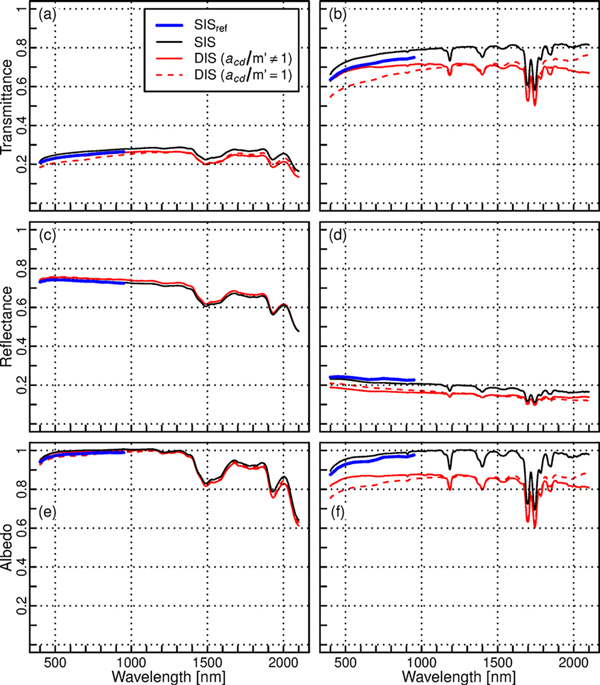
Fig. 4. Mean transmittance (a, b), reflectance (c, d), and albedo (e, f) spectra of leaf-like samples of paper (left column: a, c, e) and silicon (right column: b, d, f) measured with different methods (SISref = reference method, SIS = single integrating sphere, DIS = double integrating sphere). No needle carriers were used in these measurements.
| Table 3. Relative mean differences [%] of double (DIS) and single (SIS) integrating spheres against the reference method (SISref) for leaf-like paper and silicon samples measured without needle carriers. The values are given separately for all wavelengths (400–950 nm), and visible (400–700 nm) and near-infrared (700–950 nm) regions. | ||||||
| All (400–950 nm) | Visible (400–700 nm) | Near-infrared (700–950 nm) | ||||
| Paper | Silicon | Paper | Silicon | Paper | Silicon | |
| Transmittance | ||||||
| DIS, acd/m’=1 | –9 | –12 | –11 | –13 | –8 | –10 |
| DIS, acd/m’≠1 | –1 | –3 | 0 | –2 | –2 | –4 |
| SIS | 6 | 5 | 6 | 6 | 6 | 5 |
| Reflectance | ||||||
| DIS, acd/m’=1 | 2 | –19 | 2 | –17 | 2 | –22 |
| DIS, acd/m’≠1 | 2 | –26 | 2 | –25 | 2 | –28 |
| SIS | 0 | –7 | 0 | –6 | 0 | –9 |
| Albedo | ||||||
| DIS, acd/m’=1 | –1 | –13 | –1 | –14 | 0 | –13 |
| DIS, acd/m’≠1 | 1 | –9 | 1 | –8 | 1 | –10 |
| SIS | 2 | 2 | 1 | 3 | 2 | 2 |
To summarize, there were inherent differences between DIS and SIS, which resulted in up to 14% difference in albedo, even when measuring leaf-like samples without needle carriers (Table 4). These differences should be kept in mind when interpreting the results of comparisons between DIS and SIS.
| Table 4. Relative mean difference [%] of double integrating sphere (DIS) against single integrating sphere (SIS) for different targets and measurement configurations. The values are given separately for all wavelengths (400–2100 nm), and visible (400–700 nm) near-infrared (700–1300 nm) and shortwave-infrared (1300–2100 nm) regions. | ||||||||||||
| All (400–2100 nm) | Visible (400–700 nm) | Near-infrared (700–1300 nm) | Shortwave-infrared (1300–2100 nm) | |||||||||
| Paper | Silicon | Spruce needles | Paper | Silicon | Spruce needles | Paper | Silicon | Spruce needles | Paper | Silicon | Spruce needles | |
| Transmittance | ||||||||||||
| Leaflike, without carrier | –9 | –11 | - | –6 | –7 | - | –7 | –10 | - | –12 | –14 | - |
| Leaflike, with carrier | –10 | –9 | - | –9 | –4 | - | –7 | –8 | - | –12 | –11 | - |
| Needlelike, with carrier | –11 | - | –62 | –9 | - | –107 | –7 | - | –31 | –15 | - | –67 |
| Reflectance | ||||||||||||
| Leaflike, without carrier | 2 | –19 | - | 2 | –21 | - | 2 | –21 | - | 2 | –18 | - |
| Leaflike, with carrier | 1 | –17 | - | 1 | –17 | - | 1 | –19 | - | 1 | –15 | - |
| Needlelike, with carrier | –4 | - | –17 | –4 | - | –24 | –5 | - | –11 | –4 | - | –19 |
| Albedo | ||||||||||||
| Leaflike, without carrier | –1 | –13 | - | 0 | –10 | - | 0 | –12 | - | –2 | –14 | - |
| Leaflike, with carrier | –2 | –10 | - | –1 | –7 | - | –1 | –10 | - | –3 | –12 | - |
| Needlelike, with carrier | –6 | - | –31 | –5 | - | –35 | –5 | - | –19 | –7 | - | –39 |
3.2 Effect of needle carriers
We evaluated the effect of needle carriers by measuring the same leaf-like samples that were measured in the previous section, but now placing them in the needle carriers. Generally, the effect of carriers could be well corrected (Fig. 5). The only notable exception was the transmittance measurement of silicon. In it, the presence of a carrier increased the transmittance values. The increase was the largest for DIS, in which the transmittance increased up to 6% in relative terms (approx. 0.05 in absolute transmittance units), when carriers were added (Fig. 5b). Overall, the relative differences between DIS and SIS did not change considerably (max. change of 3 percentage points in relative albedo difference between methods) after adding carriers (Table 4).
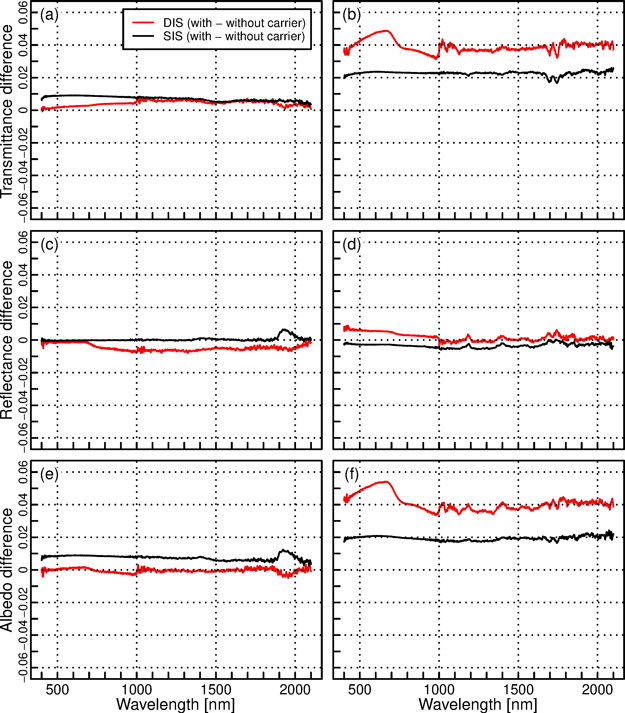
Fig. 5. Mean differences in transmittance (a, b), reflectance (c, d), and albedo (e, f) spectra when the measurements were performed with and without needle carriers. The materials measured were paper (left column: a, c, e), and silicon (right column: b, d, f). The color of lines represents different methods (SIS = single integrating sphere, DIS = double integrating sphere).
3.3 Spectra of needle-like samples and real needles
Next, we looked at the differences between SIS and DIS in measurements of needle-like paper samples and real spruce needles. The general shape of the spectra matched well between methods (Fig. 6). For paper, the differences between methods were slightly increased compared to leaf-like samples, but yet relatively small i.e. up to 7% in albedo (Table 4). For spruce needles, up to 24% relative underestimation of reflectance by DIS was observed (Table 4). Transmittance of needles was also underestimated: the relative underestimation could be as large as 67% and 107%. These values were observed in the visible and shortwave-infrared regions, respectively (Table 4). Large relative errors are mainly because the absolute transmittance values of spruce needles were small in these wavelength regions. For blue region and part of shortwave-infrared region, DIS produced negative transmittance values (minimum transmittance of –0.024 at 406 nm, Fig. 6), which is likely caused by slight biases in the estimates of gap fractions. It should be kept in mind that SIS overestimated transmittance by 5–6% in visible and near-infrared regions (Table 3). Thus, the true underestimation of transmittance by DIS is probably slightly smaller than obtained from comparisons with SIS. Overall, the transmittance and reflectance underestimations resulted in DIS underestimating albedo by 5–7% for paper, and by 19–39% for spruce needles, when compared to SIS (Table 4). The reported differences were statistically significant (p < 0.05), except for transmittance of paper in visible to near-infrared, reflectance of paper in the shortwave-infrared, and transmittance and albedo of spruce needles in the visible wavelengths (Fig. 6). Finally, standard deviations of the spectra were compared (Fig. 7). SIS produced somewhat lower standard deviations than DIS, except for reflectance of spruce needles, for which standard deviations were similar between methods.
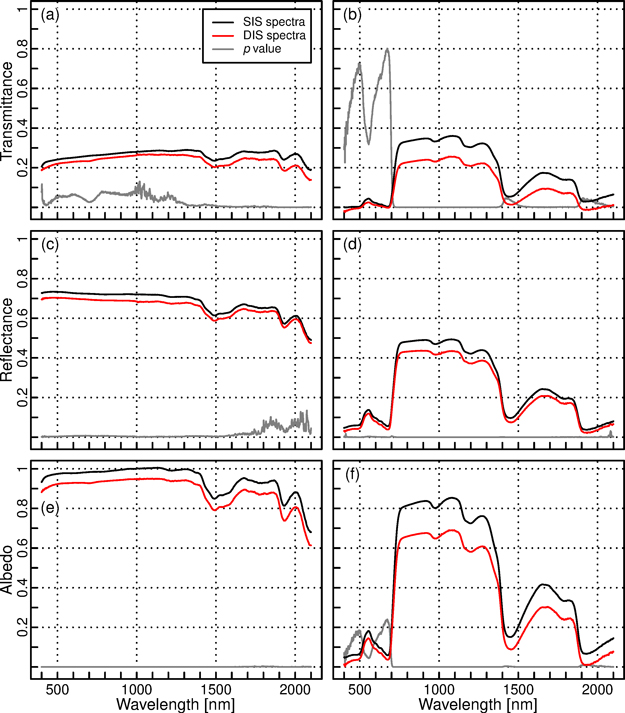
Fig. 6. Mean transmittance (a, b), reflectance (c, d), and albedo (e, f) spectra of needle-like samples of paper (left column: a, c, e) and spruce needles (right column: b, d, f) measured with single (SIS) and double (DIS) integrating spheres. The gray line indicates p value of Welch’s t-test (the scale is the same as for the spectral quantities, i.e. from 0 to 1).
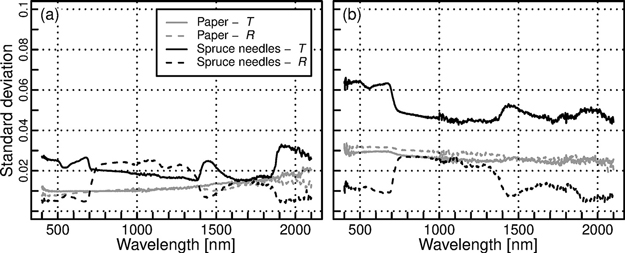
Fig. 7. Standard deviation of reflectance (R) and transmittance (T) spectra of paper and spruce needles measured with (a) single integrating sphere (SIS) and (b) double integrating sphere (DIS).
4 Discussion
Measurement of coniferous needle reflectance and transmittance spectra with traditional single integrating spheres involves lots of manual work, in both preparation of the samples and in operation of the measurement setup, especially in field conditions. This makes the measurements time consuming, expensive, and difficult to apply to large number of samples. This is the main reason for why there are so few spectral libraries of coniferous tree species to date. The new double sphere is notably faster to operate than single integrating sphere. The measurement speed depends on the applied settings (e.g. integration time), but for broad leaves it was found that SIS can be approximately four times as fast as DIS when both applied same integration times (Hovi et al. 2018). We did not evaluate measurements speed in this study, but estimate that for coniferous needles the difference can be even larger, because the sample preparation in DIS (3 needles) is faster than in SIS (7 needles). Thus, DIS enables collection of large spectral databases that could be utilized in RT model inversions, or in any other ways to improve understanding and interpretation of remote sensing data. The double sphere is also optimal for quick monitoring type of measurements. As an example, currently only very few studies have examined seasonal variations of needle spectra (see review in Rautiainen et al. 2018). In addition to remote sensing applications, these measurements could be utilized e.g. in modeling seasonal variation of forest albedos. Yet another interesting application could be monitoring health or stress of trees based on their needles’ spectra.
Considering the many practical benefits that the double sphere offers, it is somewhat disappointing that it showed underestimation of needle reflectance and transmittance compared to the single integrating sphere. Any biases at needle level propagate to the canopy level when applying the measured spectra in RT models. To ensure that the biases were not caused by measurement uncertainties or sample variability, several precautions were taken. In case of leaf-like samples, exactly the same samples were measured with all methods, which eliminated the effects of between-sample variability. The differences between DIS and SIS were similar as observed by Hovi et al. (2018), and the overall differences between methods (up to 28%) exceeded the expected measurement uncertainty of SISref (2%). In case of needle-like samples and needles, where the same physical samples could not be measured and between-sample variability can have a larger role, the samples were taken from the same population (see Section 2.2.2 for sampling strategy and precautions that minimized the effects of needle aging), and statistical tests were performed to confirm the between-method differences. For spruce needles, the differences were statistically significant for all except the visible wavelengths, where the uncertainties in transmittance due to uncertainties in determining gap fractions are large compared to the generally low transmittance values of needles. However, similarly as for other wavelengths, also in the visible region the reflectance, transmittance, and albedo were consistently underestimated by DIS. Thus, the observed bias must have been caused by systematic differences between methods that the measurement equations could not fully take into account. It should be noted that we used standard (commercial) off-the-shelf setups and were therefore limited by the choices made in their design. To point out ways for improvements in the future, we discuss potential causes for the biases in more detail below.
Interesting differences were identified by the comparison of the DIS and SIS setups against the reference method. As shown already by Hovi et al. (2018), DIS underestimates transmittance compared to SIS. Comparison to the reference method revealed which of the methods provides results closer to “truth”, and thus helped to evaluate potential causes for the differences. The transmittance overestimation by SIS is probably caused by the geometric non-equivalence of the sample and reference measurements. The sphere port of SIS that holds the white reference for transmittance has relatively thick walls, whereas the sphere port that holds the sample in the transmittance measurement has thin knife-edges. In addition, the distance of the lamp and thus the beam geometry is different for the reflectance and transmittance measurements in SIS. The transmittance underestimation by DIS, when acd/m’ was set to 1 (i.e. the algorithm corresponding to that used by Mõttus et al. 2017), is an indication of absorption losses in the sample port due to its black walls that act as extra “carriers”. An ideal sphere would have knife-edges in its sample port, which would reduce, although not necessarily completely remove, the lateral losses. Allowing acd/m’ to deviate from unity, thus attempting to account for the losses, resulted in a transmittance increase in visible wavelengths, where the absorption by the black walls around the sample port was at its highest. The reflectance underestimation by both SIS and DIS for the silicon samples can be because the silicon was thick (0.5 mm) and therefore the lateral losses in the sample can be substantial. The larger underestimation by DIS, with a smaller sample port and therefore larger losses, supports this explanation. A general implication from the comparison is that integrating spheres designed for field use can have biases even when measuring flat samples that fully cover the sample port. Based on our measurements, these biases are typically less than 10% in relative terms, but can reach almost 30% for some targets, such as the white silicon.
The effects of needle carriers were satisfactorily compensated for by the correction equations, and the differences between methods were not notably changed when adding needle carriers in the measurements. Reasonably small differences between methods (up to 7% relative difference in albedo) were also observed when measuring needle-like samples of paper. However, when measuring real spruce needles, larger differences between methods were observed (up to 39% relative difference in albedo). A small part of this difference can come from the inherent differences between methods described above, but still majority of the difference is specific to the measurement of needles.
The most likely reason for the albedo underestimation observed for needles are lateral losses in the sample. The spruce needles were thick (as is natural) and were placed in a 0.6 mm space between the carriers. Therefore, the carriers absorbed more than they would do in case of a thin flat sample. Adding a 0.3-mm-thick carrier to the measurement increases the absorption (reduces acd) by approximately 8% (i.e., the change from a 0.7-mm-thick carrier, which equals to an empty sample port with its black walls, to a 1-mm-thick carrier along the green solid line in Fig. 3). Our correction equations assumed that the scattering by the sample is Lambertian and occurs at the level of the lower surface of the carrier. The equations therefore only compensated for this 8% absorption. Additional losses of similar magnitude can occur when the radiation is scattered by parts of spruce needle that are located somewhere in the middle of the 0.6 mm space between the two carriers. A further effect comes from the shape of the needles, which for spruce needles is close to parallelepiped. Compared to flat samples, a larger fraction of radiation is scattered towards oblique angles and is subsequently absorbed by the carriers. To minimize the lateral losses, the diameter of the sample port in relation to needle size should be maximized, and the light beam should be small enough so that is would illuminate only slightly more than one needle at a time. Remaining lateral losses could potentially be modeled by ray tracing simulation that would take into account the shape of needles, and then compensated for. However, corrections based on simulations would be only approximations, and therefore minimizing the losses by the design of the setup is recommended.
The differences in standard deviations between the two setups deserve also some thought. Due to the small size of the light beam in DIS, the estimates of gap fractions are easily affected by potential displacement of the carrier during measurements or scanning, or inaccuracies in the light mask. We used the scanned images and light mask to determine gap fractions, because it was the only method that could estimate gap fractions for the reflectance measurements in SIS (different beam geometry compared to the transmittance measurement). In any setup that employs the same beam geometry for both reflectance and transmittance measurements, the gap fraction for needle samples can be estimated from the transmittance measurements made at blue or red wavelengths, because needles have close to zero transmittance in those wavelengths. Uncertainties could be reduced further by painting the illuminated side of the needles in black (Daughtry et al. 1989), in order to prevent specular reflections from the illuminated side to contribute to transmittance measurements. The avoidance (or minimization) of specular reflections could also potentially be achieved by guiding the directly transmitted (collimated) radiation out of the sphere through an open port, if such exists, and detecting it by an external detector (Pickering et al. 1993). Future experiments need to evaluate the accuracies of these different techniques. In any case, double spheres have the benefit that the beam geometry does not vary between reflectance and transmittance measurements, and therefore these alternative techniques for estimation of direct gap fraction (Gc) can be utilized.
As a conclusion, a double integrating sphere is useful for fast measurements of coniferous needle reflectance and transmittance. In addition, it requires less maneuvering and movement of the samples during measurements, which makes it less error prone. The setup that we tested shows negative bias compared to a single sphere, but it seems possible to build an optimized setup that would reduce the bias. However, this calls for a complete redesign of the setup, which was not possible in our current study that relied on existing commercial setups. As such, the double sphere setup described here can provide notable improvements in applications where speed of measurements is important, and where only relative instead of absolute accuracy is required. In addition, our equations that model the effect of needle carriers may also be useful in improving comparability of needle spectra measured with any setups in which similar carriers are employed. Overall, our study indicates that double spheres, after some technical improvement, may provide a new and fast way to collect extensive spectral libraries of tree species.
Acknowledgements
This study has received funding from the European Research Council (ERC) under the European Union’s Horizon 2020 research and innovation programme (grant agreement No 771049). The text reflects only the authors´ view and the Agency is not responsible for any use that may be made of the information it contains. This study was also partly funded by the Academy of Finland projects BOREALITY, DIMEBO, and AIROBEST (grants 286390, 323004, and 317387).
References
Daughtry C.S.T., Biehl L.L., Ranson K.J. (1989). A new technique to measure the spectral properties of conifer needles. Remote Sensing of Environment 27(1): 81–91. https://doi.org/10.1016/0034-4257(89)90039-4.
Hovi A., Liang J., Korhonen L., Kobayashi H., Rautiainen M. (2016). Quantifying the missing link between forest albedo and productivity in the boreal zone. Biogeosciences 13(21): 6015–6030. https://doi.org/10.5194/bg-13-6015-2016.
Hovi A., Raitio P., Rautiainen M. (2017). A spectral analysis of 25 boreal tree species. Silva Fennica 51(4) article 7753. 16 p. https://doi.org/10.14214/sf.7753.
Hovi A., Forsström P., Mõttus M., Rautiainen M. (2018). Evaluation of accuracy and practical applicability of methods for measuring leaf reflectance and transmittance spectra. Remote Sensing 10(1) article 25. 19 p. https://doi.org/10.3390/rs10010025.
Kuusinen N., Lukeš P., Stenberg P., Levula J., Nikinmaa E., Berninger F. (2014). Measured and modelled albedos in Finnish boreal forest stands of different species, structure and understory. Ecological Modelling 284: 10–18. https://doi.org/10.1016/j.ecolmodel.2014.04.007.
Liang S. (2004). Quantitative remote sensing of land surfaces. John Wiley & Sons, Inc. https://doi.org/10.1002/047172372X.
Lukeš P., Stenberg P., Rautiainen M., Mõttus M., Vanhatalo K.M. (2013). Optical properties of leaves and needles for boreal tree species in Europe. Remote Sensing Letters 4(7): 667–676. https://doi.org/10.1080/2150704X.2013.782112.
Malenovský Z., Albrechtová J., Lhotáková Z., Zurita-Milla R., Clevers J.G.P.W., Schaepman M.E., Cudlín P. (2006). Applicability of the PROSPECT model for Norway spruce needles. International Journal of Remote Sensing 27(24): 5315–5340. https://doi.org/10.1080/01431160600762990.
Manoocheri F., Nevas S. (2018). Instruction manual of diffuse reflectance measurements. Aalto University, School of Electrical Engineering, Metrology Research Institute. 17 p. http://metrology.aalto.fi/quality/IMDREFL.pdf.
Mesarch M.A., Walter-Shea E.A., Asner G.P., Middleton E.M., Chan S.S. (1999). A revised measurement methodology for conifer needles spectral optical properties: evaluating the influence of gaps between elements. Remote Sensing of Environment 68(2): 177–192. https://doi.org/10.1016/S0034-4257(98)00124-2.
Middleton E.M., Chan S.S., Rusin R.J., Mitchell S.K. (1997). Optical properties of black spruce and jack pine needles at BOREAS sites in Saskatchewan, Canada. Canadian Journal of Remote Sensing 23(2): 108–119. https://doi.org/10.1080/07038992.1997.10855193.
Mõttus M., Hovi A., Rautiainen M. (2017). Theoretical algorithm and application of double-integrating sphere system for measuring leaf transmittance and reflectance spectra. Applied Optics 56(3): 563–571. https://doi.org/10.1364/AO.56.000563.
Myneni R.B., Hoffman D., Knyazikihin Y., Privette J.L., Glassy J., Tian Y., Votava P., Nemani R.R., Running S.W. (2002). Global products of vegetation leaf area and fraction absorbed PAR from year one of MODIS data. Remote Sensing of Environment 83(1–2): 214–231. https://doi.org/10.1016/S0034-4257(02)00074-3.
Pickering J.W., Moes C.J.M., Sterenborg H.J.C.M., Prahl S.A., van Gernert M.J.C. (1992). Two integrating spheres with an intervening scattering sample. Journal of the Optical Society of America A 9(4): 621–631. https://doi.org/10.1364/JOSAA.9.000621.
Pickering J.W., Prahl S.A., van Wieringen N., Beek J.F., Sterenborg H.J.C.M., van Gernert M.J.C. (1993). Double-integrating-sphere system for measuring the optical properties of tissue. Applied Optics 32(4): 399–410. https://doi.org/10.1364/AO.32.000399.
Rautiainen M., Lukeš P., Homolová L., Hovi A., Pisek J., Mõttus M. (2018). Spectral properties of coniferous forests: a review of in situ and laboratory measurements. Remote Sensing 10(2): 207. https://doi.org/10.3390/rs10020207.
Verrelst J., Camps-Valls D., Muñoz-Marí J., Pablo J., Veroustraete F., Clevers J.G.P.W., Moreno J. (2015). Optical remote sensing and the retrieval of terrestrial vegetation bio-geophysical properties – a review. ISPRS Journal of Photogrammetry and Remote Sensing 108: 273–290. https://doi.org/10.1016/j.isprsjprs.2015.05.005.
Yáñez-Rausell L., Schaepman M.E., Clevers J.G.P.W., Malenovský Z. (2014a). Minimizing measurement uncertainties of coniferous needle-leaf optical properties. Part I: methodological review. IEEE Journal of Selected Topics in Applied Earth Observations and Remote Sensing 7(2): 399–405. https://doi.org/10.1109/JSTARS.2013.2272890.
Yáñez-Rausell L., Malenovský Z., Clevers J.G.P.W., Schaepman M.E. (2014b). Minimizing measurement uncertainties of coniferous needle-leaf optical properties. Part II: experimental set-up and error analysis. IEEE Journal of Selected Topics in Applied Earth Observations and Remote Sensing 7(2): 406–420. https://doi.org/10.1109/JSTARS.2013.2292817.
Total of 19 references.
