Tapani Repo  ,
Virva Volanen,
Pertti Pulkkinen
,
Virva Volanen,
Pertti Pulkkinen
No difference in the maximum frost hardiness of different pedunculate oak populations in Finland
Repo T., Volanen V., Pulkkinen P. (2022). No difference in the maximum frost hardiness of different pedunculate oak populations in Finland. Silva Fennica vol. 56 no. 2 article id 10620. https://doi.org/10.14214/sf.10620
Highlights
- Four pedunculate oak populations were compared for their maximum frost hardiness (FHmax) at two sampling times in midwinter
- Based on the initiation of the low temperature exotherm (LTE), FHmax was an average of –41 °C
- Based on the relative electrolyte leakage method, FHmax was an average of –46 °C and –41 °C in the first and second sampling time respectively
- No significant differences were observed among the populations
- Within-population variation in the LTE was high, providing potential for breeding
- In extreme winters, FHmax may be critical for the growth and survival of oak in central and northern Finland.
Abstract
The natural northern distribution limit for pedunculate oak (Quercus robur L.) is in southern Finland. We hypothesized that the maximum frost hardiness (FHmax) in the winter limited the cultivation of oaks in northern latitudes. We tested the hypothesis with controlled freezing tests in midwinter. The acorns for the experiment were collected from the four main oak populations in southernmost Finland. The seedlings were raised in the nursery, frost hardened in field conditions, and then moved to a growth chamber at –2 °C on two occasions in winter and tested for FHmax in controlled freezing tests. Frost hardiness was assessed by differential thermal analysis (DTA) based on the low temperature exotherm (LTE) and relative electrolyte leakage (REL) of the stem, and visual damage scoring (VD) of the buds and stem. The initiation and peak of the LTE took place at an average of –41 °C and –43 °C respectively, without differences among the populations. The variation in the initiation and peak of the LTE was high, ranging from –34.6 °C to –45.5 °C and from –37.1 °C to –46.9 °C respectively. According to the REL method, the frost hardiness of the populations ranged from –44.0 °C to –46.4 °C in February and from –40.6 °C to –41.6 °C in March, without significant differences among the populations. According to VD, the bud was the least frost hardy organ, with FH between –19 °C and –33 °C, depending on population and assessment time. We conclude that the maximum hardiness may set the limit for the distribution of pedunculate oak northwards, but the high within-population variation offers potential to breed more frost hardy genotypes.
Keywords
climate change;
differential thermal analysis;
electrolyte leakage;
low-temperature exotherm;
species distribution;
visual damage scoring
-
Repo,
Natural Resources Institute Finland (Luke), Natural Resources, Yliopistokatu 6b, FI-80100 Joensuu, Finland
 https://orcid.org/0000-0002-7443-6275
E-mail
tapani.repo@luke.fi
https://orcid.org/0000-0002-7443-6275
E-mail
tapani.repo@luke.fi
- Volanen, Kalevankatu 4b B21, FI-80110 Joensuu, Finland E-mail virva.volanen@siunsote.fi
-
Pulkkinen,
Natural Resources Institute Finland (Luke), Production systems, Latokartanonkaari 9, FI-00790 Helsinki, Finland
https://orcid.org/0000-0002-1643-7691
E-mail
pertti.pulkkinen@luke.fi
Received 12 August 2021 Accepted 4 February 2022 Published 8 February 2022
Views 45741
Available at https://doi.org/10.14214/sf.10620 | Download PDF

1 Introduction
Pedunculate oak (Quercus robur L.) has a wide distribution range in Europe (Zanetto et al. 1994). The natural northern distribution limit in Europe is in southern Finland, below a latitude of 61o N (Hämet-Ahti et al. 1992; Zanetto et al. 1994; Ferris et al. 1998), where several indigenous populations are located in the southwestern part of the country. Single scattered trees may grow in central Finland, and some even north of the Arctic Circle (Talvensaari 2020). Insufficient frost hardiness, including the timing of hardening in the fall, maximum frost hardiness in the midwinter, and the timing of de-hardening in the spring, is assumed to limit the growth and survival of this species at high latitudes. Findings from previous studies showed that the timing of frost hardening of the northern genotype in Finland was not critical for oak seedlings (Repo et al. 2008, 2021). Comparisons of frost hardiness among 11 north European pedunculate oak provenances found that the coastal provenances were less frost-tolerant than continental and northern ones (Jensen and Deans 2004). However, the maximum frost hardiness in the midwinter was not assessed in the previous studies. It is therefore unclear whether the lowest midwinter temperatures, –40 °C and even below, temporarily occurring in central and northern Finland (https://en.ilmatieteenlaitos.fi/download-observations), would be critical for the survival of the northern oak ecotypes, and therefore for their cultivation further north of their current distribution range.
Pedunculate oak belongs to the species with a ring porous xylem structure (Blackwell 2004). Such tree species exhibit anti-ice nucleation activity to promote deep-supercooling of the aqueous solution in the xylem ray parenchyma cells (George and Burke 1977; George et al. 1974, 1982). The ice nucleation in plant cells can be studied by differential thermal analysis (DTA). The measurement results in a high temperature exotherm (HTE) at temperatures typically higher than –10 °C and a low temperature exotherm (LTE) in cells with deep-supercooling below the homogenous nucleation temperature of pure water (–38.1 °C) (Sakai and Larcher 1987; Repo et al. 2021). Some species may also have multiple exotherms at low temperatures (Ketchie and Kammereck 1987; Räisänen et al. 2006b). In frost hardened cells, HTE is not harmful, but leads to cellular dehydration and increased frost hardiness. The occurrence of an LTE of deep-supercooled cells is considered critical for survival. In the scoring among the species in the cold regions in North America, an LTE was found to define their northern geographical distribution (George et al. 1974). The LTE as observed by DTA is a result of the freezing of several deep-supercooled cells at the same time. Calorimetric analysis of the fine structure of the LTE of shagbark hickory (Carya ovata [Mill.] K.Koch.) twigs revealed that each single peak within the LTE roughly equaled the freezing of 100 ray parenchyma cells (George and Burke 1977). In species with multiple exotherms like apple, the LTE was fairly stable between –35 °C and –40 °C for most of the year, but other exotherms occurring between high- and low-temperature exotherms changed during frost hardening and dehardening (Ketchie and Kammereck 1987).
Although ice nucleation in xylem ray parenchyma cells and thus in the LTE is critical for the survival of pedunculate oak, it may also suffer freezing injuries in other cell layers if their dehydration tolerance is exceeded. In the previous study, the LTE of the oak stem of a Finnish population was observed at –36 °C at the beginning of December, but FHmax had probably not been reached (Repo et al. 2008, 2021). In that study, the maximum rate of relative electrolyte leakage (REL) of the stem, indicating cell membrane injuries, reached its maximum below –40 °C. However, electrolyte leakage already started to increase at higher temperatures than –40 °C indicating cell membrane damage in a wide temperature range (Repo et al. 2021, see also Strimbeck et al. 2008; Mayoral et al. 2015). In contrast with intracellular freezing and the resulting LTE, a gradual increase in REL indicates cell membrane damage in cell layers other than xylem ray parenchyma cells (Rajashekar and Burke 1978; Ketchie and Kammereck 1987). Therefore, the LTE and increased REL may occur partly at a different temperature range. It is probable that the frost hardiness of cell layers, that is, based on dehydration tolerance/avoidance, changes depending on the stage of the annual cycle and may therefore exceed the frost hardiness of the LTE, which is more stable. Because low temperatures even below –40 °C may occasionally occur in central Finland, becoming more common moving northwards, a question arises concerning the criticality of low midwinter temperatures for oaks. If this were the case, the predicted milder winters in future would make the circumstances for oak more favorable for growing north of their current distribution range.
Finnish pedunculate oak populations have been proven to tolerate winters in southern Finland, but it is unknown whether the most extreme winters are critical for their survival at higher latitudes. We therefore aimed to study the FHmax of different oak populations using different assessment methods (DTA, REL, visual damage scoring) at two sampling times in midwinter in central Finland. We hypothesized that deep-supercooling in oak set the limit for FHmax in the winter, and therefore for the cultivation of oaks in northern latitudes. However, within-population variation in FHmax may allow the selection of the most frost hardy genotypes for breeding and cultivation north of their current distribution range. We also hypothesized that there were differences in frost hardiness estimates depending on the assessment method due to their different premises.
2 Materials and methods
2.1 Material
The material consisted of four pedunculate oak populations from southern Finland. The origins were Lohja (60°14´N, 24°08´E), Parainen (60°14´N, 22°12´E), Ruissalo (60°26´N, 22°08´E), and Tenhola (60°03´N, 23°17´E). The acorns were collected from open-pollinated stands. In the spring of 1998, the acorns were sown in TA913 Styrofoam containers (pot volume 0.58 dm3, 22 pots in each container) with peat as the growing substrate and raised in the Nurmijärvi nursery (FinForelia Ltd., Röykkä, Finland) (60°50´N, 24°67´E, 100 m a.s.l.) for one growing season. There was a total of 56 containers, 14 containers for each population. In the nursery, the seedlings were cold-acclimated outside under snow cover until January 1999 and then moved to cold storage (–2 °C) in the Pieksämäki nursery. On February 5, the seedlings were moved to Joensuu (62°61´N, 29°74´E, 80 m a.s.l.), where they were divided into two groups and stored below a 20-cm thick snow cover in the botanical garden of the University of Eastern Finland.
The seedlings were transferred to the Biosphere Laboratory (University of Eastern Finland and Natural Resources Institute Finland) to assess frost hardiness on two occasions. Due to the empty pots (not germinated) or damage of the seedlings during transportation, the number of seedlings in the two groups differed (Table 1). The first transfer took place on February 12, 1999, and the second on March 10, 1999. In the lab, the seedlings were placed in two growth chambers (PGW36, Conviron Ltd., Winnipeg, MB, Canada) at –2 °C, and the frost hardiness tests started a few days after the transfer to the chamber. All the freezing tests of all the populations were completed in two weeks after the transfers to chamber conditions.
| Table 1. The number of pedunculate oak seedlings of four southern Finnish populations that were used to assess maximum frost hardiness in midwinter in February (Transfer 1) and in March (Transfer 2) 1999 in conditions in central Finland. | |||
| Population | February (Transfer 1) | March (Transfer 2) | Total |
| Lohja | 144 | 147 | 291 |
| Parainen | 123 | 142 | 265 |
| Ruissalo | 140 | 126 | 266 |
| Tenhola | 168 | 117 | 285 |
2.2 Differential thermal analysis (DTA) of the stem
Thirty seedlings of each population were measured at both transfer times. In one DTA run, 12 samples could be measured. The runs were therefore repeated 10 times during 10 consecutive days to complete the tests for all four populations. The DTA measurements were carried out using a custom-designed device consisting of four aluminum blocks, with three differentially measuring temperature channels in each block, i.e. 12 samples in one DTA run, and a blank as the reference in each block. The schematic drawing of the aluminum block has been shown previously (Räisänen et al. 2006b). The blocks were in a programmable freezing chamber (ARC 300/−55/+20, Arctest, Finland). The temperature difference between the sample pieces and the reference junction was measured at 15-s intervals with NiCr/Ni thermocouples (diameter 0.25 mm). For the test, a 15-mm-long sample was cut from the stem (one sample/seedling). The sample was split midway longitudinally in two halves. The thermocouple was inserted between the halves, wrapped with a piece of aluminum foil, and placed in the cavity of the aluminum block (three cavities, i.e. samples, per block). The temperature of each aluminum block was measured with a Pt-100 thermistor. The starting temperature in a DTA run was 5 °C. The rate of cooling to the target temperature of –50 °C was 5 °C h−1. Freezing events were detected as exotherms, i.e. a high temperature exotherm (HTE) for apoplastic freezing and an LTE for intracellular freezing. The temperature for the initiation and the peak of the exotherm was taken from the DTA curves. The initiation of the LTE was defined as the temperature at which an initial increase of the LTE was observed. Besides being used for the DTA, the remaining seedlings were used in the controlled freezing tests and FH assessments, using the relative electrolyte leakage test and visual damage scoring.
2.3 Relative electrolyte leakage test
Relative electrolyte leakage (REL) is a commonly used method for assessing the frost hardiness of plant organs (Wilner 1961; Burr et al. 2001; Luoranen et al. 2004; Strimbeck et al. 2008; Mayoral et al. 2015). It is based on leaching of electrolytes from the symplast to the apoplast, and further to the incubation distilled water solution, as a result of cell membrane injuries. By comparing the electrical conductivity measured in the samples exposed to different temperatures in the freezing test with the conductivity of the killed samples (assuming 100% injury), one can calculate an REL value for each temperature used in the test.
In this study, shoot cuttings with a length of 10 cm were taken for the REL test, or the whole shoot if the length was less than 10 cm. The shoots were placed in plastic bags for the freezing tests at –12 °C, –24 °C, –32 °C, –40 °C, –48 °C, –65 °C, and –90 °C, with 5 °C as the control. The tests started at 5 °C, and the rate of cooling was 5 °C h–1 until –40 °C. At low temperatures below –40 °C, the rate of cooling is less important than high temperatures for causing cellular injuries. Therefore, the rate of cooling at temperatures below –40 °C was 10 °C h–1. The target temperature was maintained for 4 h. The rate of warming was 5 °C h–1 (10 °C h–1 at temperatures below –40 °C) to the final temperature of 5 °C. The freezing treatments at temperatures higher than –50 °C were conducted in programmable freezing chambers (ARC 300/−55/+20, Arctest, Finland) and in a programmable N2-gas-cooled chamber (GCC-30, Carbolite, Chelmsford, UK) at temperatures lower than –50 °C.
After the freezing tests, three 10-mm samples of the stem were cut from each shoot. The samples were split longitudinally in half to facilitate electrolyte leakage from the middle of the sample. The samples were rinsed in deionized water and distributed among four test tubes for each temperature by population, for both chambers separately. Fifteen milliliters of deionized water were added to the tubes, and the tubes were shaken for 22 h before the first measurement of electrical conductivity (L1) (CDM92 Conductivity Meter, Radiometer, Denmark). The samples were then heat-killed at 92 °C for one hour and shaken for 22 h before the measurement of the second conductivity (L2). The relative electrolyte leakage (REL) was defined as
![]()
Frost hardiness was estimated by a non-linear regression as the inflection point (C) of the logistic sigmoid function fitted to the REL data of all populations for both chambers separately (Eq. 2) (Repo and Lappi 1989) (SPSS, IBM Co., New York, USA).
![]()
where y is the REL, and x is the exposure temperature. The parameters A and D define the asymptotes of the sigmoid curve, and the parameter B is the slope of the curve at the inflection point C. The first derivative of the fitted function (Eq. 3) was calculated for each population at both sampling times to indicate the damaging temperature range in the freezing tests.

2.4 Frost hardiness assessment by visual scoring
After the REL sampling, the rest of the stem was used for visual damage scoring by temperatures and populations for both chambers. Five pieces were cut from each stem (approximately 4 cm long), which were placed in petri dishes on wet gauze (2 dishes for each temperature and chamber). The dishes were placed in a cell culture room for one week with a long day at a photon flux density of 100 µmol m–2 s–1 and a temperature of 22 °C. Visual damage scoring of buds, phloem, and xylem (wood) took place after one week. The buds were scored as undamaged (0) or damaged/dead (1), and the damage index for each stem was calculated as the proportion of damaged buds of all buds in the sample. The phloem and xylem were scored as alive (0) if no or a slight color change was found, and dead (1) if the phloem and xylem were seriously damaged and dark brown. For the assessment of the FH of each plant part and tissue, the mean damage was calculated by treatment temperatures for each population, and the frost hardiness (LT50) was then taken by linear interpolation as the temperature on the x-axis, where the damage line reached level 0.5 on the y-axis.
2.5 Statistical analyses
To analyze the initiation and peak of the LTE, the data of two growth chambers (–2 °C) were pooled, and the populations and transfer times were tested with Univariate Analysis of Variance (Bonferroni) (IBM SPSS Statistics 27.0. software, IBM, Armonk, NY, USA). In the analyses of the REL data, the means and their 95% confidence intervals of two chambers were calculated by nonlinear regression, and the difference between the populations was determined according to the overlap of the confidence intervals.
3 Results
3.1 Differential thermal analysis of stem
The LTE was observed in 88% of the tested samples. There were no significant differences among the populations in the initiation or peak of the LTE at either the first or second transfer times (Table 2). There were no differences between the transfer times either. Among the populations, the mean initiation of the LTE ranged from –40.8 °C to –41.9 °C, and for the peak, from –42.9 °C to –44.4 °C. However, the variation in the initiation and peak of the LTE within the populations was quite high (Fig. 1, Table 2). In the first transfer, the initiation of the LTE ranged at most from –36.8 °C to –44.8 °C for the Lohja population, and in the second transfer, from –34.6 °C to –43.7 °C for the Parainen population (Table 2). Correspondingly, the variation in the peak of the LTE ranged at most from –39.0 °C to –45.9 °C in the first transfer, and from –37.1 °C to –46.3 °C in the second transfer for the populations of Lohja and Parainen respectively (Table 2). The difference between the mean initiation and mean peak of LTE ranged between 2 and 3 °C. The HTE was observed between –5.8 °C and –6.2 °C in the first transfer, and between –6.5 °C and –6.9 °C in the second transfer, without differences between the populations (data not shown).
| Table 2. Descriptive statistics for the initiation and peak of the low temperature exotherm (LTE) of four Finnish pedunculate oak populations assessed by differential thermal analysis. The seedlings were transferred from outside to the growth chamber at –2 °C in February 1999 (Transfer 1) and March 1999 (Transfer 2) before the start of the freezing tests. The mean value of each population is in bold. The significances of the differences (P-value) among the populations and transfer times are given in the lower panel. | |||||
| Transfer | Item | Initiation of LTE, °C | |||
| Lohja | Parainen | Ruissalo | Tenhola | ||
| 1 | Mean | -40.8 | -41.9 | -40.7 | -40.8 |
| Minimum | -44.8 | -44.7 | -44.9 | -43.8 | |
| Maximum | -36.8 | -39.0 | -37.1 | -37.3 | |
| Median | -40.9 | -42.3 | -40.8 | -41.2 | |
| Std. deviation | 2.2 | 1.6 | 2.1 | 1.7 | |
| 2 | Mean | -41.0 | -40.8 | -41.2 | -40.9 |
| Minimum | -45.5 | -43.7 | -44.6 | -44.0 | |
| Maximum | -37.9 | -34.6 | -36.4 | -36.8 | |
| Median | -40.7 | -41.1 | -41.3 | -41.4 | |
| Std. deviation | 1.7 | 2.4 | 2.0 | 1.6 | |
| Peak of LTE, °C | |||||
| 1 | Mean | -43.2 | -44.4 | -43.4 | -43.2 |
| Minimum | -45.9 | -46.7 | -45.5 | -45.4 | |
| Maximum | -39.0 | -41.9 | -39.8 | -39.2 | |
| Median | -43.6 | -44.7 | -43.7 | -43.7 | |
| Std. deviation | 1.9 | 1.4 | 1.8 | 1.8 | |
| 2 | Mean | -42.9 | -43.0 | -43.6 | -43.1 |
| Minimum | -46.9 | -46.3 | -46.5 | -45.7 | |
| Maximum | -40.0 | -37.1 | -40.3 | -38.2 | |
| Median | -42.8 | -43.4 | -44.0 | -43.5 | |
| Std. deviation | 1.7 | 2.3 | 1.8 | 1.7 | |
| P-value | |||||
| Source of variation | Initiation of LTE | Peak of LTE | |||
| Population (P) | 0.903 | 0.618 | |||
| Transfer (T) | 0.964 | 0.293 | |||
| P × T | 0.538 | 0.483 | |||
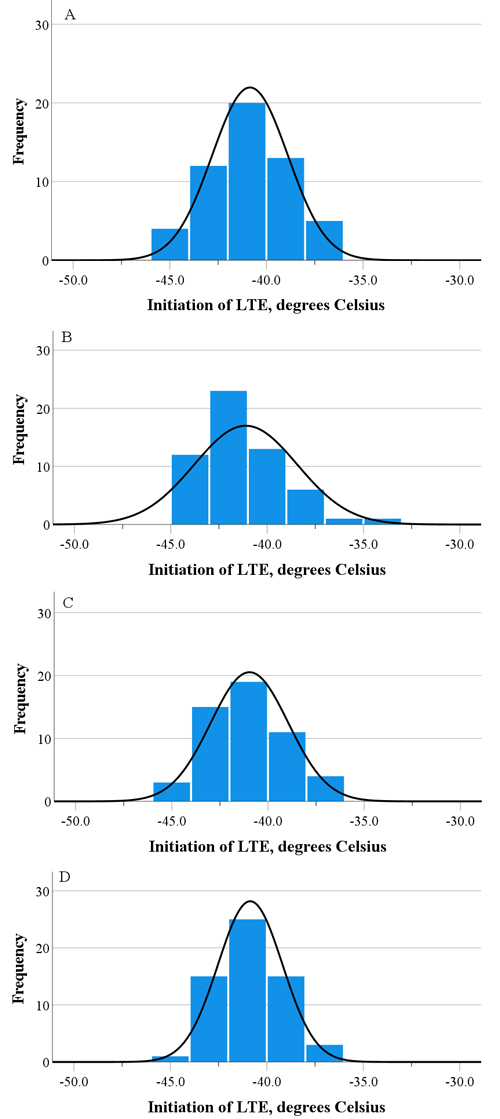
Fig. 1. The distribution of the LTE initiation assessed by differential thermal analysis for four Finnish pedunculate oak populations, i.e. Lohja (A), Parainen (B), Ruissalo (C), and Tenhola (D), according to the pooled data of two transfer times in February and March.
3.2 Relative electrolyte leakage test
According to the REL test, the FH of the stem was lower in March (Transfer 2) than in February (Transfer 1) in all populations (Table 3), but there were no differences between the populations at either transfer time. In February, the lowest and highest FH ranged from –44.0 °C to –46.6 °C for the Lohja and Parainen populations, and in March, from –40.6 °C to –41.6 °C for the Ruissalo and Lohja populations respectively.
| Table 3. The mean parameter estimates and their confidence intervals of the logistic sigmoid function (Eq. 2) fitted the data of the relative electrolyte leakage of stems of four Finnish populations of pedunculate oak seedlings that were tested for frost hardiness in February 1999 (Transfer 1) and March 1999 (Transfer 2). The values are the means of the two chambers. The frost hardiness as the inflection point of the fitted function and its 95% confidence intervals are in bold. | ||||||
| Origin | Transfer | Parameter | Parameter estimate | 95% confidence interval | R2 | |
| Lower | Upper | |||||
| Lohja | 1 | A | 0.51 | 0.47 | 0.55 | 0.93 |
| 1 | B | -0.24 | -0.32 | -0.17 | ||
| 1 | C | -44.0 | -45.5 | -42.5 | ||
| 1 | D | 0.35 | 0.32 | 0.37 | ||
| 2 | A | 0.45 | 0.41 | 0.49 | 0.94 | |
| 2 | B | -0.15 | -0.19 | -0.11 | ||
| 2 | C | -41.6 | -43.5 | -39.7 | ||
| 2 | D | 0.30 | 0.27 | 0.32 | ||
| Parainen | 1 | A | 0.56 | 0.51 | 0.61 | 0.91 |
| 1 | B | -0.25 | -0.35 | -0.15 | ||
| 1 | C | -46.6 | -48.2 | -45.0 | ||
| 1 | D | 0.34 | 0.31 | 0.37 | ||
| 2 | A | 0.45 | 0.43 | 0.47 | 0.97 | |
| 2 | B | -0.24 | -0.28 | -0.19 | ||
| 2 | C | -41.1 | -42.0 | -40.2 | ||
| 2 | D | 0.32 | 0.31 | 0.34 | ||
| Ruissalo | 1 | A | 0.55 | 0.49 | 0.60 | 0.89 |
| 1 | B | -0.24 | -0.34 | -0.15 | ||
| 1 | C | -45.0 | -46.8 | -43.1 | ||
| 1 | D | 0.39 | 0.36 | 0.43 | ||
| 2 | A | 0.50 | 0.46 | 0.53 | 0.96 | |
| 2 | B | -0.16 | -0.19 | -0.12 | ||
| 2 | C | -40.6 | -42.0 | -39.2 | ||
| 2 | D | 0.29 | 0.27 | 0.31 | ||
| Tenhola | 1 | A | 0.54 | 0.48 | 0.60 | 0.88 |
| 1 | B | -0.23 | -0.35 | -0.12 | ||
| 1 | C | -46.4 | -48.5 | -44.4 | ||
| 1 | D | 0.35 | 0.31 | 0.38 | ||
| 2 | A | 0.48 | 0.46 | 0.50 | 0.98 | |
| 2 | B | -0.19 | -0.22 | -0.16 | ||
| 2 | C | -41.2 | -42.2 | -40.3 | ||
| 2 | D | 0.30 | 0.29 | 0.32 | ||
The temperatures which caused electrolyte leakage and thus cellular damage accordingly, in stems during the controlled freezing treatments ranged from –20 oC (incipient damage) to –70 °C (total damage) at both transfer times in populations other than Parainen, in which the range was somewhat narrower (Fig. 2). In February, the LTEpeak occurred at higher temperatures, and in March, at lower temperatures, than the derivative maximum of the REL curve, even though the mean LTEpeak between the transfer times did not change.
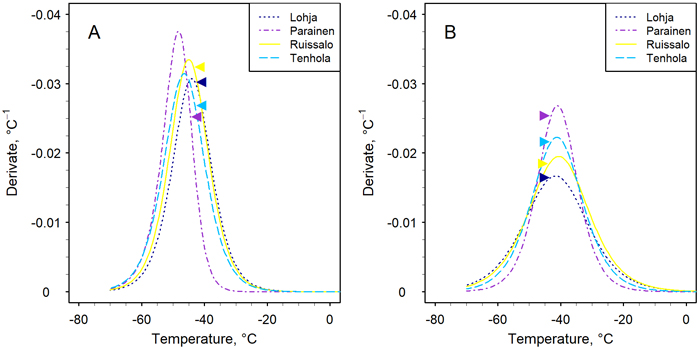
Fig. 2. The first derivative (Eq. 3) of the sigmoid function (Eq. 2) fitted the data of the relative leakage method to assess the frost hardiness of the stems of four Finnish pedunculate oak populations. The assessment took place on two occasions in midwinter in February (A) and March (B). The position of the peak indicates the frost hardiness, i.e. parameter C in Eq. 2 (Table 3). The arrows indicate the location of the mean LTEpeak on the curve of each population (see Table 2).
3.3 Frost hardiness assessment by visual scoring
The bud tended to be the least frost hardy organ, especially in the first transfer in February, with the exception of the Ruissalo population in March (Table 4). In the first transfer, the FH of buds ranged from –19 °C to –27 °C for Tenhola and Lohja, and in the second transfer from –27 °C to –33 °C for the Parainen and Tenhola populations respectively. The FH of phloem and xylem ranged from –30 °C to –43 °C in the first transfer, and from –31 °C to –38 °C in the second. In the second transfer, the temperature response curve of the damage index of phloem for the Lohja population was irregular, which resulted in exceptionally high FH.
| Table 4. Frost hardiness (LT50) of buds, and of phloem and xylem, of the stems of four Finnish pedunculate oak populations as assessed by controlled freezing tests and visual damage scoring in midwinter in February (Transfer 1) and March (Transfer 2). | |||||
| Transfer | Item | LT50, °C | |||
| Lohja | Parainen | Ruissalo | Tenhola | ||
| 1 | Bud | -27 | -20 | -22 | -19 |
| Phloem | -34 | -40 | -27 | -33 | |
| Xylem | -43 | -35 | -30 | -39 | |
| 2 | Bud | -29 | -27 | -33 | -33 |
| Phloem | -58 | -34 | -33 | -38 | |
| Xylem | -32 | -33 | -31 | -34 | |
4 Discussion
The maximum frost hardiness of the stems of four Finnish pedunculate oak populations, assessed by differential thermal analysis and electrolyte leakage methods, was an average of some degrees below –40 °C. In the coldest winters, such temperatures may occasionally occur in central Finland, and they are quite common in northern Finland. Oaks may therefore have a high risk of being damaged in accordance with our hypothesis. In a field study with partly the same ecotypes as in this study, there were differences in survival and growth between ecotypes, which suggests that there were also differences in FH among the populations of this study (Hautsalo et al. 2015). However, this was not the case for the FHmax, as assessed by either the LTE or REL method. In accordance with our second hypothesis, we found a high variation in the LTE within populations, offering potential for breeders to use the most frost hardy genotypes for cultivation north of their current distribution. Variation in the marginal populations of oaks has also been noted using genetical markers (Vakkari et al. 2006; Pohjanmies et al. 2016).
No change was found in the mean LTE, but the FH as assessed by the REL test decreased in all populations between the transfer in February and March, in accordance with our hypothesis. This indicates, first, that the methods had a different physiological bases, and second, that the FH assessed with the LTE was stabler than the FH using the REL method with regard to the change in environmental conditions (Ketchie and Kammereck 1987; Wu et al. 2020). This was observed here as the change in the position of the LTE on the derivative curves of the REL method between two assessment times. The oak stem had only one LTE, as opposed to the multiple exotherms in another species, e.g. apple stems (Malus domestica Borkh.), with deep supercooling at low temperatures too (George et al. 1982; Ketchie and Kammereck 1987). In oak, the LTE changed with frost hardening (Repo et al. 2008, 2021), and according to current results, reached the minimum on average at some degrees below –40 °C. The observed LTEs are within the range of the homogeneous nucleation temperature of pure water, which is further decreased by some degrees by colligative substances in the cells (George et al. 1974; Sakai and Larcher 1987). In apple stems, only the lowest temperature exotherm was stable, ranging between –35 °C and –40 °C for most of the year, whereas an intermediate exotherm connected with the ice nucleation of xylem water showed strong seasonal variation (Ketchie and Kammereck 1987).
In contrast with the LTE, the REL method for the stem gains an integrated measure of change in cell membrane properties in different cell layers (phloem and xylem) with cold acclimation and/or frost damage. As observed here, the increased electrolyte leakage therefore takes place at a wider temperature range than observed for the LTE. In the controlled freezing tests, a wider range of increased REL by decreased exposure temperatures in cold-acclimated plant than plants that have not been cold-acclimated has also been found in several other studies (Strimbeck et al. 2008; Mayoral et al. 2015; Repo et al. 2021). We may assume that the decrease in the FH assessed by the REL method between transfers 1 and 2 is due to the change in the FH of phloem and xylem as a consequence of an increased temperature under the snow cover between February and March. Similar chamber conditions during the short-term maintenance before the start of the freezing tests at both transfer times seemed not to return the FH to the same level. It is probable that the FH of phloem and xylem is based on the dehydration tolerance of cells instead of deep supercooling, which is the survival mechanism of xylem ray parenchyma cells (Levitt 1972; Sakai and Larcher 1987).
In contrast with the DTA and REL results, the visual damage scoring of buds and stems indicated some differences in the FH between populations. In accordance with a previous study (Wu et al. 2019), VD resulted in lower frost hardiness than with the LTE and REL methods. This refers to the more rapid response of the FH of buds than the stem to the changes in environmental temperature (Räisänen et al. 2006a). The FH estimate by VD was affected by the high variation in the visual damage scores, which is based on tissue color change, even between the samples within the same temperature. This appeared e.g. in the FH estimate of the Lohja population at the second transfer time, where the linear interpolation resulted in an exceptionally high FH for phloem, which was due to the irregularity of the line for the damage index. In spite of the inaccuracies in visual damage scoring, the results indicated that the buds were less frost hardy than the stems. However, damage to buds may not kill the plant, but lead to growth losses and increased branching of the canopy, which may decrease the competitive strength of oak in relation to native tree species.
Phloem and xylem cells in the stem seemed to have a potential to reach a frost hardiness of several degrees below –40 °C by dehydration. This may enable those cell layers to tolerate the occasional extreme temperatures in central Finland (https://en.ilmatieteenlaitos.fi/download-observations). However, the short growing season in northern Finland may have adverse effects on the maturation of these cell layers at the end of the growing season. This may decrease their frost hardiness, thus increasing the damage risks, and potentially decrease the survival and growth of oaks in the coldest winters.
Despite the potential hardening capacity of phloem and xylem tissues to tolerate low winter temperatures, the deep supercooling of the xylem ray parenchyma cells of oak seems to set an ultimate limit for frost hardiness. The initiation of ice nucleation in those cells was found on average to be –41 °C, and nucleation peaked, i.e. the cell nucleation frequency of individual cells was highest (George and Burke 1977), at temperatures between –43 °C and –44 °C. According to 60-year records, the daily minimum temperatures in Jokioinen (60°49´N, 23°30´E), located close to the natural northern distribution range of pedunculate oak, was –39.3 °C (https://en.ilmatieteenlaitos.fi/download-observations). According to the same data set, the minimum temperature in Joensuu (i.e. the site of this study, 62°61´N, 29°74´E), was –39.0 °C, and in some more northerly locations of Kajaani (64°17´N, 25°41´E) and Rovaniemi (66°35´N, 26°01´E) –42.9 °C and –47.5 °C respectively. These minimum temperatures are close to or lower than the LTE measured in this study, and therefore would potentially cause damage in oaks.
Our results showed high variation in the LTE within the populations. This offers potential for breeders to identify the most frost hardy genotypes to be used for cultivation in areas north of the current distribution range, and to optimize the suitability and use of different seed origins (i.e. genotypes) for commercial and ecological forest management (Hautsalo et al., 2015). In private gardens, some oaks grow even in Lapland, 7° north of their natural distribution, which is also an indication of high within-population variation in FH (Talvensaari 2020). It is possible that as a result of the predicted climate change, winters will be milder in future. In that event, the maximum frost hardiness will not be a limiting factor for the northward distribution of pedunculate oak.
Authors’ contributions
Conceptualization (TR, PP), methodology (TR, VV), measurements (VV), data curation (VV, TR), original draft preparation (TR, VV), writing (TR, PP).
Availability of data and material
On request from the corresponding author.
Funding
The Natural Resources Institute Finland (Luke) (projects 41007-00004000 and 41007-00112100) and the Academy of Finland (decision No. 52517).
Acknowledgments
We thank Nurmijärvi nursery (FinForelia Ltd.) for providing the seedlings for this study, Sirkku Pöykkö and Aulis Leppänen for their technical assistance.
References
Blackwell T (2004) Some hints for identifying wood in the field. Field Mycol 5: 17–21. https://doi.org/10.1016/S1468-1641(10)60234-4.
Burr K, Hawkins C, L´Hirondelle S, Binder W, George M, Repo T (2001) Methods for Measuring Cold Hardiness of Conifers. In: Bigras FJ, Colombo SJ (eds) Conifer cold hardiness, Ch. 14. Kluwer Academic Publishers, Dordrecht, The Netherlands, pp 369–401. https://doi.org/10.1007/978-94-015-9650-3_14.
Ferris C, King RA, Väinölä R, Hewitt GT (1998) Chloroplast DNA recognizes three refugial sources of European oaks and suggests independent eastern and western immigrations to Finland. Hered 80: 584–593. https://doi.org/10.1046/j.1365-2540.1998.00342.x.
George M, Burke M (1977) Cold hardiness and deep supercooling in xylem of shagbark hickory. Plant Physiol 59: 319–325. https://doi.org/10.1104/pp.59.2.319.
George M, Burke M, Weiser C (1974) Supercooling in overwintering azalea flower buds. Plant Physiol 54: 29–35. https://doi.org/10.1104/pp.54.1.29.
George M, Becwar M, Burke M (1982) Freezing avoidance by deep undercooling of tissue water in winter-hardy plants. Cryobiol 19: 628–639. https://doi.org/10.1016/0011-2240(82)90192-4.
Hämet-Ahti L, Palmén A, Alanko P, Tigerstedt PMA, Koistinen M (1992) Woody flora of Finland. Public Finn Dendrol Soc 6: 1–373.
Hautsalo J, Mathieu P, Elshibli S, Vakkari P, Raisio J, Pulkkinen P (2015) Variation in height and survival among northern populations of pedunculate oak (Quercus robur L.): results of a 13-year field study. Silva Fenn 49, articleid 1274. https://doi.org/10.14214/sf.1274.
Jensen JS, Deans JD (2004) Late autumn frost resistance of twelve North European provenances of Quercus species. Scand J For Res 19: 390–399. https://doi.org/10.1080/02827580410019391.
Ketchie D, Kammerech R (1987) Seasonal variation of cold resistance in Malus woody tissue as determined by differential thermal analysis and viability tests. Can J Bot 65: 2640–2645. https://doi.org/10.1139/b87-355.
Levitt J (1972) Responses of plants to environmental stresses. Academic Press, New York.
Luoranen J, Repo T, Lappi J (2004) Assessment of the frost hardiness of shoots of silver birch (Betula pendula) seedlings with and without controlled exposure to freezing. Can J For Res 34: 1108–1118. https://doi.org/10.1139/x03-285.
Mayoral C, Strimbeck R, Sanchez-Gonzalez M, Calama R, Pardos M (2015) Dynamics of frost tolerance during regeneration in a mixed (pine-oak-juniper) Mediterranean forest. Trees 29: 1893–1906. https://doi.org/10.1007/s00468-015-1270-8.
Pohjanmies T, Elshibli S, Pulkkinen P, Vakkari P, Korpelainen H, Roslin T (2016) Fragmentation-related patterns of genetic differentiation in pedunculate oak (Quercus robur) at two hierarchical scales. Silva Fenn 50, article id1510. https://doi.org/10.14214/sf.1510.
Räisänen M, Repo T, Lehto T (2006a) Effect of thawing time, cooling rate and boron nutrition on freezing point of the primordial shoot in Norway spruce buds. Ann Bot 97: 593–599. https://doi.org/10.1093/aob/mcl008.
Räisänen M, Repo T, Rikala R, Lehto T (2006b) Does ice crystal formation in buds explain growth disturbances in boron-deficient Norway spruce? Trees 20: 441–448. https://doi.org/10.1007/s00468-006-0059-1.
Rajashekar C, Burke MJ (1978) The occurrence of deep undercooling in the genera Pyrus, Prunus and Rosa: a preliminary report. In: Li PH, Sakai A (eds) Plant cold hardiness and freezing stress, vol. 1. Academic Press, New York, pp 213–225. https://doi.org/10.1016/B978-0-12-447650-9.50019-8.
Repo T, Lappi J (1989) Estimation of standard error of impedance-estimated frost resistance. Scand J For Res 4: 67–74. https://doi.org/10.1080/02827588909382547.
Repo T, Mononen K, Alvila L, Pakkanen TT, Hänninen H (2008) Cold acclimation of pedunculate oak (Quercus robur L.) at its northernmost distribution range. Env Exp Bot 63: 59–70. https://doi.org/10.1016/j.envexpbot.2007.10.023.
Repo T, Wu D, Hänninen H (2021) Autumn cold acclimation of shoots does not explain the northern distribution limit of three southern exotic tree species in Finland. Env Exp Bot 188, article id 104526. https://doi.org/10.1016/j.envexpbot.2021.104526.
Sakai A, Larcher W (1987) Frost survival of plants: responses and adaptation to freezing conditions. Springer, Berlin Heidelberg New York. https://doi.org/10.1007/978-3-642-71745-1.
Strimbeck GR, Kjellsen TD, Schaberg PG, Murakami PF (2008) Dynamics of low-temperature acclimation in temperate and boreal conifer foliage in a mild winter climate. Tree Phys 28: 1365–1374. https://doi.org/10.1093/treephys/28.9.1365.
Talvensaari L (2020) Rovaniemen Juurakkotiellä Suomen pohjoisimmat tammet? Lapin Kansa 9 Oct 2020. [The northernmost oaks at Juurakkotie in Rovaniemi, Finland]. https://www.lapinkansa.fi/rovaniemen-juurakkotiella-suomen-pohjoisimmat-tamm/2978662.
Vakkari P, Blom A, Rusanen M, Raisio J, Toivonen H (2006) Genetic variability of fragmented stands of pedunculate oak (Quercus robur) in Finland. Genet 127: 231–241. https://doi.org/10.1007/s10709-005-4014-7.
Wilner J (1961) Relationship between certain methods and procedures of testing for winter injury of outdoor exposed shoots and roots of apple trees. Can J Plant Sci 41: 309–315. https://doi.org/10.4141/cjps61-042.
Wu D, Kukkonen S, Luoranen J, Pulkkinen P, Heinonen J, Pappinen A, Repo T (2019) Influence of late autumn preconditioning temperature on frost hardiness of apple, blueberry and blackcurrant saplings. Sci Hort 258, article id 108755. https://doi.org/10.1016/j.scienta.2019.108755.
Wu D, Palonen P, Lettojärvi I, Finni S, Haikonen T, Luoranen J, Repo T (2020) Rehardening capacity in the shoots and buds of three European pear (Pyrus communis [L.]) cultivars following a warm spell in midwinter. Sci Hort 273, article id 109638. https://doi.org/10.1016/j.scienta.2020.109638.
Zanetto A, Roussel G, Kremer A (1994) Geographic variation of interspecific differentiation between Quercus robur L. and Quercus petraea (Matt.) Liebl. For Genet 1: 111–113.
Total of 28 references.
Send to email
