Anna Hebda  ,
Błażej Wójkiewicz,
Witold Wachowiak
,
Błażej Wójkiewicz,
Witold Wachowiak
Genetic characteristics of Scots pine in Poland and reference populations based on nuclear and chloroplast microsatellite markers
Hebda A., Wójkiewicz B., Wachowiak W. (2017). Genetic characteristics of Scots pine in Poland and reference populations based on nuclear and chloroplast microsatellite markers. Silva Fennica vol. 51 no. 2 article id 1721. https://doi.org/10.14214/sf.1721
Highlights
- Similar genetic variation was found between Polish Scots pine populations from a wide variety of habitats based on nSSR and cpSSR markers
- Homogeneity was observed in the genetic structures of Polish and Finnish populations from the continuous pine range
- Genetic differentiation in microsatellite markers was identified only when populations from the central pine distribution were compared to the marginal stands.
Abstract
Polymorphisms at a set of eighteen nuclear (nSSR) and chloroplast (cpSSR) microsatellite loci were investigated in sixteen populations of Scots pine (Pinus sylvestris L.) derived from the provenance trial experiment and representative of the species distribution range and climatic zones in Poland. The patterns of genetic variation were compared to the reference samples from the species distribution in Europe and Asia. A similar level of genetic variation and no evidence of population structure was found among the Polish stands. They showed genetic similarity and homogenous patterns of allelic frequency spectra compared to the Northern European populations. Those populations were genetically divergent compared to the marginal populations from Turkey, Spain and Scotland. The population structure patterns reflect the phylogeography of the species and the divergence of populations that most likely do not share recent history. As the analysed provenance trial populations from Poland are diverged in phenotypic traits but are genetically similar, they could be used to test for selection at genomic regions that influence variation in quantitative traits.
Keywords
Pinus sylvestris;
phylogeography;
conifers;
genetic divergence;
population structure;
microsatellite markers;
neutral variation
-
Hebda,
University of Agriculture in Krakow, Faculty of Forestry, Institute of Forest Ecology and Silviculture, Department of Genetics and Forest Tree Breeding, 29 Listopada 46, 31-425 Kraków, Poland
 http://orcid.org/0000-0002-3149-8644
E-mail
ana.hebda@gmail.com
http://orcid.org/0000-0002-3149-8644
E-mail
ana.hebda@gmail.com
- Wójkiewicz, Institute of Dendrology, Polish Academy of Sciences, Parkowa 5, 62-035 Kórnik, Poland E-mail bwojkiew@man.poznan.pl
- Wachowiak, Institute of Dendrology, Polish Academy of Sciences, Parkowa 5, 62-035 Kórnik, Poland; Institute of Environmental Biology, Faculty of Biology, Adam Mickiewicz University, Umultowska 89, 61-614 Poznań, Poland E-mail witoldw@man.poznan.pl
Received 28 October 2016 Accepted 3 April 2017 Published 21 April 2017
Views 198032
Available at https://doi.org/10.14214/sf.1721 | Download PDF

Supplementary Files
1 Introduction
Scots pine (Pinus sylvestris L.) is a species of great ecological, social and economic importance that covers large parts of Europe and Asia. It is found in a range of environments from the mountain areas of Spain, Turkey and the Scottish Highlands to the subarctic forests of northern Scandinavia and Siberia (Jaworski 2011). Across its wide distribution range, Scots pine exhibits high phenotypic variation (Eriksson 2008; Giertych 1993) that was established in response to selection and adaptation to local environmental conditions. Those mechanisms affect the species ability to succeed in changing environmental conditions (Savolainen et al. 2007). Adaptive variation has a strong genetic component, as shown in the Scots pine common garden and provenance trial experiments (Alía et al. 2001; Oleksyn et al. 1998; Savolainen et al. 2004). However, less is known about the underlying patterns of genetic variation in Scots pine determined by evolutionary and population history processes.
The present distribution of Scots pine in Europe is the result of survival, range shifts and postglacial recolonization events. There are several known areas including the Iberian Peninsula, Italy and the Balkans, where Scots pine survived the Last Glacial Maximum (LGM) (Cheddadi et al. 2006; Naydenov et al. 2007; Pyhäjärvi et al. 2008; Sinclair et al. 1999). According to the other genetic and microfossil data, the refugial areas are located in the Alps (Cheddadi et al. 2006) and the region of Moscow, potentially also on the southern slopes of the Carpathians (Müller et al. 2003; Willis and Van Andel 2004). However, the spatial distribution of maternally inherited, haploid, mitochondrial DNA markers indicates that isolated populations from the Iberian Peninsula, the Apennine Peninsula and Anatolia did not participate in recolonization of the areas of Scots pine continuous distribution in North and Central Europe (Cheddadi et al. 2006; Pyhäjärvi et al. 2008).
Climate conditions in refugial areas enabled the survival of the populations which became a source of genetic variability during and after LGM (Petit et al. 2003). Populations from a broad pine distribution showed a high level of genetic variation and a low level of among-population genetic differentiation (Belletti et al. 2012; Prus-Glowacki et al. 2003; Pyhäjärvi et al. 2007; Wachowiak et al. 2014; Wang et al. 1991). This low genetic structure in a wide distribution of Scots pine is typical for geographically core populations and among others, it results from high outcrossing and random mating in pines (Petit and Hampe 2006). According to the “centre-periphery hypothesis” the marginal populations are expected to be less genetically diverse and more prone to extinction (Hampe and Petit 2005). However, the recolonization routes and admixture patterns of Scots pine populations of different origins, which impact the genetic diversity, are not well characterized. This is particularly true for populations from Central Europe, including Poland, where Scots pine is continuously distributed in the lowlands and forms some dispersed populations in the Carpathian and Sudeten Mountains.
Many years of provenance experiments showed that the pine populations inhabiting northern Poland and the neighbouring Baltic countries are characterized by very good growth and adaptive ability (Barzdajn et al. 2016; Giertych 1979; Szeligowski et al. 2016). The lowland populations in Poland show a smaller percentage of deadwood, better growth parameters and a greater volume and growing stock compared to highland pines (Sabor 1993). The influence of terrain is visible in morphological and physiological differentiation (Staszkiewicz 1961) and variability in wood quality traits (Niedzielska et al. 2001), particularly in populations from the Carpathians and the Sudetes. However, the genetic relationships between the phenotypically divergent populations used in the progeny trial experiments are not well resolved.
In this research, the genetic variation of Scots pine populations in the Polish distribution range of the species was assessed based on the polymorphism at a set of nuclear (nSSRs) (Simple Sequences Repeats) and chloroplast (cpSSRs) microsatellite loci. We checked whether P. sylvestris populations from different climatic regions in Poland are significantly different in genetic structure, as they are diverged at phenotypic traits. Furthermore, we looked at the genetic relationships at the same set of loci between Polish populations and the reference populations of the species from the continuous distribution represented by populations from Finland and the marginal distributions in Europe and Asia represented by populations from Scotland, Spain and Turkey.
2 Material and methods
2.1 Sampling and DNA extraction
Sixteen populations of Scots pine (384 individuals) derived from a provenance trial in the Carpathian Mountains were used in the study. The experimental plot was established in 1966 with provenances from the Polish distribution range of Scots pine, including climatic and seed zones (Table 1, Fig. 1). The populations were characterized based on phenotypic variability of qualitative and quantitative traits in a previous experiment (Hebda et al. 2017). The sampled populations include the races of lowland pines (e.g., from Supraśl, Bolewice and Spała) that show very good growth and productivity (Barzdajn et al. 2016; Oleksyn and Rachwał 1994; Szeligowski et al. 2016). Additionally, we examined populations from the foothills and mountain regions determined as local populations that displayed a weak breeding value (Barzdajn 2006; Hebda et al. 2017). Samples were collected from 24 randomly selected individuals from each population. Furthermore, reference populations of Scots pine from Finland, Scotland, Spain and Turkey (Table 1, Fig. 1) represented by about 30–50 samples each (Table 4 and in Table 5) were used in the study. Genomic DNA of each individual was extracted from needles following standard CTAB procedures.
| Table 1. Geographical locations of Pinus sylvestris populations studied using nuclear and chloroplast microsatellites markers. Native populations are from Poland (PL) divided for three climatic regions: I– Central Poland, II– North Poland, III– South Poland while reference populations are from Finland (F), Turkey (T), Spain (Sp), Scotland (S). Populations from Turkey, Spain and Scotland represent marginal populations, while other samples are from the central pine distribution area. | ||||
| Code | Provenance name | Latitude, Longitude | Altitude | Region |
| PL1 | Karsko | 52°54´N, 15°15´E | 75 | I |
| PL2 | Tabórz | 53°52´N, 19°55´E | 110 | II |
| PL3 | Dłużek | 53°31´N, 20°38´E | 145 | II |
| PL4 | Ruciane | 53°37´N, 21°35´E | 145 | II |
| PL5 | Rozpuda | 53°55´N, 22°55´E | 205 | II |
| PL6 | Supraśl | 53°15´N, 23°20´E | 165 | II |
| PL7 | Starzyna | 52°38´N, 23°37´E | 170 | II |
| PL8 | Gubin | 51°55´N, 14°50´E | 70 | I |
| PL9 | Rychtal | 51°12´N, 17°50´E | 190 | I |
| PL10 | Bolewice | 52°23´N, 16°10´E | 90 | I |
| PL11 | Lipowa | 53°44´N, 18°15´E | 130 | II |
| PL12 | Jegiel | 52°40´N, 21°40´E | 95 | II |
| PL13 | Spała | 51°35´N, 20°15´E | 150 | I |
| PL14 | Janów Lubelski | 50°40´N, 22°25´E | 250 | I |
| PL15 | Nowy Targ | 49°20´N, 20°20´E | 590 | III |
| PL16 | Piwniczna | 49°20´N, 20°17´E | 500 | III |
| F17 | Finland_Joutsa | 61°74´N, 26°14´E | 125 | IV |
| F18 | Finland_Kielajoki | 69°65´N, 29°07´E | 100 | |
| T19 | Turkey_Çatacık | 39°96´N, 31°11´E | 1619 | V |
| T20 | Turkey_Bayabat-Sinop | 41°64´N, 34°83´E | 1228 | |
| Sp21 | Spain_Sierra de Neila | 42°05´N, 03°01´W | 1400 | VI |
| Sp22 | Spain_Puerto de Navafría | 40°98´N, 03°81´W | 1800 | |
| S23 | Scotland | 57°30´N, 05°38´W | 81 | VII |
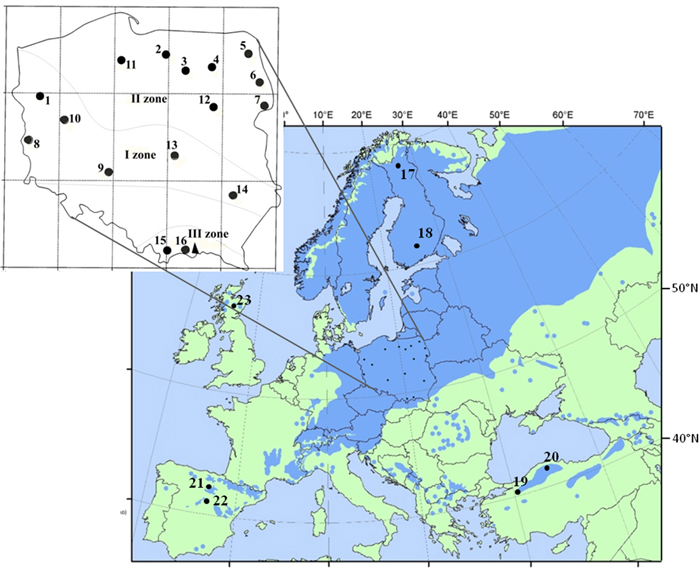
Fig. 1. Location of 16 Polish provenances of Scots pine derived from three climatic zones and reference populations of the species distribution range in Europe and Asia. Population acronyms are as in Table 1.
2.2 Microsatellite genotyping and analysis
All trees were genotyped using eighteen microsatellite loci, including the following nuclear SSRs: psyl42, psyl25, psyl18, psyl44, psyl57, psyl36 (Sebastiani et al. 2012), PtTX3025 (Elsik et al. 2000), PtTX4011, PtTX4001 (Zhou et al. 2002), Spac11.4 (Soranzo et al. 1998), and the following chloroplast SSR loci: PCP36567, PCP30277, PCP102652, PCP26106, PCP87314, PCP45071, PCP1289, and PCP41131 (Provan et al. 1998). PCR (Polymerase Chain Reaction) amplifications were performed with a final volume of 10 μl containing 10 mM of each dNTP, 5 μM each of forward and reverse primers, 0.15 U Taq DNA polymerase, 1x BSA, 1.5 μM MgCl2 and 1x PCR buffer. Amplification was performed using the following protocol: 95 °C for 5 min, followed by 28 cycles of 30 sec at 94 °C, 1.30 min at 60 °C, 1.30 min at 72 °C, with a final extension step of 10 min at 72 °C. The fluorescently labeled PCR products, along with a size standard (GeneSan 600 LIZ), were separated on the Applied Biosystems 3500 (Life Technologies, USA) automatic sequencer. The allele were identified using GeneMapper software ver. 5.0 (Life Technologies, USA).
2.3 Data analysis
The genetic diversity of Polish stands was analysed for individual populations and populations grouped into three climatic regions, including locations in the central (I), northern (II), and southern (III) parts of the country (Table 1, Fig. 1). The differentiation in Polish populations was compared to reference pines from the continuous (Finland) and marginal (Turkey, Spain, Scotland) species distributions. Basic genetic parameters and departure from Hardy-Weinberg equilibrium (HWE) in each population were calculated using GenAlEx 6.5 (Peakall and Smouse 2012) and Haplotype Analysis 1.05 software (Eliades and Eliades 2009). In addition, the latent genetic potential (LGP), which is defined as the difference between the effective and mean number of alleles across all loci (Bergmann et al. 1990), and the allelic richness were estimated using FSTAT 2.9.3 (Goudet 2001). Null alleles may significantly overestimate population differentiation due to the presence of false homozygotes (Chapuis and Estoup 2007). Therefore, the presence of null alleles in our dataset was assessed using Micro-Checker 2.2.3 (Van Oosterhout et al. 2004). The outlier patterns of differentiation at microsatellite loci were analysed using LOSITAN software (Tiago et al. 2008). This program allows the assessment of the expected distribution of Wright’s inbreeding coefficient (FST) versus expected heterozygosity (He) in a model of migration with neutral markers. Departures from neutrality was evaluated for both nuclear and chloroplast microsatellites using the outlier detection approach. There were 5×10⁵ simulations conducted to identify the upper and lower 95% confidence limits around the FST values.
The population structure based on allelic frequency spectra was examined using Weir and Cockerham’s method as implemented in GenePop 4.4 (Rousset 2008). A significance test with 1000 permutations was performed using FSTAT 2.9.3 to determine if the FST of the tested populations from Poland and reference regions differed significantly (Goudet 2001). A hierarchical analysis of molecular variance (AMOVA) was used to estimate the partitioning of genetic variation among the populations and regions using GenAlEx 6.5 software (Peakall and Smouse 2012). The significance of the AMOVA was tested with 999 permutations. The genetic differentiation between populations and regions was also assessed using Nei’s genetic distances (Nei 1972). Individual samples and populations were assigned to different genetic groups using clustering analysis in STRUCTURE 2.3 (Pritchard et al. 2000). In the Bayesian population structure analysis, the admixture model was used with the following assumptions: all markers were unlinked, all trees were admixed and all frequencies were correlated between loci. The number of tested genetic clusters (K) varied from 1 to 6, and ten independent runs were conducted for each K. The burning was set to 100 000, and the run length was set to 1 000 000. The number of clusters for each level of population comparison was inferred using Harvester software (Earl and Holdt 2012). The genetic relationships between populations were also investigated using Principal Coordinates Analysis (PCoA) based on FST values for genotype frequency at nSSRs and based on Nei’s (1972) genetic distances for haplotype frequency at cpSSR loci. Differentiation among Polish populations and between Polish and reference populations due to spatial isolation was tested using the Mantel test (1967) in GenAlEx 6.5 software (Peakall and Smouse 2012). The matrixes of pairwise geographic (logarithmic scale) and pairwise genetic distances (FST values for genotype frequency at nSSR or Nei’s (1972) values for haplotype frequency at cpSSR) were compared and tested for significance using 9999 permutations.
3 Results
3.1 Genetic variation
The nuclear microsatellites were polymorphic in most populations, with a total of 88 alleles detected (Table 2). The number of alleles per locus ranged from 2 to 21. The mean observed heterozygosity (Ho = 0.422) was slightly lower than the mean expected heterozygosity (He = 0.480).The allele frequency spectra were skewed at some loci, as evidenced by deviations from Hardy-Weinberg equilibrium (Table 2). Some evidence of the presence of null alleles was found at 6 loci, but their frequency was low (0.006–0.079). Deviation from neutrality, which indicates divergent selection, was found only at the nuclear psyl25 locus (Supplementary file: Fig. S1). This locus showed the lowest number of alleles and the lowest observed heterozygosity of all the nuclear SSR loci studied (Table 2).
| Table 2. Genetic parameters for the nuclear microsatellite loci tested in all Polish pine populations. N – number of alleles per locus, R – range of allele size, A – mean number of alleles per locus, Ae – mean effective number of alleles per locus, Ho – mean observed heterozygosity, He – mean expected heterozygosity, F – mean fixation index, null – null allele frequency, ns – non significant, * P ≤ 0.05. | |||||||||
| Locus | N | R | A | Ae | Ho | He | F | null | Deviation from HW equlibrium |
| psyl42 | 6 | 165–177 | 4.19 | 3.31 | 0.673 | 0.698 | 0.035 | 0.000 | ns |
| psyl25Δ | 2 | 213–216 | 1.56 | 1.07 | 0.040 | 0.062 | 0.343 | 0.014 | * |
| psyl18ΔΔ | 6 | 287–305 | 2.50 | 1.14 | 0.119 | 0.124 | 0.041 | 0.000 | ns |
| psyl44 | 5 | 166–178 | 3.06 | 1.27 | 0.209 | 0.215 | 0.030 | 0.000 | ns |
| psyl57 | 7 | 184–202 | 5.38 | 2.35 | 0.561 | 0.575 | 0.024 | 0.006 | * |
| psyl36 | 5 | 245–257 | 3.56 | 1.37 | 0.275 | 0.270 | –0.016 | 0.000 | ns |
| PtTX4011 | 10 | 229–279 | 5.19 | 2.94 | 0.459 | 0.660 | 0.304 | 0.079 | * |
| Spac11.4 | 21 | 122–170 | 10.94 | 7.84 | 0.803 | 0.872 | 0.079 | 0.006 | * |
| PtTX3025 | 10 | 206–298 | 5.94 | 2.61 | 0.548 | 0.617 | 0.112 | 0.018 | * |
| PtTX4001 | 16 | 199–243 | 7.69 | 3.37 | 0.536 | 0.703 | 0.237 | 0.054 | * |
| Δ – locus monomorphic for populations: PL2, PL3, PL5, PL11, PL12, PL14, F17, F18, Sp21, S23 ΔΔ – locus monomorphic for PL11 | |||||||||
The chloroplast microsatellites were polymorphic at six loci in the analysed populations, with a total of 39 alleles detected (Table 3). The number of alleles ranged from 4 to 8 per locus. The most polymorphic was the PCP30277 locus, which showed the highest effective number of alleles (Ae = 3.68) and mean heterozygosity (uh = 0.754) (Table 3).
| Table 3. Characteristics of the chloroplast microsatellite loci used to study Scots pine from the Polish species distribution. N – number of alleles per locus, R – range of allele size, A – mean number of alleles per locus, Ae – mean effective number of alleles per locus, uh – unbiased allelic diversity. | |||||
| Locus | N | R | A | Ae | uh |
| PCP36567 | 4 | 108–111 | 2.25 | 1.40 | 0.291 |
| PCP30277 | 8 | 130–137 | 5.69 | 3.68 | 0.754 |
| PCP102652Δ | 4 | 109–115 | 1.81 | 1.10 | 0.081 |
| PCP26106 | 4 | 142–145 | 2.94 | 1.71 | 0.422 |
| PCP87314 | 4 | 111–114 | 3.32 | 1.51 | 0.336 |
| PCP45071 | 6 | 146–152 | 3.63 | 1.75 | 0.427 |
| PCP1289 | 4 | 107–110 | 3.19 | 1.75 | 0.430 |
| PCP41131ΔΔ | 5 | 135–139 | 2.00 | 1.23 | 0.182 |
| Δ – locus monomorphic for populations: PL7, PL8, PL9, PL10, PL12, PL14, PL16, F18, F19, Sp21, Sp22, S23 ΔΔ – locus monomorphic for populations: PL10, PL12, PL16, F18 | |||||
For 16 Polish provenances the mean number of alleles ranged from 4.40 to 5.50 (Table 4). The effective number of alleles varies from 2.24 to 2.84. Variable levels of genetic diversity were found across Polish populations from different climatic regions, in Central and North Poland (I and II climatic zones) (Table 4). The local population (PL15) from South Poland (III climatic zone) was characterized by the lowest observed heterozygosity. Pines from North Poland had the highest number of private alleles at nuclear loci. The inbreeding coefficient ranged from 0to 0.180, with a mean of 0.055. Pines from North and South Poland had the highest values of latent genetic potential (Table 4).
| Table 4. Genetic diversity of Scots pine populations in Poland based on nuclear microsatellite loci. A – mean number of alleles per locus, Ae – mean effective number of alleles per locus, Ap – number of private alleles, AR – allelic richness, Ho – mean observed heterozygosity, He – mean expected heterozygosity, F – mean fixation index, LGP – latent genetic potential, * statistically significant differentiation of populations (P ≤ 0.05). | |||||||||
| nSSR diversity | |||||||||
| Population | Sample size | A | Ae | AP | AR | Ho | He | F | LGP |
| PL1 Karsko | 19 | 4.80 | 2.66 | 0 | 4.59 | 0.496 | 0.506 | 0.005 | 21.42 |
| PL8 Gubin | 19 | 5.30 | 2.84 | 0 | 5.16 | 0.487 | 0.492 | –0.001 | 24.61 |
| PL9 Rychtal | 24 | 4.50 | 2.63 | 0 | 4.81 | 0.388 | 0.491 | 0.180 | 18.70 |
| PL10 Bolewice | 21 | 5.00 | 2.48 | 0 | 4.99 | 0.407 | 0.436 | 0.053 | 25.20 |
| PL13 Spała | 20 | 5.10 | 2.72 | 1 | 4.41 | 0.457 | 0.473 | 0.010 | 23.82 |
| PL14 Janów Lubelski | 23 | 4.90 | 2.41 | 0 | 4.83 | 0.376 | 0.445 | 0.108 | 24.91 |
| PL2 Tabórz | 23 | 4.40 | 2.45 | 0 | 4.76 | 0.390 | 0.425 | 0.051 | 19.53 |
| PL3 Dłużek | 21 | 4.90 | 2.39 | 1 | 4.20 | 0.456 | 0.482 | 0.037 | 25.12 |
| PL4 Ruciane | 22 | 5.30 | 2.84 | 2 | 4.86 | 0.452 | 0.501 | 0.062 | 24.59 |
| PL5 Rozpuda | 23 | 5.00 | 2.74 | 0 | 5.13 | 0.424 | 0.464 | 0.077 | 22.60 |
| PL6 Supraśl | 21 | 5.10 | 2.47 | 0 | 4.82 | 0.438 | 0.465 | 0.010 | 26.35 |
| PL7 Starzyna | 22 | 5.50 | 2.70 | 1 | 4.85 | 0.411 | 0.461 | 0.075 | 27.99 |
| PL11 Lipowa | 21 | 5.10 | 2.27 | 2 | 4.74 | 0.415 | 0.445 | 0.037 | 28.29 |
| PL12 Jegiel | 21 | 5.10 | 2.55 | 0 | 4.91 | 0.411 | 0.471 | 0.070 | 25.51 |
| PL15 Nowy Targ | 23 | 5.10 | 2.24 | 1 | 4.64 | 0.361 | 0.417 | 0.085 | 28.58 |
| PL16 Piwniczna | 23 | 4.90 | 2.35 | 0 | 4.69 | 0.404 | 0.417 | 0.024 | 25.53 |
| Population means (regions) | |||||||||
| I | 126 | 4.9 | 2.62 | 1.0 | 4.80 | 0.435 | 0.474 | 0.059 | 23.11 |
| II | 174 | 5.1 | 2.55 | 6.0 | 4.78 | 0.425 | 0.464 | 0.052 | 25.00 |
| III | 46 | 5.0 | 2.29 | 1.0 | 4.67 | 0.383 | 0.417 | 0.054 | 27.06 |
| Population means (central populations) | |||||||||
| Finland | 49 | 5.2 | 2.49 | 0.5 | 4.74 | 0.484 | 0.448 | –0.049 | 28.34 |
| Poland | 346 | 5.0 | 2.55 | 0.5 | 4.77 | 0.423 | 0.462 | 0.055 | 24.55 |
| Populations means (marginal populations) | |||||||||
| Turkey | 50 | 4.65 | 2.35 | 3 | 4.42 | 0.461 | 0.478 | 0.069 | 23.40 |
| Spain | 60 | 4.75 | 2.46 | 1 | 4.37 | 0.445 | 0.462 | 0.079 | 22.88 |
| Scotland | 39 | 5.70 | 2.66 | 1 | 4.82 | 0.476 | 0.482 | 0.000 | 30.38 |
| Central vs. marginal populations | |||||||||
| Central | 395 | 5.01 | 2.53 | 1.3 | 4.76* | 0.435 | 0.462 | 0.037 | 25.03 |
| Marginal | 149 | 5.03 | 2.49 | 1.7 | 4.54* | 0.461 | 0.474 | 0.049 | 25.55 |
In the central pine distribution area, the Polish and Finnish populations showed similar values for effective number of alleles (2.55 and 2.49, respectively), allelic richness (4.77 and 4.74, respectively) and expected heterozygosity (0.462 and 0.448, respectively) (Table 4). The populations from Finland exhibited higher observed heterozygosity than expected relative to the Polish populations and to the other geographical regions represented by marginal populations. The Scottish population showed the highest values for almost all genetic parameters based on genotypic frequency at the nSSR loci. The marginal populations from Spain and Turkey had the lowest allelic diversity, richness and latent genetic potential of the tested regions. Similar levels of genetic variation were found in populations from the continuous distribution (Poland and Finland) and marginal populations (Turkey, Spain, Scotland), except for a significant difference in allelic richness (4.76 and 4.54, respectively, P ≤ 0.05) (Table 4).
The distribution of genetic diversity at the chloroplast loci between Polish populations was similar to that found for the nuclear markers (Table 5). The mean number of haplotypes varied from 14 to 22. The effective number of haplotypes ranged from 10.67 to 21.00. The highest number of genetic polymorphisms was found in population PL6 from North Poland, and several other populations from that region showed genetic parameter values above the means for the Polish populations. Haplotype diversity was high in all populations, ranging from 0.946 to 1.000.
| Table 5. Genetic diversity of Scots pine populations in Poland based on chloroplast microsatellite loci. Ah – mean number of haplotypes, Ae – mean effective number of haplotypes, AP – number of private haplotypes, AR – haplotype richness, Hd – haplotype diversity, D2sh – mean genetic distance of individuals within populations. | |||||||
| cpSSR diversity | |||||||
| Population | Sample size | Ah | Ae | AP | AR | Hd | D2sh |
| PL1 Karsko | 23 | 20 | 18.24 | 7 | 17.51 | 0.988 | 2.518 |
| PL8 Gubin | 24 | 14 | 10.67 | 5 | 11.97 | 0.946 | 1.719 |
| PL9 Rychtal | 23 | 21 | 19.59 | 3 | 18.34 | 0.992 | 2.015 |
| PL10 Bolewice | 24 | 19 | 16.94 | 3 | 16.20 | 0.982 | 1.759 |
| PL13 Spała | 22 | 18 | 16.13 | 7 | 16.36 | 0.983 | 2.797 |
| PL14 Janów Lubelski | 23 | 19 | 16.03 | 8 | 16.60 | 0.980 | 2.536 |
| PL2 Tabórz | 23 | 20 | 18.24 | 9 | 17.51 | 0.988 | 2.875 |
| PL3 Dłużek | 21 | 19 | 17.64 | 8 | 18.00 | 0.990 | 2.818 |
| PL4 Ruciane | 24 | 20 | 18.00 | 8 | 16.96 | 0.986 | 3.706 |
| PL5 Rozpuda | 23 | 18 | 14.30 | 6 | 15.69 | 0.972 | 1.989 |
| PL6 Supraśl | 21 | 21 | 21.00 | 11 | 20.00 | 1.000 | 4.089 |
| PL7 Starzyna | 21 | 17 | 12.60 | 7 | 16.00 | 0.967 | 1.883 |
| PL11 Lipowa | 24 | 19 | 16.00 | 6 | 16.09 | 0.978 | 1.969 |
| PL12 Jegiel | 24 | 19 | 16.00 | 2 | 16.09 | 0.978 | 1.879 |
| PL15 Nowy Targ | 24 | 22 | 20.57 | 6 | 18.48 | 0.993 | 2.014 |
| PL16 Piwniczna | 24 | 19 | 14.40 | 5 | 15.98 | 0.971 | 1.757 |
| Population means (regions) | |||||||
| I | 139 | 18.9 | 16.53 | 5.5 | 16.67 | 0.981 | 2.468 |
| II | 181 | 19.2 | 16.96 | 7.1 | 17.36 | 0.984 | 2.894 |
| III | 48 | 17.5 | 15.13 | 5.5 | 15.15 | 0.969 | 1.867 |
| Population means (central populations) | |||||||
| Finland | 49 | 20.0 | 17.96 | 7.3 | 16.36 | 0.979 | 2.041 |
| Poland | 368 | 19.1 | 16.65 | 6.3 | 16.74 | 0.981 | 2.395 |
| Populations means (marginal populations) | |||||||
| Turkey | 50 | 18.0 | 14.66 | 6.5 | 14.86 | 0.970 | 4.794 |
| Spain | 60 | 21.5 | 16.80 | 10.5 | 15.38 | 0.972 | 3.091 |
| Scotland | 38 | 27.0 | 19.00 | 11.0 | 15.74 | 0.973 | 2.208 |
| Central vs. marginal populations | |||||||
| Central | 417 | 19.5 | 16.74 | 5.5 | 16.73 | 0.981 | 2.346 |
| Marginal | 148 | 21.2 | 16.38 | 9.0 | 15.24 | 0.971 | 3.596 |
The haplotypic richness, diversity and mean pairwise distance in the Polish populations were similar to those in Finish pines (Table 5). The populations from the central pine distribution showed a higher mean effective number of haplotypes, haplotype richness and diversity than the marginal populations. The highest mean number of haplotypes and private haplotypes was found in Scottish population.
3.2 Genetic differentiation and population structure
AMOVA analysis showed that less than 3% of the genetic differentiation is found among the Polish populations (Table 6). Significant differentiation was found only in some pairwise comparisons between individual populations on the basis of FST values for genotype frequency at nuclear loci (Suppl. file: Table S1). However, there is no evidence of genetic divergence in the geographical regions defined (Table 6, Suppl. file: Table S1). Overall low genetic distances between the Polish populations were evident in the PCoA analysis (Fig. 2). Similarly, in the STRUCTURE analysis, pines from Poland were assigned to one genetic cluster (Fig. 2). No evidence of isolation by distance was found among the Polish populations in the Mantel test (Suppl. file: Fig. S2).
| Table 6. Hierarchical analysis of molecular variance (AMOVA) at nuclear loci (nSSR diversity) and at chloroplast loci (cpSSR diversity) based on the allelic distance matrix, df – degrees of freedom, SS – sum of squares, MS – mean squares, p – probability. | ||||||||
| nSSR diversity | cpSSR diversity | |||||||
| Variance component | df | SS | MS | Variance | % Total | p | % Total | p |
| Polish populations | ||||||||
| Among Regs | 2 | 20.185 | 10.093 | 0.016 | 0 | 0.095 | 0 | 0.165 |
| Among Pops | 13 | 107.865 | 8.297 | 0.139 | 3 | 0.001 | 0 | 0.956 |
| Within Pops | 330 | 1750.996 | 5.306 | 5.306 | 97 | 0.001 | 100 | 0.893 |
| Total | 345 | 1879.046 | ||||||
| Population means (central populations) | ||||||||
| Among Regs | 3 | 28.730 | 9.577 | 0.013 | 0 | 0.120 | 0 | 0.507 |
| Among Pops | 14 | 115.596 | 8.257 | 0.141 | 3 | 0.001 | 0 | 0.585 |
| Within Pops | 377 | 1953.509 | 5.182 | 5.182 | 97 | 0.001 | 100 | 0.657 |
| Total | 394 | 2097.835 | ||||||
| Central vs. marginal populations | ||||||||
| Among Regs | 1 | 122.613 | 122.613 | 0.503 | 8 | 0.001 | 1 | 0.003 |
| Among Pops | 21 | 258.106 | 12.291 | 0.299 | 5 | 0.001 | 0 | 0.256 |
| Within Pops | 521 | 2761.401 | 5.300 | 5.300 | 87 | 0.001 | 99 | 0.007 |
| Total | 543 | 3142.119 | ||||||
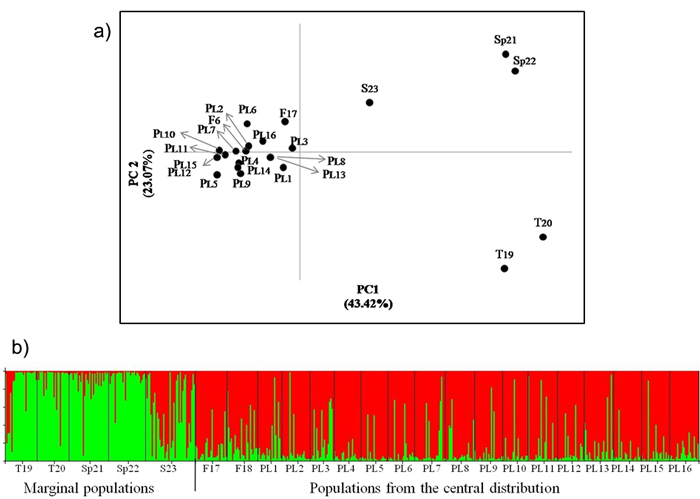
Fig. 2. a) Principal coordinates plot showing the genetic relationship of the Scots pine populations from the wide distribution of this species. The proportion of variance accounted for by the first two axes was 66.49%, b) Assignment of investigated populations to the two genetic clusters (K = 2) found in the STRUCTURE analysis based on nuclear microsatellite markers. Population acronyms are as in Table 1.
There was no significant differentiation in the allelic frequency spectra among the Polish and Finnish populations growing in the central pine distribution area. Significant differentiation was found between the central and marginal populations of Scots pine (Table 6). A variation of about 8% of among populations occurred within regions. The differentiation among central populations was lower than that between marginal populations (FST = 0.016 and FST = 0.074, respectively, P ≤ 0.05). The Polish and Finnish populations were also grouped in one cluster, while the marginal populations were separated from them in the PCoA analysis (Fig. 2). Genetic divergence between populations was also evident in the Bayesian STRUCTURE analysis, in which one genetic cluster covered the Polish and Finnish populations and the other cluster included Turkish and Spanish pines. The Scottish population showed an intermediate genetic structure between the two other major groups (Fig. 2). A significant positive correlation between genetic and geographic distances was found for all the studied Scots pine populations from the central and marginal distributions in the Mantel test (r = 0.602, P ≤ 0.01) (Suppl. file: Fig. S3).
In contrast to the nuclear markers, the chloroplast microsatellites showed much less evidence of population structure in the Polish pine distribution and reference populations (Table 6). Almost all the differentiation was found within individual populations (Table 6). AMOVA analysis showed significant differentiation only between central pines and marginal populations. Less than 1% of the haplotypic variation was due to differences among these regions. A principal coordinates plot of the cpSSR loci showed no particular grouping of central versus marginal populations except for the outlier populations from Spain (Suppl. file: Fig. S4). No evidence of strong population structure was found in the STRUCTURE analysis (Suppl. file: Fig. S5). However, a significant correlation between the genetic diversity of the chloroplast loci and geographic distance was found for populations of Scots pine from the entire analysed species distribution (r = 0.437, P ≤ 0.05) (Suppl. file: Fig S6) and for populations from the Polish pine distribution (r = 0.284, P ≤ 0.05) (Suppl. file: Fig. S7).
4 Discussion
Our data show high genetic similarity amongst Polish populations at nuclear and chloroplast microsatellite markers. The genetic diversity of the investigated populations was lower relative to populations of native stands from North-eastern Poland which were determined by nuclear microsatellites with mean heterozygosity equalled 0.778 (Nowakowska 2016). However, in this study only four loci were taken into account so direct comparisons of the results are not fully informative (Kalinowski 2005). An equally high value of the genetic diversity for chloroplast microsatellites markers, paternally inherited in conifers, was observed in other Polish populations with He = 0.98 (Wójkiewicz et al. 2016b). We found a similar degree of polymorphism and no statistically significant differentiation between the three climatic regions at both markers. Some differences were found in the nuclear loci in pairwise population comparisons, but no clear geographical trend in variation could be observed. No evidence of isolation by distance at the nuclear microsatellite loci was found among the Polish pine populations in the Mantel test. A positive relationship between pairwise Nei’s genetic and geographic distance was found for the chloroplast loci. However, this variation disappeared when local populations from the Carpathian Mountains were excluded from the analysis. Interestingly, the lowest genetic variation and highest inbreeding rate at the nuclear loci was found in the local population PL15 from the Carpathian Mountains, which also showed the worst growth rate and weak productivity in quantitative trait studies of the provenance trial experiments (Barzdajn 2006; Hebda et al. 2017). In this case, the poor growth and development of local pines correlate with the low levels of genetic diversity. It is a known fact that a small number of pine trees produce seeds in that area (Skrzyszewski 2004). The topographical features of the landscape, including dispersed Scots pine habitat, has likely limited gene flow and narrowed the genetic variation in the populations (Oleksyn et al. 1994). The low level of seed production by the pines growing in Carpathians likely decreased the genetic diversity of the progeny used to set up the provenance experiment plots, as suggested by our study.
The genetic structure of a population at neutral markers is influenced by population history and several processes, including mutation, migration and random genetic drift. The distribution of genetic variation is strictly related to gene flow through pollen and seeds. Free gene flow in large geographical areas may have a homogenizing effect on an allele’s frequency spectra and the gene pool of individuals (Burczyk et al. 2004; Robledo-Arnuncio et al. 2004). It is seen in the genetic diversity of P. sylvestris at nuclear and chloroplast markers, which is widely distributed across the range. The high genetic diversity has been reported in isolated populations from Italy (He = 0.847 and 0.81; Belletti et al. 2012; Scalfi et al. 2009, respectively) and in populations from the broad pine distribution from Romania and Sweden (He ranged from 0.50 to 0.80; Floran et al. 2010), determined by the nuclear microsatellites. On the other hand low values of heterozygosity (He = 0.338, He = 0.376, He = 0.325, respectively) for some Scots pine populations from continuous species distribution, from Finland and two populations from Russia, have been showed (Sebastiani et al. 2012). Additionally, the high level of the genetic diversity for chloroplast microsatellites loci was observed in populations of Scots pine from Scotland, Spain, Western and Central Europe (H ranged from 0.950 to 0.987, Provan et al. 1998), in Italian (H = 0.92, Scalfi et al. 2009) and Spanish P. sylvestris (H = 0.978, Robledo-Arnucio et al. 2004). Although the recolonization history of Scots pine in Europe is still not fully resolved (Pyhäjärvi et al. 2008; Naydenov et al. 2007), the low divergence amongst Polish populations may indicate their common phylogeographic history. Alternatively, it may have resulted from range shifts and the effective admixture of populations of different origin that colonized Central Europe after last glacial period. Therefore, the development of high-resolution mitochondrial markers transmitted in pines across short geographical distances by seeds is essential for fine scale population structure and admixture analysis (Donnelly et al. 2017).
Compared to the reference distribution of Scots pine in Europe, Polish populations showed a very similar level of genetic variation to Finnish populations. Both geographical regions had similar allelic frequency spectra distributions, and no significant correlation between genetic differentiation and geographical distance between populations was found for the nuclear and chloroplast loci in the Mantel test. Obtained results are in accordance with other studies on P. sylvestris in the continuous species distribution in Europe using isoenzymes and DNA markers (Dvornyk et al. 2002; Garcia-Gil et al. 2003; Goncharenko et al. 1994; Pyhäjärvi et al. 2007; Wachowiak et al. 2014; Wang et al. 1991). Considering the large geographical areas covered by investigated populations, it seems that their genetic similarity must result from shared phylogeographic history. In contrast, those pine populations from Central and Northern Europe differed from marginal pines in characteristics such as allelic richness, the number of private haplotypes and the mean genetic distance. Allelic richness is a measure of genetic diversity that indicates the population’s potential for adaptability and persistence (Greenbaum et al. 2014). The significant lower level of allelic richness in the marginal populations might reflect differences in the effective population size, the influence of genetic drift and population history related to population size fluctuations.
In our study, the analysis of population structure at nuclear markers showed that the marginal populations are genetically divergent and separated from the central populations. Our data support a distinct character of isolated populations which was shown using mitochondrial DNA and morphological markers (Naydenov et al. 2007; Pyhäjärvi et al. 2007; Sinclair et al. 1999; Soranzo et al. 2000). Differentiation between those geographical regions indicates limited gene flow and possibly different evolutionary history. Previous genetic studies showed that the populations from Turkey, the Iberian Peninsula and Scotland were characterized by a higher level of heterozygosity or some unique molecular markers relative to the populations in central and northern Europe (Prus-Głowacki et al. 2012; Floran et al. 2010; Pyhäjärvi et al. 2007; Wachowiak et al. 2011). The intermediate genetic structure of the Scottish pine population relative to the central and marginal locations may result from the admixture of populations with different postglacial histories (Wachowiak et al. 2011). The genetic variability of populations across the wide species distribution range was supported by the significant isolation by distance observed in our study.
Molecular markers might be used to assess the role of selection on the distribution of adaptive genetic variability. Selection at a specific locus may be reflected by deviation from Hardy-Weinberg equilibrium. One nuclear locus in our study (psyl25) exhibited patterns of genetic variation that deviated from neutral expectations. This locus showed the lowest number of alleles (just 2, 216 and 213 bp) of all the analysed loci. The allele distribution showed some geographical trend, with a rare allele (213) being present more frequently in populations from Central and Southern Poland. This locus was monomorphic in most populations from North Poland. If selection was involved, that would mean that this nuclear microsatellite could lie in a very close proximity to genomic regions under selection, as the microsatellite markers themselves are generally assumed to be selectively neutral and a level of recombination in pines (at least for coding regions) seems high (Wachowiak et al. 2009). Deviation from the expected allele frequency spectra might also be caused by the presence of null alleles at the loci. Null alleles might occur due to mutations in the primer binding sites and lead to the over estimation of homozygosity due to deficits in specific alleles at a single locus (Callen et al. 1993). However, our study showed an overall low frequency of null alleles that did not significantly skew the allelic frequency spectra across populations.
The microsatellites tested in our study provide information on genetic diversity, population structure and demographics, which are essential for distinguishing the confounding effects of demographic processes and shared population history from that of selection (Chhatre and Rajora 2014). The provenance trial was previously subjected to quantitative genetic studies (Hebda et al. 2017). Those studies showed that the pines from the Polish distribution are significantly differentiated in growth or productivity parameters, as measured during 50 years of performance in the experimental plot in the Carpathian Mountains (Hebda et al. 2017). The examined populations from the provenance trial show a low level of genetic polymorphism at neutral loci and high heritable phenotypic diversity. Therefore, some of the excellent and poorly growing populations from the provenance trial experiment could be especially useful to test for selection patterns at the genomic regions that are potentially involved in phenotypic variation at quantitative traits.
Acknowledgements
The research was partly supported by the Polish Ministry of Science and Higher Education (Grants No. 3405/ZGNiSzL/10-16 and 4435/ZGNiSzL/14). WW acknowledges financial support from the Polish National Science Centre (Grant No. DEC-2012/05/E/NZ9/03476) and the Institute of Dendrology, Polish Academy of Sciences. We would like to thank our colleagues from the Department of Forest Pathology, Mycology and Tree Physiology, Institute of Forest Ecosystem Protection, University of Agriculture in Kraków for offering some of the laboratory equipment for research.
References
Alía R., Moro-Serrano J., Notivol E. (2001). Genetic variability of Scots pine (Pinus sylvestris) provenances in Spain: growth traits and survival. Silva Fennica 35(1): 27–38. https://doi.org/10.14214/sf.601.
Barzdajn W. (2006). Zmienność cech taksacyjnych sosny zwyczajnej (Pinus sylvestris L.) polskich pochodzeń w doświadczeniu proweniencyjnym z 1985 roku w Nadleśnictwie Zielonka. [Diversity of specific traits of Scots pine (Pinus sylvestris L.) of Polish origins in the provenance trial of 1985 in Forest District Zielonka]. Sylwan 150(1): 8–19.
Barzdajn W., Kowalkowski W., Chmura D.J. (2016). Variation in growth and survival among European provenances of Pinus sylvestris in a 30-year-old experiment. Dendrobiology 75: 67–77. https://doi.org/10.12657/denbio.075.007.
Belletti P., Ferrazzini D., Piotti A., Monteleone I., Ducci F. (2012). Genetic variation and divergence in Scots pine (Pinus sylvestris L.) within its natural range in Italy. European Journal of Forest Research 131(4): 1127–1138. https://doi.org/10.1007/s10342-011-0584-3.
Bergmann F., Gregorius H.R., Larsen J.B. (1990). Levels of genetic variation in European silver fir (Abies alba). Genetica 82(1): 1–10. https://doi.org/10.1007/BF00057667.
Burczyk J., Difazio S.P., Adams W.T. (2004). Gene flow in forest trees: how far do genes really travel? Forest Genetics 11: 3–4.
Callen D.F., Thompson A.D., Shen Y., Phillips H.A., Richards R.I., Mulley J.C., Sutherland G.R. (1993). Incidence and origin of “null” alleles in the (AC)n microsatellite markers. American Journal of Human Genetics 52(5): 922–927.
Chapuis M.P., Estoup A. (2007). Microsatellite null alleles and estimation of population differentiation. Molecular Biology and Evolution 24(3): 621–631. https://doi.org/10.1093/molbev/msl191.
Cheddadi R., Vendramin G.G., Litt T., François L., Kageyama M., Lorentz S., Laurent J.M., de Beaulieu J.L., Sadori L., Jost A., Lunt D. (2006). Imprints of glacial refugia in the modern genetic diversity of Pinus sylvestris. Global Ecology and Biogeography 15(3): 271–282.
Chhatre V.E., Rajora O.P. (2014). Genetic divergence and signatures of natural selection in marginal populations of a keystone, long-lived conifer, eastern white pine (Pinus strobus) from Northern Ontario. PLoS ONE 9(5): 1–13. https://doi.org/10.1371/journal.pone.0097291.
Donnelly K., Cottrell J., Ennos R.A., Vendramin G.G., A’Hara S., King S., Perry A., Wachowiak W., Cavers S. (2017). Reconstructing the plant mitochondrial genome for marker discovery: a case study using Pinus. Molecular Ecology Resources. https://doi.org/10.1111/1755-0998.12646.
Dvornyk V., Sirviö A., Mikkonen M., Savolainen O. (2002). Low nucleotide diversity at the pal1 locus in the widely distributed Pinus sylvestris. Molecular Biology and Evolution 19(2): 179–188. https://doi.org/10.1093/oxfordjournals.molbev.a004070.
Earl D.A., vonHoldt B.M. (2012). STRUCTURE HARVESTER: a website and program for visualizing STRUCTURE output and implementing the Evanno method. Conservation Genetics Resources 4(2): 359–361. https://doi.org/10.1007/s12686-011-9548-7.
Eliades N.G., Eliades D.G. (2009). HAPLOTYPE ANALYSIS: software for analysis of haplotype data. Forest Genetics and Forest Tree Breeding, Georg-August University Goettingen, Germany. http://www.uni-goettingen.de/en/134935.html.
Elsik C.G., Minihan V.T., Hall S.E., Scarpa A.M., Williams C.G. (2000). Low-copy microsatellite markers for Pinus taeda L. Genome 43(3): 550–555. http://www.ncbi.nlm.nih.gov/pubmed/10902720.
Eriksson G. (2008). Pinus sylvestris recent genetic research. Swedish University of Agricultural Science, Uppsala.
Floran V., Ganea S., Sestras R., Rosario M., Gil G. (2010). Genetic variability in populations of Scots pine from Romania and Sweden. Bulletin of University of Agricultural Sciences and Veterinary Medicine Cluj-Napoca. Horticulture 67(1): 481. http://journals.usamvcluj.ro/index.php/horticulture/article/view/4930.
Garcia-Gil M.R., Mikkonen M., Savolainen O. (2003). Nucleotide diversity at two phytochrome loci along a latitudinal cline in Pinus sylvestris. Molecular Ecology 12(5): 1195–1206. https://doi.org/10.1046/j.1365-294X.2003.01826.x.
Giertych M. (1993). Zmienność proveniencyjna. [Provenance diversity]. In: Białobok S., Boratyński A., Bugała W. (eds.). Biologia sosny zwyczajnej. [Biology of Scots pine]. Sorus, Poznań-Kórnik. p. 325–339.
Giertych M. (1979). Summer of results on Scots pine (Pinus sylvestris L.) height growth in IUFRO provenance experiments. Silvae Genetica 28: 136–152.
Goncharenko G.G., Silin A.E., Padutov V.E. (1994). Allozyme variation in populations of Eurasian pines III: population sturcture, diversity, differentiation and gene flow in central and isolated populations of Pinus sylvestris L. in Eastern Europe and Siberia. Silva Genetica 43: 119–32.
Goudet J. (2001). FSTAT, version 2.9. 3. A program to estimate and test gene diversities and fixation indices. Lausanne University, Lausanne, Switzerland.
Greenbaum G., Templeton A.R., Zarmi Y., Bar-David S. (2014). Allelic richness following population founding events – a stochastic modeling framework incorporating gene flow and genetic drift. PLoS ONE 9(12): 1–23. https://doi.org/10.1371/journal.pone.0115203.
Hampe A., Petit J. (2005). Perspectives conserving biodiversity under climate change: the rear edge matters. Ecology Letters 8(5): 461–467. https://doi.org/10.1111/j.1461-0248.2005.00739.x.
Hebda A., Wachowiak W., Skrzyszewski J. (2017). Long-term growth performance and productivity of Scots pine (Pinus sylvestris L.) populations. Acta Societatis Botanicorum Poloniae 86(1): 1–16. https://doi.org/10.5586/asbp.3521.
Jaworski A. (2011). Charakterystyka hodowlana drzew i krzewów leśnych. [Characteristics of forest trees and shrubs]. In: Hodowla lasu. [Forest silviculture]. Powszechne Wydawnictwo Rolnicze i Leśne, Warszawa.
Kalinowski S.T. (2005). Do polymorphic loci require large sample sizes to estimate genetic distances? Heredity 94(1): 33–36. https://doi.org/10.1038/sj.hdy.6800548.
Müller U.C., Pross J., Bibus E. (2003). Vegetation response to rapid climate change in Central Europe during the past 140,000 YR based on evidence from the Füramoos pollen record. Quaternary Research 59(2): 235–45. https://doi.org/10.1016/S0033-5894(03)00005-X.
Naydenov K., Senneville S., Beaulieu J., Tremblay F., Bousquet J. (2007). Glacial vicariance in Eurasia: mitochondrial DNA evidence from Scots pine for a complex heritage involving genetically distinct refugia at mid-northern latitudes and in Asia Minor. BMC Evolutionary Biology 7: 233. https://doi.org/10.1186/1471-2148-7-233.
Nei M. (1972). Genetic distance between populations. The American Naturalist 106(949): 283–292. https://doi.org/10.1086/282771.
Niedzielska B., Skrzyszewski J., Biel T. (2001). Podstawowe cechy drewna sosny zwyczajnej (Pinus sylvestris L.) w drzewostanach lokalnego pochodzenia na obszarze Karpat i Sudetów. [Basic wood traits of Scots pine (Pinus sylvestris L.) stands of local origin in the area of Carpathians and Sudeten]. Acta Agraria et Silvestria, Series Silvestris 39: 161−182.
Nowakowska J.A. (2016). Microsatellite markers in analysis of forest-tree populations. In: Abdurakhmonov I.Y. (ed.). Microsatellite markers. Open Science InTech. p. 95–116. https://doi.org/10.5772/64867.
Oleksyn J., Prus-Glowacki W., Giertych M., Reich P.B. (1994). Relation between genetic diversity and pollution impact in a 1912 experiment with East European Pinus sylvestris provenances. Canadian Journal of Forest Research 24(12): 2390–2394. https://doi.org/10.1139/x94-308.
Oleksyn J., Tjoelker M.G., Reich P.B. (1998). Adaptation to changing environment in Scots pine populations across a latitudinal gradient. Silva Fennica 32(2): 129–140. https://doi.org/10.14214/sf.691.
Oleksyn J., Rachwał L. (1994). Wzrost europejskich populacji sosny zwyczajnej (Pinus sylvestris L.) w doświadczeniu proweniencyjnym SP-IUFRO-1982 w Puszczy Niepołomickiej. [Growth of European populations of Scots pine (Pinus sylvestris L.) in provenance experiment SP-IUFRO-1982 in Forest District Niepołomice]. Sylwan CXXXVIII(9): 57–69.
Peakall R., Smouse P.E. (2012). GenAlEx 6.5: genetic analysis in Excel. Population genetic software for teaching and research – an update. Bioinformatics 28(19): 2537–2539. https://doi.org/10.1093/bioinformatics/bts460.
Petit R.J., Hampe A. (2006). Some evolutionary consequences of being a tree. Annual Review of Ecology, Evolution, and Systematics 37(1): 187–214. https://doi.org/10.1146/annurev.ecolsys.37.091305.110215.
Petit R.J., Aguinagalde I., de Beaulieu J.D., Bittkau C., Brewer S., Cheddadi R., Ennos R., Fineschi S., Grivet D., Lascoux M., Mohanty A., Müller-Starck G., Demesure-Musch B., Palmé A., Martín J.P., Rendell S., Vendramin G.G. (2003). Glacial refugia: hotspots but not melting pots of genetic diversity. Science 300: 1563–2035.
Pritchard J.K., Stephens M., Donnelly P. (2000). Inference of population structure using multilocus genotype data. Genetics 155(2): 945–959.
Provan J., Soranzo N., Wilson N.J., McNicol J.W., Forrest G.I., Cottrell J., Powell W. (1998). Gene-pool variation in caledonian and European Scots pine (Pinus sylvestris L.) revealed by chloroplast simple-sequence repeats. Proceedings. Biological Sciences 265(1407): 1697–705. https://doi.org/10.1098/rspb.1998.0491.
Prus-Głowacki W., Urbaniak L., Bujas E., Curtu A.L. (2012). Genetic variation of isolated and peripheral populations of Pinus sylvestris (L.) from glacial refugia. Flora - Morphology, Distribution, Functional Ecology of Plants 207(2): 150–158. https://doi.org/10.1016/j.flora.2011.11.006.
Prus-Glowacki W., Stephan B.R., Bujas E., Alia R., Marciniak A. (2003). Genetic differentiation of autochthonous populations of Pinus sylvestris (Pinaceae) from the Iberian Peninsula. Plant Systematics and Evolution 239(1–2): 55–66. https://doi.org/10.1007/s00606-002-0256-3.
Pyhäjärvi T., Gil G., Rosario M., Knürr T., Mikkonen M., Wachowiak W., Savolainen O. (2007). Demographic history has influenced nucleotide diversity in European Pinus sylvestris populations. Genetics 177(3): 1713–1724. https://doi.org/10.1534/genetics.107.077099.
Pyhäjärvi T., Salmela M.J., Savolainen O. (2008). Colonization routes of Pinus sylvestris inferred from distribution of mitochondrial DNA variation. Tree Genetics and Genomes 4(2): 247–254. https://doi.org/10.1007/s11295-007-0105-1.
Robledo-Arnuncio J.J., Alía R., Gil L. (2004). High levels of genetic diversity in a long-term European glacial refugium of Pinus sylvestris L. Forest Genetics 11(3): 239–248.
Rousset F. (2008). Genepop’007: a complete re-implementation of the genepop software for Windows and Linux. Molecular Ecology Resources 8(1): 103–106. https://doi.org/10.1111/j.1471-8286.2007.01931.x.
Sabor J. (1993). Zmienność sosny zwyczajnej (Pinus sylvestris L.) i hodowlana wartość jej polskich proweniencji w warunkach siedliskowych Beskidu Sądeckiego. [Variability of Scots pine (Pinus sylvestris L.) and breeding value of its Polish provenances in habitat conditions of Beskid Sadecki]. Drukrol Kraków. 187 p.
Savolainen O., Bokma F., Garcı́a-Gil R., Komulainen P., Repo T. (2004). Genetic variation in cessation of growth and frost hardiness and consequences for adaptation of Pinus sylvestris to climatic changes. Forest Ecology and Management 197(1): 79–89. https://doi.org/10.1016/j.foreco.2004.05.006.
Savolainen O., Pyhäjärvi T., Knürr T. (2007). Gene flow and local adaptation in trees. Annual Review of Ecology, Evolution, and Systematics 38(1): 595–619. https://doi.org/10.1146/annurev.ecolsys.38.091206.095646.
Scalfi M., Piotti A., Rossi M., Piovani P. (2009). Genetic variability of Italian Southern Scots pine (Pinus sylvestris L.) populations: the rear edge of the range. European Journal of Forest Research 128(4): 377–386. https://doi.org/10.1007/s10342-009-0273-7.
Sebastiani F., Pinzauti F., Kujala S.T., González-Martínez S.C., Vendramin G.G. (2012) Novel polymorphic nuclear microsatellite markers for Pinus sylvestris L. Conservation Genetics Resources 4(2): 231–234. https://doi.org/10.1007/s12686-011-9513-5.
Sinclair W.T., Morman J.D., Ennos R.A. (1999). The postglacial history of Scots pine (Pinus sylvestrisn L.) in western Europe: evidence from mitochondrial DNA variation. Molecular Ecology 8(1): 83–88. https://doi.org/10.1046/j.1365-294X.1999.00527.x.
Skrzyszewski J. (2004). Charakterystyka morfologiczno-przyrostowa sosny zwyczajnej (Pinus sylvestris L.) w polskiej części Karpat i Sudetów. [Characteristic of morphological and incremental of Scots pine (Pinus sylvestris L.) in the Polish Carpathians and Sudeten]. Zeszyty Naukowe Akademii Rolniczej w Krakowie. 155 p.
Soranzo N., Provan J., Powell W. (1998). Characterization of microsatellite loci in Pinus sylvestris L. Molecular Ecology 7(9): 1260–1261.
Soranzo N., Alia R., Provan J., Powell W. (2000). Patterns of variation at a mitochondrial sequence-tagged-site locus provides new insights into the postglacial history of European Pinus sylvestris populations. Molecular Ecology 9(9): 1205–1211. https://doi.org/10.1046/j.1365-294x.2000.00994.x.
Staszkiewicz J. (1961). Variation in recent and fossilcones of Pinus silvestris L. Fragmenta Floristica et Geobotanica 7: 97–160.
Szeligowski H., Buraczyk W., Drozdowski S., Gawron L. (2016). Zmienność sosny zwyczajnej (Pinus sylvestris L.) w doświadczeniu serii IUFRO 1982 w Nadleśnictwie Rogów. [Variability of Scots pine (Pinus sylvestris L.) provenances in the IUFRO 1982 series experiment in Rogów Forest District]. Sylwan 160(3): 230–237.
Tiago A., Lopes A., Lopes R.J., Ricardo J., Beja-Pereira A., Luikart G. (2008). LOSITAN: a workbench to detect molecular adaptation based on a Fst-outlier method. BMC Bioinformatics 9(1): 1–5. https://doi.org/10.1186/1471-2105-9-323.
Van Oosterhout C., Hutchinson W.F., Wills D.P.M., Shipley P. (2004). Micro-checker: software for identifying and correcting genotyping errors in microsatellite data. Molecular Ecology Notes 4(3): 535–538. https://doi.org/10.1111/j.1471-8286.2004.00684.x.
Wachowiak W., Balk P., Savolainen O. (2009). Search for nucleotide diversity patterns of local adaptation in dehydrins and other cold-related candidate genes in Scots pine (Pinus sylvestris L.). Tree Genetics and Genomes 5(1): 117–132. https://doi.org/10.1007/s11295-008-0188-3.
Wachowiak W., Salmela M.J., Ennos R.A., Iason G., Cavers S. (2011). High genetic diversity at the extreme range edge: nucleotide variation at nuclear loci in Scots pine (Pinus sylvestris L.) in Scotland. Heredity 106(5): 775–787. https://doi.org/10.1038/hdy.2010.118.
Wachowiak W., Wόjkiewicz B., Cavers S., Lewandowski A. (2014). High genetic similarity between Polish and North European Scots pine (Pinus sylvestris L.) populations at nuclear gene loci.Tree Genetics and Genomes 10(4): 1015–1025. https://doi.org/10.1007/s11295-014-0739-8.
Wang X., Szmidt A.E., Lindgren D. (1991). Allozyme differentiation among populations of Pinus sylvestris (L.) from Sweden and China. Hereditas 114(3): 219–226. https://doi.org/10.1111/j.1601-5223.1991.tb00328.x.
Willis K.J., Van Andel T. (2004). Trees or no trees? The environments of Central and Eastern Europe during the last glaciation. Quaternary Science Reviews 23(23–24): 2369–2387. https://doi.org/10.1016/j.quascirev.2004.06.002.
Wójkiewicz B., Cavers S., Wachowiak W. (2016a). Current approaches and perspectives in populationgenetics of Scots Pine (Pinus sylvestris L.). Forest Science 62(3): 343–354. https://doi.org/10.5849/forsci.15-040.
Wójkiewicz B., Litkowiec M., Wachowiak W. (2016b). Contrasting patterns of genetic variation in core and peripheral populations of highly outcrossing and wind pollinated forest tree species. AoB PLANTS 8:plw054. https://doi.org/10.1093/aobpla/plw054.
Zhou Y., Bui T., Auckland L.D., Williams C.G. (2002). Undermethylated DNA as a source of microsatellites from a conifer genome. Genome 45(1): 91–99. https://doi.org/10.1139/g01-119.
Total of 66 references.
