Jori Uusitalo  ,
Jari Ala-Ilomäki
,
Jari Ala-Ilomäki
The significance of above-ground biomass, moisture content and mechanical properties of peat layer on the bearing capacity of ditched pine bogs
Uusitalo J., Ala-Ilomäki J. (2013). The significance of above-ground biomass, moisture content and mechanical properties of peat layer on the bearing capacity of ditched pine bogs. Silva Fennica vol. 47 no. 3 article id 993. https://doi.org/10.14214/sf.993
Abstract
Intensive utilisation of peatland forests calls for logging activities to be increasingly carried out in conditions other than those in harsh winter. The low bearing capacity of peatlands forms a severe obstacle for the prevailing harvesting machinery. The aim of this study was to clarify and quantify the significance of above-ground biomass, brash mat, moisture content and mechanical properties of peat layer on the bearing capacity of pine bogs. In-situ driving tests were conducted in Western Finland on a pine bog covering a large variation of growing stock. Portable tools were tested for measuring strength properties of the top layer of peat. According to the results, shear modulus of top layer of peat, volume of trees and the existence of cutting debris are the most important factors affecting bearing capacity. Spiked shear vane was shown to be a promising tool in predicting the strength properties of peat soil.
Keywords
logging;
peatland;
tree harvesting;
trafficability
-
Uusitalo,
Finnish Forest Research Institute, Parkano Unit, Kaironiementie 15, FI-39700 Parkano, Finland
E-mail
jori.uusitalo@metla.fi
- Ala-Ilomäki, Finnish Forest Research Institute, Vantaa Unit, P.O. Box 18, FI-01301 Vantaa, Finland E-mail jari.ala-ilomaki@metla.fi
Received 20 February 2013 Accepted 25 June 2013 Published 17 September 2013
Views 107363
Available at https://doi.org/10.14214/sf.993 | Download PDF

1 Introduction
Peatlands are problematic from logging operation point of view. The mean tree size and stand density are generally lower than on mineral soils, leading to low harvesting removal. The ditch network forms obstacles to vehicle mobility and the average primary transportation distance is generally double compared to mineral soils (Sirén and Tanttu 2001). The low bearing capacity (the strength of soil to prevent vehicles from sinking into it), is, however, the most significant factor affecting timber harvesting. Operating conditions lead to poor vehicle mobility (the ability of a vehicle to travel from point A to point B) and poor terrain trafficability (the ability of the terrain to support vehicular traffic).
In recent decades, the Finnish wood industry has directed its logging activities mainly at mineral soil forests. The pronounced reduction of suitable logging sites on mineral soils will, however, force the industry to increase the volume of logging activities in peatland forests. More intensive utilisation of peatland forests calls for logging activities to be increasingly carried out in conditions other than harsh winters, when the topmost layer of peatland is frozen and snow cover reduces the pressure exerted on peatland by the vehicle.
Peatland usually consists of a top layer with living and slightly decomposed plant residues, followed by a layer of decomposed peat and, finally, mineral soil. In drained peatlands the thickness of the top layer including the roots is only 10–20 cm (Laiho and Finér 1996). The porosity of peat is high, easily leading to high water content (Päivänen 1973). From the bearing capacity point of view, the top layer with considerable tensile strength provided by roots of trees and shrubs is essential, the supporting function of the decomposed peat being of secondary importance (Ala-Ilomäki 2006). The strength of the top layer is subject to the variation of density and species of the vegetation, resulting in extreme spatial variation in trafficability (Ala-Ilomäki 2006).
The root system of Scots pine (Pinus sylvestris) on peatland has been found to differ from that of mineral soil. On peatland pines usually lack the main tap root and the root system is more superficial (Laitakari 1927). On pine bogs, roots are found in the topmost part of the peat layer. A very small amount of roots are generally found deeper than 20 cm below the surface. The root layer typically comprises roots of Scots pine, white birch (Betula pubescens), mire dwarf shrubs (e.g. Betula nana, Ledum palustre, Vaccinium uliginosum) and Cyperaceae (Carex spp. sedges and cottongrass, Eriophorum vaginatum) (Laiho and Finér 1996).
The proportion of biomass allocated to the root system is greater on peatland than mineral soil (Paavilainen 1980). Moreover, on peatland the relation of both living and dead root biomass to tree volume increases with decreasing site fertility (Finér and Laine 1998, 2000). It has also been shown that on Scots pine-dominated bogs, the fine root biomass of shrub layer alone may equal that of the tree layer (Paavilainen 1980; Laiho and Finér 1996). Amongst other dominant tree species, white birch (Betula pubescens) has been found to have more fine roots than Scots pine (Heikurainen 1958; Finér 1989).
The reinforcement effect provided by roots is sensitive to loading and diminishes with an increasing number of vehicle passes (Cofie et al. 2000). The form of the stress-strain curve of roots has been found to be independent of the diameter of roots but the incremental plastic strain in cyclic loading tends to decrease with increasing root diameter (Makarova et al. 1998). The strength of peat is dependent on water content and the extent of decomposition. The vane shear strength of peat decreases with increasing moisture content and degree of decomposition (Saarilahti 1982).
The bearing capacity of peatland is subject to high variation, both within stand and between stands. Accordingly, several research efforts have focused on measuring and predicting the bearing capacity of peatland. Various methods of measurement and types of equipment, including the plate load test, shear vane, penetrometer and radiological methods have been tested to indicate the strength of peatland (Lee and Jarret 1978; Wong et al. 1982; Saarilahti 1982; Sirén et al. 1987).
Plate load test devices measuring pressure-sinkage relationship are widely used in research purposes (e.g. Lee and Jarret 1978; Ala-Ilomäki 2006; Zeleke et al. 2007). They are rather reliable in estimating the stiffness of the topsoil. These devices are however quite impractical, since they usually have to be mounted on an off-road vehicle. On peaty soil where topsoil is stronger than the subsoil, the device gives poor estimation of the properties of the subsoil (Zeleke et al. 2007). A cone penetrometer is a device that measures the resisting force of soil to the penetration a conical tip at a controlled rate. The device is very widely used both in practice and research purposes (e.g. Saarilahti 1982; Nugent et al. 2003; Bygden et al. 2004). In peaty soils the penetrometer gives poor estimations on the properties of the topsoil since the small conical tip easily fails to detect the individual roots.
The mobility of forwarders on peatland has been studied extensively. Comprehensive in-situ driving tests have been arranged to compare the mobility of vehicles (Sirén et. al. 1987; Ala-Ilomäki et al. 2011), to predict the mobility of vehicles in various types of peatland (Nugent et al. 2003; Zeleke et al. 2007), to compare the effect of wheels and bogie tracks on rut formation (Bygden et al. 2004; Suvinen 2006b, Ala-Ilomäki et al. 2011), or to utilise the data recorded by the harvester to assist in planning the routes of the forwarder (Suvinen 2006a, Suvinen and Saarilahti 2006; Uusitalo et al. 2010; Ala-Ilomäki et al. 2012). Despite rather active research in this area, most studies have measured a rather limited number of properties of peat layer or related tree characteristics affecting them. In his doctoral thesis, Saarilahti (1982) discussed rather broadly the role of individual properties of peat on bearing capacity in drained peatlands, but empirical tests to verify the relationships were rather limited. Ala-Ilomäki et al. (2011) recently studied the performance of different sets of chain/track equipment in enhancing the mobility of forwarders, and measured the properties of peat layer more extensively than in most previous studies. A comprehensive understanding of the role of factors affecting the bearing capacity of pine bogs is still lacking, however. The aim of this study was to clarify and quantify the significance of above-ground biomass, brash mat, moisture content and mechanical properties of peat and root layer on the bearing capacity of pine bogs.
2 Materials and methods
Field studies were conducted on a drained peatland in Kankaanpää in Western Finland (61°45´N, 22°30´E). The study area had been drained in early 1960s and the ditches had been cleaned in the late 1980s. The selected area covered a large variation in growing stock (Table 1). The study area had a ditch network with 30 m spacing. In the study area, three test sites were selected. Each test site included 3 to 6 straight test trails, 100 m in length. The test trails had four sample plots, 10 m in length and 20 m in width, placed parallel to the test trails. A line was placed in the middle of the sample plots, indicating the centre line of the study trail. Along this line, five sample points were marked on the ground at 2 m intervals, the first sample point located 1 m and the last sample point 9 m from the beginning of the plot.
| Table 1. The main characteristics of the study stands. | ||||||
| Study site | Study trail | Number of sample plots | Volume of trees, Vplot m3/ha | Stem density n/ha | Dry mass of logging residues kg/ha | Site type a) |
| 1 | 1 | 4 | 104 | 1865 | 17200 | Vatkg |
| 1 | 2 | 4 | 64 | 1350 | 9100 | Vatkg |
| 1 | 3 | 4 | 79 | 1688 | 9100 | Vatkg |
| 1 | 4 | 4 | 76 | 1103 | 9500 | Vatkg |
| 2 | 1 | 3 | 160 | 1193 | 21700 | Ptkg |
| 2 | 2 | 4 | 130 | 1302 | 17300 | Ptkg |
| 2 | 3 | 4 | 129 | 1760 | 15500 | Ptkg |
| 2 | 4 | 4 | 112 | 1307 | 13500 | Ptkg |
| 2 | 5 | 4 | 115 | 960 | 13700 | Ptkg |
| 2 | 6 | 4 | 122 | 1060 | 11400 | Ptkg |
| 3 | 1 | 4 | 184 | 1497 | 31000 | Ptkg |
| 3 | 2 | 4 | 126 | 1142 | 20600 | Ptkg |
| 3 | 3 | 4 | 170 | 1360 | 28600 | Ptkg |
| 3 | 4 | 4 | 139 | 1228 | 22100 | Ptkg |
| a) Site type classification according to Laine and Vasander (2005). | ||||||
Properties of the sample plots were measured prior to the test drives. The most important tree characteristics (species, diameter at breast height, tree height and age) and thickness of peat layer was determined. In addition to these, the ground coverage of mire dwarf shrubs (Ledum palustre L., Calluna vulgaris, Betula nana L., Vaccinium uliginosum, Vaccinium myrtillus, Vaccinium vitis-idaea) were estimated visually with ten 0.5 m2 vegetation sample areas per plot. The vegetation sample area centres were placed at the sample points, one metre to the left and right from the centre line. No stumps or large superficial roots were allowed on the vegetation sample areas. The location of the areas was adjusted accordingly. The mean of the ten samples were used as the variable describing the coverage of mire dwarf shrubs within the plot (variable name in the latter Shrubsplot).
Strength characteristics and moisture content of peatland were measured at each sample point (five replications per sample plot). Three measurement devices were employed to measure the mechanical strength.
Firstly, the modulus of elasticity was measured with a manually operated plate loading device (Fig. 1). The diameter of the plate applied was 0.07 m. The measurement of loading was accomplished with a commercial load cell and the penetration depth was measured with a string actuated potentiometer. The rate of penetration into the soil was uncontrolled. Deviation from the perpendicular position of the device in relation to the soil surface may have resulted in a slight error in sinkage measurement, as the string of the potentiometer was attached to the ground.
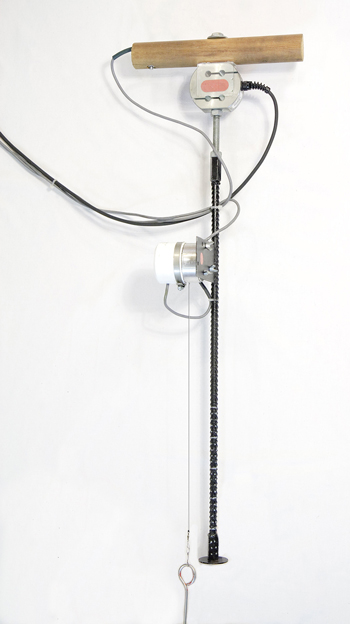
Fig. 1. Manually operated plate loading device.
In the plate loading of peatland with a root mat, the pressure-sinkage relationship is characterised by a near linear phase after the initial compression of loose material, such as moss, on top of the peatland. The linear phase ends at the root mat puncture, followed by a rapid decline in pressure until the nearly constant response of decomposed peat material is detected (Ala-Ilomäki 2006). The modulus of elasticity on the linear part of the pressure-sinkage curve was chosen to describe peatland strength and is calculated as follows (Wu 1966; Ala-Ilomäki 2005, 2006):
![]()
![]()
![]()
where
b = Slope of the increasing pressure, kg m–1s–2
E = Modulus of elasticity, kPa
p = Pressure, kPa
r = Radius of the loading plate, m
z = Sinkage, m
Secondly, the shear properties of the surface layer were assessed. Shear properties of the root mat of peatland are determined by the tensile strength of the roots and other parts of plants in the layer. To avoid cutting these, a spiked shear vane newly developed at the Finnish Forest Research Institute (Ala-Ilomäki et al. 2011) on the basis of the muskeg fluke described by Radforth (1969), was applied. In the vane head, rows of vertical steel spikes are attached perpendicular to a circular steel plate to replace the blades of a conventional shear vane (Fig. 2). Their tips are tapered to facilitate penetration into the surface layer while causing minimal damage to the roots. The vane head is inserted into the peat, the top plate flush to the soil surface so, that loose material on top of the peatland is compressed. The device is rotated manually using a commercial torque wrench equipped with strain gauge measurement of torque and gyroscopic measurement of angular rotation.

Fig. 2. Spiked shear vane for measuring the shear modulus of the root layer of peatland.
The number of the 0.012 m diameter spikes was 7 per row, and their length 0.17 m. This arrangement of evenly pitched spikes resulted in a soil sample 0.19 m in diameter and 0.17 m in height to be subjected under shear stress. The targeted angle of rotation was 5 to 15 degrees, well below the point of ultimate shearing. The device was remarkably easy to use as the operator only needed to increase the load steadily until a sufficient rotation angle was reached. Normally this corresponded to a torque in the region of 100 Nm, which is also felt in the muscles when reached. Measurements were easy to perform in a consistent manner.
Shear modulus was calculated on the basis of measured torque as follows:

where
G = Shear modulus, kPa
H = Height of specimen, m
R = Radius of specimen, m
T = Torque, Nm
α = Angle of rotation, rad
Thirdly, cone penetration resistance (CPR) was measured with a commercially available FieldScout SC900 cone penetrometer, consisting of a 1.27 cm diameter rod and a 30-degree cone with a base area of 3.23 cm2. The penetrometer includes a load cell and an ultrasonic depth sensor that captures readings in 2.5 cm increments. The mechanical and acoustic properties of the surface of peatland are soft. To create a reliable and uniform reference point for the measurement, the operator stood on a 30 cm by 30 cm piece of plywood and took the measurement through a hole in the centre of the plywood. The mean of the readings 0…20 cm below the surface of the soil, the loose material on top being compressed by the operator’s weight loading the piece of plywood, were used as the final CPR value. Zero readings from porous spots of the compacted surface were deleted from the data.
The moisture of the peat layer, down to the depth of 20 cm below the surface, was measured with a portable, electronic soil moisture probe TDR300 using 20-cm-long rods. The device converts measured dielectric properties into volumetric water content (VWC). The device had been calibrated to give reliable estimates of VWC in peat soil. The handle that the rods are attached to was pushed quite heavily against the ground, meaning that the living moss is compressed into a 1–3 cm-thick layer. The measurement is the mean VWC of compressed living moss (1–3 cm) and upper level of peat (17–19 cm). The water table level (GWT) was measured at 12 spots around the study area (only one sample per each forwarder study trail). Plastic tubes with small holes on the wall were placed in the centre of the sample plot allowing accurate measurement of the water table level. Later in the text, the parameters Epoint, Gpoint, CPRpoint and VWCpoint refer to individual measurements, while Eplot, Gplot, CPRplot and VWCplot is the mean of five measurements within the plot, respectively.
Harvesting and test drives were carried out in August 2009. The site was harvested with a 6-wheeled John Deere 1270D harvester, with boom reach of 10 m and equipped with tracks on the front bogie and chains on the rear wheels. Technical details of the machine are given in Table 2. Eqs. 5 and 6 were used to calculate the Nominal Ground Pressure (NGP).

![]()
where
F = Load, kN
R = Wheel radius, m
L = Bogie wheelbase, m
B = Wheel or track width, m
The area was harvested by an experienced operator. The harvester worked with two different work methods. In the first method, trees were processed in front of the harvester so that all harvesting residue accumulated on the logging trail forming protective slash cover, a brash mat. In the other method, the harvester processed trees outside the logging trail so that all harvesting residual was left outside the trail and no brash mat was thus formed on the trail. A binary variable Brash mat is given the value 1 in the former case and 0in the latter case. In both methods, all trees were first removed from the logging trail with a nominal width of 4.5 m. Stand up to ten metres from the trail centre line was then thinned according to the normal thinning procedure. The automatic measurement and bucking optimisation system stored the profiles of the removed stems in the STM-format.
After harvesting, the depth of the ruts caused by the harvester at each sample point was measured. To achieve a reference level for the measurements, a straight pole was first laid above the ground in a horizontal position on top of two 80 cm-long poles hammered into the ground on both sides of the logging trail. The reference distance to the ground was measured from both sides of the logging trail and in the middle between the ruts. The vegetation layer of the peat soil is dominated by moss with very soft texture. Therefore, the distance from the straight pole to the ground level was measured while the measurer was standing by the measurement spot with his legs slightly apart and the surface of the ground between his feet was defined as the ground level. The mean rut depth at each sample point (RutHarvpoint) was calculated by subtracting the mean distance to the ground from the mean distance to the bottom of the rut. The mean harvester rut depth for the sample plot (RutHarvplot) is the mean of five rut depth points (RutHarvpoint) within the sample plot.
| Table 2. Technical data for the machines used in the study. | ||||
| Equipment | John Deere 1270D harvester | John Deere 1110D forwarder | ProSilva 15-4ST forwarder | |
| Front axle | Number of wheels | 4 | 4 | - |
| Tyres | 710/40-22.5 | 710/45-26.5 | - | |
| Tracks | Clark Terra TL-85 | Clark Terra TL85 | excavator type | |
| Track width, mm | 730 | 780 | 810 | |
| Length of track soil contact on hard ground, mm | 2200 | |||
| Net mass with tracks or chains, kg | 10160 | 12280 | 9140 | |
| NGP, kPa | 50 | 52 | 25 | |
| Rear axle | Number of wheels | 2 | 4 | |
| Tyres | 650/60-26.5 | 710/45-26.5 | ||
| Tracks | Terra-X TXL150 | excavator type | ||
| Track width, mm | (wheel chains) | 887 | 810 | |
| Length of track soil contact on hard ground, mm | 2700 | |||
| Net mass with tracks or chains, kg | 7240 | 9940 | 10120 | |
| Mass of load, kg | - | 8500 | 8000 | |
| NGP, kPa (unloaded/loaded) | 74 | 32/59 | 23/41 | |
Two types of forwarder, an 8-wheeled John Deere 1110D and a tracked ProSilva 15-4ST prototype, were used in the tests. Technical details of the machines are given in Table 2. The ProSilva 15-4ST forwarder prototype has excavator type tracks and it has several new features that improve mobility on soft soils. The machine has no frame oscillation joint (newer versions of the machines have an active joint which can be locked on soft terrain), which helps in distributing the load more evenly on all four tracks. The leaf spring suspension of the tracks promotes ground contact on all tracks. The excavator track units are allowed to roll and the edges of the track shoes are bent, both reducing shearing of the soil. The tracks were 810 mm wide and the length of soil contact on hard ground was approximately 2200 mm at the front and 2700 mm at the rear. The net mass was 9140 kg at the front and 10 120 kg at the rear. Eq. 7 was used in calculating NGP for ProSilva forwarder:
![]()
where
LT = Length of track soil contact on hard ground, m
On the test sites, every other trail was driven by John Deere and every other by ProSilva. Forwarders drove first unloaded and then loaded (masses of the loads are given in Table 2). Some trails were excluded from the forwarder tests, since their bearing capacity was judged too poor. Rut depth was measured after each pass. The measurements were carried out with same technique as with the harvester tests, with the exception that ground level was not measured repeatedly. For modelling purposes, one general dependent variable was formed: rut depth of forwarder (RutForwpoint or RutForwplot) is the depth of the rut after one harvester pass, one forwarder pass unloaded and one forwarder pass loaded. A binary variable forwarder type takes the value “Wheeled forwarder” in the case of the John Deere and “Tracked forwarder” in the case of the ProSilva.
After the test drives, all the remaining trees on the study plots were measured for diameter at breast height (dbh). In addition, 30 extra trees, chosen evenly from each study site, were measured for dbh, crown height and tree height. The volume of trees on the plot (Vplot) is the sum of all the harvested and remaining trees. The volume of the remaining trees was converted to cubic metres by dbh using taper equations by Laasasenaho (1982). The volume of each harvested tree was calculated by utilising the harvester stem profile data (STM-format). It gives the diameter of the stem profile in 10 cm intervals, enabling the cubing of trees by summing up 10 cm-long sections. The dry mass of the logging residue of each harvested tree was estimated using the diameter at breast height measured by the harvester and the biomass estimation equations by Repola et al. (2007). Individual tree height and crown height values for biomass equations were estimated by applying Näslund’s (1937) equation and calibrating individual dbh-tree height and a dbh-crown height models for the study area.
Statistical data analysis included correlation analysis and the mixed modelling technique. The models predicting rut depth after forwarding are based on data from 9 trails given in Table 4 while models predicting rut depth after harvesting are based on data from all 14 trails. The data has nested structure. Let i be the measurement point within sample plot j, within trail k and within site l.
The basic form of the mixed model predicting rut depths was:
![]()
where
RutHarvijkl(or RutForwijkl) = Dependent variable for rut depth in measurement point i
b0 = Constant
b = (Row) vector of the (fixed) regression coefficients
X = (Column) vector of the continuous and binary explanatory variables
ujkl = Random term for plot i within trail k within site l
vkl = Random term for trail k within site l
yl = Random term for site l
eijkl = Residual term
The mixed model analyses were carried out with the IBM SPSS v.20 software using the Linear Mixed Models procedure and applying the Maximum Likelihood (ML) estimation method. The following explanatory variables were tested to predict RutForwijkl and RutHarvijkl: Vplot, Gpoint, Epoint, CPRpoint, VWCpoint, Peat depth, Shrubsplot, Brash mat (binary) and Forwarder type (binary). No transformations were made for the dependent variables, since they seemed to follow the normal distribution rather well and no heteroscedasticity within the residuals was found. Instead, the independent variables were logarithmically transformed and the logarithmical transformations (e.g. lnVplot, lnGpoint, lnEpoint, lnCPRpoint, lnVWCpoint) were used in the models instead of the original value, provided they gave better fit. It was discovered that the most suitable model structure for predicting RutHarvijkl comprises brash mat as a binary variable and a set of the most important continuous variables indicating properties of peat soil. When predicting RutForwijkl, Brash mat and Forwarder type was chosen as the most suitable binary parameters.
3 Results
3.1 Means, variations, covariations and correlations of the site conditions and rut depths
Average site conditions on the study trails are given in Table 3. The average thickness of the peat layer in the area was more than 2 metres. Since the logging operation was carried out at the beginning of August, the ground water table level and moisture content of the top layer of peat were relatively low. The mechanical properties and moisture content have large variation, with standard deviations roughly one-third of the mean with all four variables (Epoint, Gpoint, CPRpoint and VWCpoint).
| Table 3. Means of the main factors of the peat land in the study trails. Gpoint = Shear modulus of measurement point, Epoint = Modulus of elasticity of measurement point, CPRpoint = Cone penetration resistance of measurement point, VWCpoint = Volumetric water content of measurement point, GWT = Ground water table level, Peat depth = Depth of peat layer and Shrubsplot = Coverage of mire dwarf shrubs within the plot. | ||||||||
| Study site | Study trail | Gpoint | Epoint | CPRpoint | VWCpoint | GWT | Peat depth | Shrubsplot |
| Mean (std.dev.) KPa | Mean (std. dev.) KPa | Mean (std. dev.) KPa | Mean (std. dev.) % | Mean cm | Mean cm | Mean % | ||
| 1 | 1 | 43.1 | 91.3 | 271 | 55.4 | 41 | 290 | 26.3 |
| 2 | 39.5 | 111 | 249 | 57.0 | - | 269 | 15.0 | |
| 3 | 44.2 | 232 | 60.3 | - | 284 | 38.6 | ||
| 4 | 40.2 | 89.1 | 237 | 49.1 | 40.3 | |||
| All | 41.8 (15.8) | 96.8 (33.4) | 247 (89.1) | 55.5 (11.5) | 40.6 | 286 | 29.4 | |
| 2 | 1 | 45.6 | 95.0 | 392 | 45.1 | 65.7 | 138 | 33.3 |
| 2 | 35.4 | 62.7 | 159 | 37.0 | 60.8 | 155 | 20.0 | |
| 3 | 31.8 | 69.6 | 219 | 44.4 | 59.0 | 166 | 18.3 | |
| 4 | 47.5 | 93.2 | 257 | 33.9 | 57.8 | 198 | 13.8 | |
| 5 | 47.5 | 93.2 | 265 | 43.1 | 59.5 | 171 | 16.3 | |
| 6 | - | - | 253 | 47.4 | 62.0 | 164 | 22.5 | |
| All | 37.0 (18.1 | 76.5 (35.4) | 251 (110) | 41.7 (16.2) | 60.3 | 167 | 20.2 | |
| 3 | 1 | 37.1 | 75.0 | 343 | 37.3 | - | 190 | 22.5 |
| 2 | 30.9 | 41.4 | 252 | 37.6 | - | 206 | 8.75 | |
| 3 | 48.3 | 75.9 | 317 | 43.1 | - | 188 | 10.0 | |
| 4 | 36.4 | 93.9 | 289 | 40.4 | - | 178 | 12.5 | |
| All | 38.2 (16.4) | 71.6 (37.1) | 300 (138) | 39.6 (9.26) | 68.4 | 190 | 13.4 | |
| All | 38.9 (16.9) | 81.4 (36.8) | 265 (116) | 45.1 (14.7) | 58.0 | 208 | 20.9 | |
The average rut depth caused by the harvester (RutHarvplot) and forwarders (RutForwplot) are given in Table 4. The average rut depth of the harvester varied from 7.0 cm to 29.4 cm and rut depth after forwarding from 9.0 cm to 32.3 cm.
The correlations between rut depth (RutHarvplot) and average site conditions at plot level are given in Table 5. Volume of trees (Vplot), moisture content (VWCplot) and Peat depth were negatively correlated with rut depth on bare ground (RutHarvplot,Brash mat = 0). The coverage of mire dwarf shrubs (Shrubsplot) was also correlated with VWCplot. Spiked shear vane measured shear modulus (Gplot) had no correlation with the volume of trees (Vplot). There was a positive but non-significant correlation between the coverage of mire dwarf shrubs (Shrubsplot) and Gplot. Eplot was positively correlated with VWCplot and Peat depth and had negative correlation with Vplot. Similarly with the Gplot, Eplot had moderate but non-significant correlation with the coverage of mire dwarf shrubs (Shrubsplot). Cone penetration resistance (CPRplot) correlated rather poorly with the characteristics of the peat soil. There was positive but not significant correlation between Vplot and CPRplot. CPRplot and Gplot were negatively correlated with the rut depth of the harvester (RutHarvplot) but there was no correlation between Eplot and RutHarvplot.
| Table 4. Means of rut depths by study trails. RutHarvplot = Mean of rut depths caused by harvester within the sample plot and RutForwplot = Mean of rut depths after one harvester pass, one forwarder pass unloaded and one forwarder pass loaded within the sample plot. For study site 1, study plots with (Brash mat = 1) and without brash mat (Brash mat = 0) are given separately. | |||||
| Study site | Study trail | Brash mat | Forwarder type | RutHarvplot cm | RutForwplot cm |
| 1 | 1 | 1 | Tracked forwarder | 10.4 | 12.1 |
| 0 | Tracked forwarder | 18.6 | 22.9 | ||
| 2 | 1 | 11.1 | - | ||
| 0 | 18.5 | - | |||
| 3 | 1 | 13.8 | - | ||
| 0 | 29.4 | - | |||
| 4 | 1 | Tracked forwarder | 9.6 | 15.8 | |
| 0 | Tracked forwarder | 19.1 | 26.9 | ||
| 2 | 1 | 1 | Tracked forwarder | 7.0 | 9.0 |
| 2 | 1 | Wheeled forwarder | 11.7 | 17.7 | |
| 3 | 0 | Wheeled forwarder | 23.7 | 32.3 | |
| 4 | 0 | Tracked forwarder | 24.1 | 24.4 | |
| 5 | 1 | Wheeled forwarder | 8.2 | 17.8 | |
| 6 | 1 | 7.5 | |||
| 3 | 1 | 1 | 8.7 | - | |
| 2 | 0 | 13.8 | - | ||
| 3 | 0 | Tracked forwarder | 13.6 | 17.7 | |
| 4 | 1 | Tracked forwarder | 13.5 | 16.0 | |
| Mean | 12.5 | 17.7 | |||
| Table 5. Correlation coefficients between rut depth, mechanical properties of peat soil and factors affecting the mechanical properties. P-values and number of observations are given in the rows below the coefficient. Values printed in bold indicate significant correlation. Vplot = Volume of trees within the plot, Peat depth = Depth of peat layer, Shrubsplot = Coverage of mire dwarf shrubs within the plot, VWCplot = Mean of volumetric water content within the plot, CPRplot = Mean of cone penetration resistance within the plot, Eplot = Mean of modulus of elasticity within the plot, Gplot = Mean of shear modulus within the plot, RutHarvplot = Mean of rut depths caused by harvester within the sample plot with brash mat (Brash mat = 1) and without brash mat (Brash mat = 0). | |||||||||
| Vplot (m3/ha) | Peat depth (cm) | Shrubsplot (%) | VWCplot (%) | CPRplot (KPa) | Eplot (KPa) | Gplot (KPa) | RutHarvplot Brash mat = 0 (m) | RutHarvplot Brash mat = 1 (m) | |
| Vplot (m3/ha) | 1 | –0.571 0.000 55 | –0.205 0.133 55 | –0.476 0.000 55 | 0.281 0.038 55 | –0.357 0.010 | –0.065 0.650 51 | –0.451 0.018 27 | –0.171 0.395 28 |
| Peat depth (cm) | 1 | 0.297 0,028 55 | 0.555 0.000 55 | –0.083 0.548 55 | 0.364 0.009 51 | 0.157 0.270 51 | 0.407 0.035 27 | –0.008 0.968 28 | |
| Shrubsplot (%) | 1 | 0.411 0.002 55 | –0.021 0.878 55 | 0.264 0.061 51 | 0.194 0.174 51 | 0.060 0.764 27 | –0.037 0.855 28 | ||
| VWCplot (%) | 1 | –0.120 0.382 55 | 0.563 0.000 51 | 0.382 0.006 51 | 0.329 0.093 27 | –0.125 0.533 28 | |||
| CPRplot (kPa) | 1 | 0.233 0.100 55 | 0.203 0.153 55 | –0.465 0.014 27 | –0.134 0.506 28 | ||||
| Eplot (kPa) | 1 | 0.507 0.000 51 | –0.046 0.819 27 | –0.065 0.764 28 | |||||
| Gplot (kPa) | 1 | –0.282 0.155 27 | –0.456 0.025 28 | ||||||
| RutHarvplot Brash mat = 0 (m) | 1 | 0 | |||||||
| RutHarvplot Brash mat = 1 (m) | 1 | ||||||||
3.2 Mixed-models predicting rut depth
The best models for predicting rut depth after one harvester pass (RutHarvijkl) are presented in Table 6. The brash mat played a very important role in preventing rut formation. According to models, after one harvester pass without the brash mat, the ruts are approximately 9 cm deeper than with the brash mat. Gpoint, Vplot and VWCpoint are the best individual continuous predictors but with all these variables, logarithmic transformations (lnGpoint, lnVplot and lnVWCpoint) gave better fit than the original values. The three models presented in Table 3 are in the same level in goodness-of-fit (AIC). Differences in the structure of these three models also indicate that the main predictors have interaction on strength properties of peatland. Overall, lnGpoint, lnVplot and lnVWCpoint rather poorly predict the rut depths after one harvester pass. There seems to be significant variation between the study plots (ujkl) but insignificant variation between the study trails (vkl) and between the study sites (yl).
| Table 6. Mixed-linear models predicting rut depths after one harvester pass (RutHarvijkl). N = 255. Gpoint = Shear modulus of measurement point, Vplot = Volume of trees within the plot, VWCpoint = Volumetric water content of measurement point, Brash mat is a binary variable that takes the value 1 in the case study plot has brash mat and 0 in the case study plot has no brash mat, “ * ” is the symbol of multiplication, var(ujkl) = variance of the plot, var(vkl) = variance of trail, var(yl) = variance of site, var(eijkl) = residual variance and AIC = Akaike’s Information Criterion. | ||||||
| Model | 1 | 2 | 3 | |||
| Parameter | Estimate (SE) | Sig. | Estimate (SE) | Sig. | Estimate (SE) | Sig. |
| Fixed | ||||||
| Intercept | 32.7 (12.4) | .013 | 39.6 (13.3) | .001 | –224 (107) | .038 |
| lnGpoint | –1.59 | .210 | 70.9 (29.7) | .018 | ||
| lnVplot | –4.68 (2.57) | .078 | –4.93 (2.52) | .060 | 25.9 (15.6) | .098 |
| lnVWCpoint | 31.4 (14.8) | .035 | ||||
| lnVplot * lnGpoint | –8.48 (4.22) | .046 | ||||
| lnGpoint * lnVWCpoint | –8.63 (4.15) | .039 | ||||
| [Brash mat = 0] | 9.09 (1.63) | .000 | 8.87 (1.61) | .000 | 9.04 (1.61) | .000 |
| [Brash mat = 1] | 0 | 0 | 0 | |||
| Random | ||||||
| var(ujkl) | 11.7 (4.52) | .010 | 11.2 (4.43) | .005 | 10.9 (4.31) | .012 |
| var(vkl) | 7.24 (4.90) | .140 | 7.00 (4.66) | 7.06 (4.76) | .138 | |
| var(yl) | .000 | .000 | .000 | |||
| var(eijkl) | 38.6 (3.82) | .000 | 38.6 (3.83) | .000 | 37.6 (3.73) | .000 |
| AIC | 1728.2 | 1728.6 | 1728.3 | |||
The best models predicting rut depth after one harvester pass followed by two forwarder passes (RutForwijkl) are presented in Table 7. Here the brash mat also played a very important role in preventing rut formation. Without the brash mat, the ruts are approximately 8 to 14 cm deeper than with the brash mat. Ruts caused by the wheeled forwarder with band tracks are clearly deeper than those caused by the fully-tracked forwarder. The difference after two forwarder passes is 4 to 8 cm, and it is greater on the test trails without the brash mat. lnVplot was the best individual continuous predictor (model 1). Adding lnVWCpoint (model 2) and lnGpoint (model 3) to the model that already includes lnVplot improves the fit (AIC). lnGpoint together with lnVplot (model 3) gave better fit than lnVWCpoint together with lnVplot (model 2). Overall, lnVplot and lnGpoint were more significant individual predictors of RutForwijkl than that of RutHarvijkl.
With all these models, the random variables trail (vkl) and site (yl) were not significant but there was significant plot effect (ujkl) within the data.
| Table 7. Mixed-linear models predicting rut depths after one harvester pass and two forwarder passes (RutForvijkl). N = 165. Gpoint = Shear modulus of measurement point, Vplot = Volume of trees within the plot, VWCpoint = Volumetric water content of measurement point, Brash mat is a binary variable that takes the value 1 in the case study plot has brash mat and 0 in the case study plot has no brash mat, Forwarder type is a binary variable that takes the value “Wheeled forwarder” in the case of the John Deere and “Tracked forwarder” in the case of the Prosilva, “ * ” is the symbol of multiplication, var(ujkl) = variance of the plot, var(vkl) = variance of trail, var(yl) = variance of site, var(eijkl) = residual variance and AIC = Akaike’s Information Criterion. | ||||||
| Model | 1 | 2 | 3 | |||
| Parameter | Estimate (SE) | Sig. | Estimate (SE) | Sig. | Estimate (SE) | Sig. |
| Fixed | ||||||
| Intercept | 52.9 (17.6) | .006 | 69.9 (20.0) | .001 | 70.2 (17.6) | .000 |
| lnGpoint | –4.51 (1.63) | .006 | ||||
| lnVplot | –8.23 (3.65) | .032 | –8.88 (3.62) | .020 | –8.40 (3.40) | .020 |
| lnVWCpoint | –3.67 (2.33) | .088 | ||||
| [Brash mat = 0] * [Forwarder type = “Wheeled forwarder”] | 19.3 (3.77) | .000 | 19.3 (3.72) | .000 | 18.0 (3.73) | .000 |
| [Brash mat = 0] * [Forwarder type = ”Tracked Forwarder”] | 8.54 (2.41) | .001 | 8.36 (2.37) | .001 | 8.12 (2.25) | .001 |
| [Brash mat = 1] * [Forwarder type = ”Wheeled forwarder”] | 4.45 (2.67) | .106 | 4.05 (2.65) | .137 | 4.41 (2.49) | .087 |
| [Brash mat = 1] * [Forwarder type = ”Tracked Forwarder”] | 0 | 0 | 0 | |||
| Random | ||||||
| var(ujkl) | 23.6 (8.72) | .006 | 22.7 (8.50) | .008 | 19.3 (7.70) | .012 |
| var(vkl) | .000 | .000 | .000 | |||
| var(yl) | .000 | .000 | .000 | |||
| var(eijkl) | 46.3 (5.70) | .007 | 45.9 (5.67) | .000 | 45.5 (6.16) | .000 |
| AIC | 1128.4 | 1022.1 | 1018.2 | |||
4 Discussion
The field studies were ctarried out in one peatland area. This has both pros and cons considering the study. Control and measurement of the most important characteristics affecting the bearing capacity of the soil was relatively easy, yet their variation was limited, making extrapolation to other peatland types uncertain. The bearing capacity on some test trails were so low that forwarders were not allowed to drive there. The material is in that sense rather limited and we cannot be sure whether all findings and relationships are valid in all kinds of pine bogs. The results were nevertheless logical and in accordance with the earlier findings on the significance of roots to bearing capacity (Makarova et al. 1998; Cofie et al. 2000).
The drive tests were performed on straight trails. This reduced the number of independent variables and made the experiment more controllable. The drawback is that the influence of machine type and radius of curvature on rut formation could not be assessed. Visual observations of rutting on curves outside the test trails but within the same test sites indicated that rutting increased steeply on curves and more so with decreasing radius of curvature. This calls for proper planning of logging trail networks and avoidance of tight curves.
Test drives were mostly carried out on peat soil with poor bearing capacity, since rut depths caused by three overpasses in most cases exceed the general recommendation of 10 cm. This gives us good possibilities to assess the effect of the most important factors affecting bearing capacity. However, the results give insufficient information to assess the behavior of the machines on peatlands with higher bearing capacity.
The significance of roots in composing the bearing capacity of peatland has been discussed earlier (Makarova et al. 1998; Cofie et al. 2000). The present study gave further insight to the question. The bearing capacity classifications used in Finland are mainly based on stand volume. Stand volume as a sole predictor of bearing capacity may be regarded as insufficient. On peatland, the relation of both living and dead root biomass to tree volume increases with a decrease in the fertility of the site (Finér and Laine 1998, 2000) and the fine root biomass of the shrub layer alone may equal that of the tree layer (Paavilainen 1980). Therefore, it is of great importance that the amount of roots, or the strength provided by the roots, could also be predicted together with stand volume. However, more research is needed to clarify the interaction between volume of trees, volume of roots, peat properties and bearing capacity.
Processing the trees on the harvesting trail in front of the harvester to form a protective brush mat is of primary importance on peatlands. The models created in this study indicate that the harvester alone caused roughly 9 cm deeper ruts if the trees were processed outside the logging trail. After one harvester pass, one forwarder pass unloaded and one forwarder pass loaded, the difference is 8 to 14 cm.
Forwarder properties have a great influence on rutting. In this trial, the excavator-tracked forwarder clearly outperformed the wheeled forwarder equipped with band tracks. The prototype tracked ProSilva has important mobility improving features, making it a very promising vehicle for peatland logging. The mobility of the traditional wheeled forwarder is more dependent on the characteristics of the site. Use of a wheeled forwarder in peatland logging necessitates more careful preliminary planning of logging operations and the establishment of strict bearing capacity threshold levels for machine traffic.
The rut formation of the harvester is not to be underestimated on peatland. If the bearing capacity of peat soil is weak, one harvester pass may break the vital root matrix, thus drastically reducing trafficability. In the future, more attention should be paid to harvester running gear and its ground pressure. Logging on unfrozen peatland should be carried out with specialised peatland vehicles or standard vehicles equipped with the most appropriate peatland accessories.
The spiked shear vane proved to be a promising tool for estimating peatland root mat strength, especially when the soil surface is clean of cutting debris. There was moderate yet non-significant correlation between the coverage of dwarf shrubs and shear modulus. On the other hand, shear modulus had no correlation with the volume of trees. Partly due to the sheer size of the large tree roots, spiked shear modulus, measured with the manual device used, most likely predicts best the coverage of dwarf shrub roots and smaller tree roots, while the volume of larger tree roots correlates with the volume of trees. The portable plate loading device was less suited for predicting peatland top layer strength than the spiked shear vane. The diameter of the loading plate is smaller than that of the spiked vane shear head, and smaller weak spots are therefore detected. The loading process of the plate device is also more difficult to control, which may increase variation in results. The cone penetrometer is a well-known tool, but quite understandably it is not at its best in measuring the strength of the root mat of peaty soil. The cone penetrometer used in this study captured readings in 2.5cm increments and the mean of readings 0…20 cm below the surface of the soil were used as the main variable describing cone penetration resistance. This was done because the readings the device gave had rather large variation and it was somewhat unclear whether this variation is depended on the character of the device or real variation of the peat properties. A problem with all devices used in this study is that they measure the properties of the soil from a rather small area while the pressure under the tracks of the machine is distributed on a much greater area.
The mixed-linear models for rut depth after one harvester pass (Table 6) or one harvester pass and two forwarder passes (Table 7) are the key results of this study. The models quantify and combine the most important factors needed in predicting the bearing capacity of peatland, namely shear modulus, volume of trees, soil moisture content, forwarder type and existence of brash mat.
The spiked shear vane measured shear modulus and stand volume were found to be the most significant predictors for quantifying rut depth. Soil moisture content is also an important indicator of the strength of peat layer. However, moisture content did not markedly improve the fit of the models already including shear modulus and stand volume, since moisture content and stand volume were correlated. Drier conditions in the same area would most likely have decreased and wetter conditions increased rutting, as indicated by Ala-Ilomäki (2006). The role of moisture content in the trafficability of peatlands remains partly unsolved. In the future, more tests should be carried out in various site types and wetness conditions.
References
Ala-Ilomäki J. (2005). Metsäisten turvemaiden kulkukelpoisuus. [Trafficability of forested peatlands]. In: Ahti E., Kaunisto S., Moilanen M., Murtovaara I. (eds.). Suosta metsäksi. Suometsien ekologisesti ja taloudellisesti kestävä kasvatus ja käyttö. Tutkimusohjelman loppuraportti. Metsäntutkimuslaitoksen tiedonantoja 947: 98–111. ISBN 951-40-1987-3. [In Finnish].
Ala-Ilomäki J. (2006). The effect of weather conditions on the trafficability of unfrozen peatlands. Forestry Studies – Metsanduslikud Uurimused 45: 57–66.
Ala-Ilomäki J., Högnäs T., Lamminen S., Sirén M. (2011). Equipping a conventional wheeled forwarder for peatland operations. International Journal of Forest Engineering 22(1): 7–13.
Ala-Ilomäki J., Lamminen S., Sirén M., Väätäinen K., Asikainen A. (2012). Using harvester CAN-bus data for mobility mapping. In: Special issue. Abstracts for international conferences organized by LSFRI Silava in cooperation with SNS and IUFRO. Mezzinatne 25(58): 85–87.
Bygdén G., Eliasson L., Wästerlund I. (2004). Rut depth, soil compaction and rolling resistance when using bogie tracks. Journal of Terramechanics 40(3): 179–190. http://dx.doi.org/10.1016/j.jterra.2003.12.001.
Cofie P., Koolen A.J., Perdok U.D. (2000). Measurement of stress-strain relationship of beech roots and calculation of the reinforcement effect of tree roots in soil-wheel systems. Soil &Tillage Research 57: 1–12. http://dx.doi.org/10.1016/S0167-1987(00)00126-4.
Earl R. (1997). Prediction of trafficability and workability from soil moisture deficit. Soil &Tillage Research 40: 155–168. http://dx.doi.org/10.1016/S0167-1987(96)01072-0.
Finér L. (1989). Fine root length and biomass in a pine, mixed birch-pine and spruce stand on a drained peatland. Suo 40: 155–161. [In Finnish with English summary].
Finér L., Laine J. (1998). Root dynamics at drained peatland sites of different fertility in southern Finland. Plant Soil 201: 27–36. http://dx.doi.org/10.1023/A:1004373822354.
Finér L., Laine J. (2000). The ingrowth bag method in measuring root production on peatland sites. Scandinavian Journal of Forest Research 15: 75–80. http://dx.doi.org/10.1080/02827580050160493.
Heikurainen L. (1958). Sekametsiköiden juuristosta ojitetulla suolla. Acta Forestalia Fennica 67(2). 32 p. [In Finnish with German summary].
Laiho R., Finér L. (1996). Changes is root biomass after water-level drawdown on pine mires in Southern Finland. Scandinavian Journal of Forest Research 11: 251–260. http://dx.doi.org/10.1080/02827589609382934.
Laine J., Vasander H. (2005). Suotyypit ja niiden tunnistaminen. Metsäkustannus Oy. 110 p.
Laitakari E. (1927). The root system of pine (Pinus Sylvestris), a morphological investigation. Acta Forestalia Fennica 33(1). 380 p. [In Finnish with English summary].
Lee R.A., Jarret P.M. (1978). Plate bearing tests on fibrous peat. In: Proceedings of the 17th Muskeg Research Conference. National Research Council Canada, Associate Committee on Geotechnical Research, Technical Memorandum 122: 151–164.
Makarova O.V., Cofie P., Koolen A.J. (1998). Axial stress-strain relationships of fine roots of Beech and Larch in loading to failure and in cyclic loading. Soil &Tillage Research 45: 175–187. http://dx.doi.org/10.1016/S0933-3630(97)00017-2.
Nugent C., Kanali C., Owende P.M.O., Nieuwnhuis M., Ward S. (2003). Characteristics of site disturbance due to harvesting and extraction machinery traffic on sensitive forest sites with peat soils. Forest Ecology and Management 180: 85–98. http://dx.doi.org/10.1016/S0378-1127(02)00628-X.
Näslund M. (1937). Skogförsöksanstaltens gallringsförsök i tallskog. Meddelanden från Statens Skogförsköganstalt 29: 1–169. [In Swedish].
Paavilainen E. (1980). Effect of fertilization on plant biomass and nutrient cycle on drained dwarf shrub pine swamp. Communicationes Instituti Forestalis Fenniae 98. 71 p.
Päivänen J. (1973). Hydraulic conductivity and water retention in peat soils. Acta Forestalia Fennica 129. 70 p.
Radforth N.W. (1969). Classification of muskeg. In: MacFarlane I.C. (ed.). Muskeg engineering handbook. University of Toronto Press. p. 31–52. ISBN 8020 1595 6.
Repola J., Ojansuu R., Kukkola M. (2007). Biomass functions for Scots pine, Norway spruce and birch in Finland. Working Papers of the Finnish Forest Research Institute 53. 28 p. http://www.metla.fi/julkaisut/workingpapers/2007/mwp053.htm.
Saarilahti M. (1982). Tutkimuksia radioaaltomenetelmän soveltuvuudesta turvemaiden kulkukel-poisuuden arvioimiseen. Summary: Studies on the possibilities of using radar techniques in detecting the trafficability of peatlands. Acta Forestalia Fennica 176. 105 p.
Sirén M., Tanttu V. (2001). Pienet hakkuukoneet ja korjuri rämemännikön talvikorjuussa. Metsätieteen aikakauskirja 4/2001: 599–614.
Sirén M., Ala-Ilomäki J., Högnäs T. (1987). Harvennuksiin soveltuvan metsäkuljetuskaluston maastokelpoisuus. Summary: Mobility of forwarding vehicles used in thinnings. Folia Forestalia 692. 60 p. ISBN 951-40-0784-0.
Suvinen A. (2006a). A GIS-based simulation model for terrain tractability. Journal of Terramechanics 43(4): 427–449. http://dx.doi.org/10.1016/j.jterra.2005.05.002.
Suvinen A. (2006b). Economic comparison of the use of tyres, wheel chains and bogie tracks for timber extraction. Croatian Journal of Forest Engineering 27(2): 81–102.
Suvinen A., Saarilahti M. (2006). Measuring the mobility parameters of forwarders using GPS and CAN Bus techniques. Journal of Terramechanics 43(2): 237–252. http://dx.doi.org/10.1016/j.jterra.2005.12.005.
Uusitalo J., Haavisto M, Niemistö L., Kataja J. (2010). Assessing the effect of harvesting method on soil disturbances with a spatial harvesting simulator. Proc. of FORMEC 2010 Conference, July 11–14, 2010, Padova, Italy. 5 p.
Wong J.Y., Radforth J.R., Preston-Thomas J. (1982). Some further studies on the mechanical properties of muskeg in relation to vehicle mobility. Journal of Terramechanics 19(2): 107–127. http://dx.doi.org/10.1016/0022-4898(82)90015-5.
Wu T.H. (1966). Soil mechanics. Allyn and Bacon, Inc. Boston. 431 p.
Zeleke G., Owende P.M.O., Kanali C.L., Ward S.M. (2007). Predicting the pressure-sinkage characteristics of two forest sites in Ireland using in situ soil mechanical properties. Biosystems Engineering 97: 267–281. http://dx.doi.org/10.1016/j.biosystemseng.2007.03.007.
32 references
