Sofia Bäcklund  ,
Mari T. Jönsson,
Joachim Strengbom,
Göran Thor
,
Mari T. Jönsson,
Joachim Strengbom,
Göran Thor
Composition of functional groups of ground vegetation differ between planted stands of non-native Pinus contorta and native Pinus sylvestris and Picea abies in northern Sweden
Bäcklund S., Jönsson M. T., Strengbom J., Thor G. (2015). Composition of functional groups of ground vegetation differ between planted stands of non-native Pinus contorta and native Pinus sylvestris and Picea abies in northern Sweden. Silva Fennica vol. 49 no. 2 article id 1321. https://doi.org/10.14214/sf.1321
Highlights
- Differences in ground vegetation patterns can be linked to tree species, forest stand age and differences in canopy cover
- Vascular plant cover was higher in stands of P. contorta than in stands of both native tree species
- The overall differences and similarities between P. contorta and the two native conifers were not consistent over the different age classes.
Abstract
Intensified forestry increases the interest in replacing native tree species with fast growing non-native species. However, consequences for native biodiversity and ecosystem functioning are poorly understood. We compared cover and composition of major functional groups of ground vegetation between planted stands of non-native Pinus contorta Dougl. var. latifolia Engelm. and native conifers Pinus sylvestris L. and Picea abies (L.) H. Karst. in northern boreal Sweden. We quantified the ground cover of lichens, bryophytes, vascular plants and ground without vegetation (bare ground) in 96 stands covering three different age classes (15, 30 and 85 years old). Our study revealed differences in ground vegetation patterns between non-native and native managed forests, and that these differences are linked to stand age and differences in canopy cover. Total vascular plant cover increased with increasing stand age for all tree species, with P. contorta stands having higher cover than both native conifers. The ground cover of lichens was, although generally low, highest in stands of Pinus sylvestris. P. abies stands had a lower cover of vascular plants, but bare ground was more common compared with P. contorta. Our results suggest that the use of P. contorta as an alternative tree species in Fennoscandian forestry will influence native ground vegetation patterns. This influence is likely to change with time and future research should consider both temporal and landscape-scale effects from shifting tree-species dominance to Pinus contorta and other non-native tree species.
Keywords
boreal forests;
bryophytes;
managed forests;
introduced species;
exotics;
lichens;
vascular plants
-
Bäcklund,
Department of Ecology, Swedish University of Agricultural Sciences, P.O. Box 7044, SE-750 07 Uppsala, Sweden
E-mail
sofia.backlund@slu.se
- Jönsson, The Swedish Species Information Centre, P.O. Box 7007, SE-750 07 Uppsala, Sweden E-mail mari.jonsson@slu.se
- Strengbom, Department of Ecology, Swedish University of Agricultural Sciences, P.O. Box 7044, SE-750 07 Uppsala, Sweden E-mail joachim.strengbom@slu.se
- Thor, Department of Ecology, Swedish University of Agricultural Sciences, P.O. Box 7044, SE-750 07 Uppsala, Sweden E-mail goran.thor@slu.se
Received 16 February 2015 Accepted 7 April 2015 Published 5 May 2015
Views 93276
Available at https://doi.org/10.14214/sf.1321 | Download PDF

Supplementary Files
1 Introduction
Introducing non-native tree species is a common way to increase wood production, and establishment of non-native tree plantations is expanding worldwide (Richardson 1998; Bremer and Farley 2010). The potential effects on associated native vegetation are, however, still poorly understood. To predict the consequences of tree species introductions, a deeper general understanding of how choice of tree species influences the functional composition of the vegetation is important.
Trees influence the local climate and provide important living space for other species (Lawton 1994). Influence of non-native trees on native biodiversity will largely depend on what they replace, and changes in composition of native understory species will be greater if the introduced tree species create substantial changes in canopy closure and litter composition (Brockerhoff et al. 2008; Meers et al. 2010). Another important factor is time since disturbance, e.g. generated by clear-cutting (Clark et al. 2003; Uotila and Kouki 2005; Uotila et al. 2005). The potential effects that these two factors have on functional groups of ground vegetation have rarely been examined for a range of native and non-native planted forest types (Bremer and Farley 2010).
Changes in dominance structure of functional groups of ground vegetation can influence ecosystem processes (Nilsson and Wardle 2005) and biodiversity (Suchar and Crookston 2010). Thus, ground vegetation changes may be used as an indicator of how shifts in the dominant tree species influence biodiversity and functioning of the forest (Humphrey et al. 1999; Nilsson and Wardle 2005; Suchar and Crookston 2010).
Pinus contorta Dougl. var. latifolia Engelm. has been planted widely outside its native North American distribution range (Sykes 2001). Despite the fact that the regional introduction of P. contorta has been substantial, the understanding of its consequences for native biota is limited (but see: Nilsson et al. 2008; Roberge and Stenbacka 2014). In Sweden it is now the third most common conifer after the native Pinus sylvestris L. and Picea abies (L.) H. Karst., and constitutes 1.2% of the total standing tree volume (Skogsstyrelsen 2014), In comparison to the native P. sylvestris, P. contorta allocate more of the aboveground biomass to needle production (Ågren and Knecht 2001) and reach canopy closure and limited light conditions at an earlier age (Elfving et al. 2001). P. contorta also produces more litter (Nilsson et al. 2008) with lower nitrogen and higher lignin concentrations than P. sylvestris, resulting in slower decomposition rates (Ågren and Knecht 2001). These differences suggest that species composition and cover of ground vegetation will undergo substantial change in areas were P. contorta have replaced the native conifers.
The objective of this study was to examine the cover and composition of functional groups of ground vegetation in a chronosequence of stand age classes of managed forests of non-native P. contorta and native P. sylvestris and P. abies. Specifically, the aim was to assess if cover of different taxonomic and functional groups, i.e. lichens, bryophytes and vascular plants, differ depending on choice of tree species planted, and how the composition of these vegetation groups are related to the stand age and canopy cover of the different tree species.
2 Materials and methods
2.1 Study area description
The study area (c. 2800 km2) is located in the northern boreal zone of Sweden (64°15´N, 16°24´E) and dominated by coniferous managed forests of P. sylvestris and P. abies. The annual mean temperature is +1 °C, with mean monthly temperatures ranging from –10 °C in the winter (December–February) to +13 °C in the summer (June–August). The length of the growing season is 140–150 days. The mean annual precipitation is approximately 700 mm (data from the Swedish Meteorological and Hydrological Institute for the period 1961–1990). All of the inventoried P. contorta stands were in the first generation, i.e. they had all been planted after harvest of native tree species.
Stands used for inventory were selected according to the following criteria (based on data from the land owner’s database): >70% of the stand volume was one of the three focal tree species, cowberry-bilberry vegetation of dry-mesic-moist ground type (after Pålsson 1998), and predominantly flat topography. Three age classes were used: 15 (±2 years), 30 (±5 years) and 85 (±5 years) years old. Most 15 and 30-year old stands had been subjected to pre-commercial thinning and the 85-year old stands had been subjected to commercial thinning.
2.2 Field methods
All stands were inventoried during the snow-free period of the three years 2009 to 2011. For each tree species, 12 stands in every age class were inventoried except for 85-year old P. abies (11 stands) and 85-year old P. contorta (1 stand). The single mature stand of P. contorta was the only stand of that age within the study area. Stands were on average 24.7 ha. Ground vegetation was surveyed in 24 one by one metre ground plots, evenly distributed along the longest transect through each stand, starting and ending 25 m from the edge to avoid edge effects. Average spacing between ground plots was 29 m. For practical reasons, the position of a plot was moved to the nearest acceptable position if it contained saplings taller than 50 cm, boulders covered more than 10% of the plot, or was too wet (i.e., contained water-filled holes or patches of Sphagnum spp.).
Within each of the 24 plots we recorded percent cover of macrolichens, bryophytes, vascular plants (ground and field layer) and ground without vegetation (bare mineral soil, needles or coarse/fine woody debris, hereafter “no vegetation”). Lichen cover was dominated by the genus Cladonia P. Browne. Bryophytes were recorded as total percent cover and consisted predominantly of Hylocomium splendens (Hedw.) Schimp. and Pleurozium schreberi (Brid.) Mitt. Vascular plant cover was recorded in three groups: total vascular plants (TVP), eudicots and grasses. TVP cover includes all vascular plants in the ground- and field layer and eudicots mainly consist of the dwarf shrubs Vaccinium myrtillus and V. vitis-idaea. Grasses mainly consist of thin-leaved grasses such as Deschampsia flexuosa (L.) Trin. At four random points along each transect, canopy cover was estimated by the same two persons as a visual estimate of percent sky.
2.3 Statistical methods
All analyses were based on forest stand averages, both for canopy cover and ground cover data. Canopy cover was not correlated to stand age (r = 0.190, p = 0.060). We used beta regression models to compare the ground vegetation cover between stands of P. contorta and the two native conifers. As a starting point we used a full model with tree species, stand age class, canopy cover and the two-way interactions between these variables as explanatory variables. Thereafter, the least significant variables were removed one at a time (stepwise backward selection) until we achieved the lowest Akaike’s Information Criterion (AIC). We defined a plausible model according to Burnham and Anderson (2002), i.e., that the alternative model’s AIC (all AIC values presented in Supplementary file 3) was less than two units higher than AIC for the “best” model with the lowest AIC (ΔAIC < 2.0). Differences in canopy cover between tree species within age classes was analyzed using ANOVAs with Tukey’s family error rate at the 95% confidence level, i.e. we ran one separate ANOVA for each age class. Correlations and ANOVAs were tested using Minitab 16 Statistical Software, and for the beta regression the statistical software R 3.0.1 (R Development core team 2013) and the plug-in library Betareg (Cribari-Neto and Zeileis 2010).
3 Results
Tree species had a significant influence on the ground vegetation in the majority of examined cover types (Table 1). P. contorta stands differed from P. sylvestris stands in bryophyte, lichen and eudicot cover, and from P. abies stands in eudicot cover and no vegetation cover (Table 1, Fig. 1). Increasing stand age had a negative influence on bryophyte cover in stands of P. contorta, while cover of eudicots and TVP increased with stand age (Table 1). In P. sylvestris stands, grass cover decreased with increasing stand age (Table 1).
| Table 1. Results from the beta regression models explaining average ground cover of lichens, bryophytes, eudicots, grasses, total vascular plants (TVP) and no vegetation in stands of native P. sylvestris and P. abies when contrasted to non-native P. contorta. Significant p-values are given in bold. The presented models represent the models with lowest AIC (see Supplementary file 3). The pseudo-R2 value (the squared correlation of the linear predictor and link-transformed response) gives a measure of model fit. | ||||
| Estimate | SE | p-value | Rp2 | |
| Bryophytes | 0.25 | |||
| Intercept | 1.932 | 0.216 | <0.001 | |
| Picea abies | –0.514 | 0.275 | 0.062 | |
| Pinus sylvestris | –0.976 | 0.266 | <0.001 | |
| Age | –0.024 | 0.007 | 0.001 | |
| P. abies × age | 0.030 | 0.008 | <0.001 | |
| P. sylvestris × age | 0.035 | 0.008 | <0.001 | |
| Lichens | 0.37 | |||
| Intercept | –2.946 | 0.905 | 0.001 | |
| Picea abies | –1.198 | 0.992 | 0.227 | |
| Pinus sylvestris | 2.149 | 0.985 | 0.029 | |
| Age | –0.021 | 0.014 | 0.132 | |
| Canopy cover | –0.021 | 0.013 | 0.118 | |
| P. abies × age | 0.022 | 0.016 | 0.181 | |
| P. sylvestris × age | 0.002 | 0.015 | 0.881 | |
| P. abies × canopy cover | 0.007 | 0.017 | 0.665 | |
| P. sylvestris × canopy cover | –0.043 | 0.017 | 0.013 | |
| Eudicots | 0.36 | |||
| Intercept | –0.611 | 0.112 | <0.001 | |
| Picea abies | –0.520 | 0.137 | <0.001 | |
| Pinus sylvestris | –0.343 | 0.135 | 0.011 | |
| Age | 0.015 | 0.002 | <0.001 | |
| Grasses | 0.51 | |||
| Intercept | –2.810 | 0.740 | <0.001 | |
| Picea abies | 0.386 | 0.741 | 0.603 | |
| Pinus sylvestris | 0.527 | 0.770 | 0.493 | |
| Age | 0.022 | 0.015 | 0.137 | |
| Canopy cover | 0.026 | 0.012 | 0.035 | |
| P. abies × age | 0.004 | 0.014 | 0.756 | |
| P. sylvestris × age | –0.035 | 0.010 | <0.001 | |
| P. abies × canopy cover | –0.032 | 0.013 | 0.017 | |
| P. sylvestris × canopy cover | 0.012 | 0.013 | 0.366 | |
| Age × canopy cover | 0.000 | 0.000 | 0.137 | |
| Total vascular plant cover (TVP) | 0.49 | |||
| Intercept | –0.804 | 0.521 | 0.123 | |
| Picea abies | 0.238 | 0.565 | 0.673 | |
| Pinus sylvestris | 0.019 | 0.601 | 0.975 | |
| Age | 0.031 | 0.009 | <0.001 | |
| Canopy cover | 0.011 | 0.008 | 0.145 | |
| P. abies × age | –0.024 | 0.010 | 0.014 | |
| P. sylvestris × age | –0.025 | 0.009 | 0.006 | |
| P. abies × canopy cover | –0.012 | 0.009 | 0.209 | |
| P. sylvestris × canopy cover | 0.009 | 0.010 | 0.369 | |
| No vegetation | 0.68 | |||
| Intercept | –3.788 | 0.498 | <0.001 | |
| Picea abies | 1.928 | 0.442 | <0.001 | |
| Pinus sylvestris | 0.736 | 0.465 | 0.114 | |
| Age | –0.012 | 0.014 | 0.392 | |
| Canopy cover | 0.008 | 0.005 | 0.103 | |
| P. abies × age | 0.003 | 0.015 | 0.859 | |
| P. sylvestris × age | –0.014 | 0.015 | 0.343 | |
The overall differences and similarities were not necessarily consistent over the different age classes (Fig. 1). In general, significant differences were almost exclusively found in the two younger age classes with the exception of the cover type no vegetation (Fig. 1). The 85 year old P. contorta stand is not part of the significance test due to the single stand, but still included in Figure 1 for comparison. Percent canopy cover had a significant effect on grass cover that interacted with tree species (Table 1), where grass cover decreased with increasing canopy cover in P. abies stands (Fig. 2).
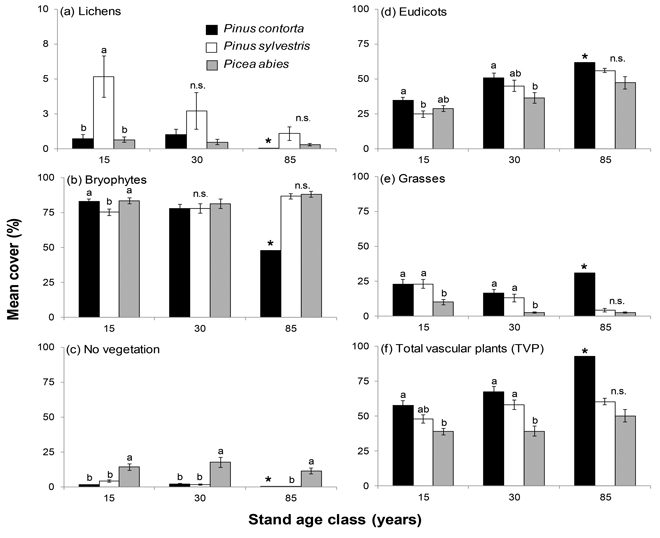
Fig. 1. Mean cover (%), ±SE, for the six different types of ground vegetation inventoried in stands of P. contorta, P. sylvestris and P. abies of different stand age classes. Note the different scales on the y-axes in (a) Lichens. Significant differences within age classes are indicated by different letters (Tukey’s test; p < 0.05), n.s. = not significant. The star (*) denotes the single 85 year old P. contorta stand which was not included in the significance test.
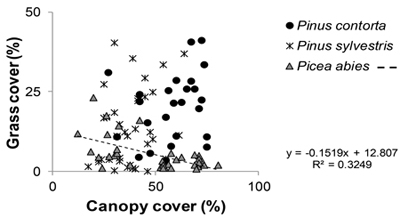
Fig. 2. Relationship between grass cover (%) and canopy cover (%). All stands included. Regression line is shown for Picea abies, the only tree species, under which significant correlation between grass and canopy cover was observed in the beta regression analysis.
In 15 and 30-year old stands, TVP cover was lower in stands of P. abies than stands of P. contorta (Fig. 1f). There was no difference between P. sylvestris stands and P. contorta stands, but 30-year old P. sylvestris stands had higher TVP cover than P. abies stands of the same age (Fig. 1f). For 15 and 30-year old stands, cover of grasses was lower in P. abies stands than for both pine species, while there was no difference in 85-year old stands (Fig. 1e). In 15-year old stands, cover of eudicots was higher in P. contorta stands than P. sylvestris stands, while the cover in P. abies stands was not significantly lower than in P. contorta stands (Fig. 1d). In 30-year old stands, the cover of eudicots did not differ between P. contorta and P. sylvestris, while P. abies stands had significantly lower cover than P. contorta stands. The cover type no vegetation was highest in stands of P. abies throughout the chronosequence (Fig. 1c).
Lichen cover was generally low and the highest mean cover of lichens, 5.2%, was found in 15-year old stands of P. sylvestris (Fig. 1a). High canopy cover lowered lichen cover in stands of P. sylvestris, but had no effect in P. contorta and P. abies stands (Table 1). The most common lichen species all belonged to the genus Cladonia and other lichens only made up a small part of the lichen cover (Supplementary file 1).
Bryophyte cover was high with mean cover above 75% (Fig. 1b). The bryophyte cover increased with increasing stand age for both P. abies and P. sylvestris, and the highest mean cover was found in P. abies stands (81%–88%; Fig. 1b).
Canopy cover was highest in 15 and 30-year old P. contorta stands, but there was no difference from P. abies in 30-year old stands. In 85-year old stands, P. abies had the highest canopy cover (Table 2).
| Table 2. Mean values (± SE) for canopy cover in different stand types. Significant differences within age classes are represented by different letters (Tukey’s test; p < 0.05). The star (*) denotes the single 85 year old P. contorta stand which was not included in the significance test. | ||
| Tree species | Age class | Canopy cover (%) |
| P. contorta | 15 | 57 (4.2)a |
| P. abies | 15 | 26 (2.1)b |
| P. sylvestris | 15 | 36 (3.4)b |
| P. contorta | 30 | 62 (2.2)a |
| P. abies | 30 | 58 (4.0)b |
| P. sylvestris | 30 | 40 (3.8)a |
| P. contorta | 85 | 27 * |
| P. abies | 85 | 66 (1.9)a |
| P. sylvestris | 85 | 38 (1.9)b |
4 Discussion
Our study is one of few showing differences in ground vegetation patterns between managed non-native and native boreal forests, and that the differences can be linked to stand age and canopy cover. We found that the total vascular plant cover increased with stand age for P. contorta, which contrasts to Nilsson et al. (2008) who found no such correlation. Uotila and Kouki (2005) found that in managed P. abies stands, dwarf shrubs increased their cover for up to at least 80–100 years, and that herbs had a relatively constant cover, which correspond well to our study where vascular plants increased throughout the chronosequence. We also found higher cover of vascular plants in stands of P. contorta, which contrast the findings of Roberge and Stenbacka (2014) that reported lower cover of both dwarf shrubs and some herbs in middle-aged P. contorta stands compared to P. sylvestris stands. The use of different age classes may complicate comparisons between the studies, yet the contrasting result is surprising as there is nothing in our study that suggests a lower cover of vascular plants in P. contorta stands.
The response of grass cover differed between stands of P. abies and stands of the two Pinus species. For stands of P. abies, grass cover decreased as canopy cover increased, as also shown earlier by Widenfalk and Weslien (2009). However, for P. contorta and P. sylvestris stands we found no such correlation. The understory of stands with the two Pinus spp. may not have responded to increases in canopy cover because of the initially higher grass cover in these stands, and higher transmission of light to the understory vegetation in Pinus spp. compared to Picea spp. (Hart and Chen 2006). Pine stands are usually thinned later than spruce stands and are subsequently more open at later age classes (Table 2). Hence, grasses may start growing and establishing a seed bank already before final harvest in pine stands. Since it is known that the re-growth of grasses (mainly Deschampsia flexuosa) can be extensive after clearcutting (Uotila and Kouki 2005; Uotila et al. 2005), this likely explains the resulting higher grass cover in younger pine stands after final harvest.
Likewise, increasing canopy cover can also limit the ground cover of lichens (Coxson and Marsh 2001). This was evident in stands of P. sylvestris in our study, but not in stands of P. contorta and P. abies. Lichen cover in stands of both P. contorta and P. sylvestris has been reported to increase with increasing stand age in middle and northern boreal Sweden (Nilsson et al. 2008), but we found no significant age effect. In naturally developed pine-lichen woodlands, lichen ground cover can increase with age whereas in more productive forests where lichens are subordinate (as in our study), such response is less likely (Coxon and Marsh 2001). Although stand age and canopy cover can be important for ground cover of lichens, the effect may be obscured in forests with low and patchy lichen cover and neither time nor canopy cover are likely to have much influence under such circumstances (Uotila and Kouki 2005; Lindgren et al. 2006).
Bryophyte cover is known to increase with time since disturbance in boreal forests (Lindgren et al. 2006). In young managed forests, cover is often in the range of 40–50%, but gradually increases to about 80% in older stands (Uotila and Kouki 2005). In accordance with this, we found that bryophyte cover increased with stand age for P. abies and P. sylvestris. Roberge and Stenbacka (2014) reported significantly higher cover of bryophytes in P. contorta stands compared to P. sylvestris stands. In our study, bryophyte cover was indeed higher for P. contorta than P. sylvestris, but only in the youngest stands.
We conclude that planting of non-native tree species will influence composition of the ground vegetation at the stand level. Although the effects of non-native P. contorta on ground vegetation in Sweden do not result in complete changes of vegetation type, it is important to point out that most P. contorta stands in Sweden are still younger than 50 years and represent first generations of this species. Future long-term studies are needed to establish whether the observed differences between our single old P. contorta stand and stands planted with native conifers is a general pattern. Hence, we stress the importance of continued monitoring of both temporal and landscape-scale effects of shifting dominance in tree-species to P. contorta and other non-native tree species. Furthermore, if P. contorta was to be introduced in other bioclimatic zones, this could potentially also affect tree growth and cause differences in the magnitude and timing of vegetation responses.
Acknowledgement
This project was funded by ”Stiftelsen Oscar och Lili Lamms minne”and The Royal Swedish Academy of Sciences. We want to thank SCA SKOG for letting us conduct the study on their land and for using their forest stand database. We would also like to thank Dr Andreas Frisch and Mattias Lif for their help with field work and Dr Mikael Andersson Franko for helpful advice on the statistical analysis. Finally we want to thank the reviewers for their valuable comments on the manuscript.
References
Ågren G.I., Knecht M.F. (2001). Simulation of soil carbon and nutrient development under Pinus sylvestris and Pinus contorta. Forest Ecology and Management 141: 117–129. http://dx.doi.org/10.1016/S0378-1127(00)00495-3.
Bremer L.L., Farley K.A. (2010). Does plantation forestry restore biodiversity or create green deserts? A synthesis of the effects of land-use transitions on plant species richness. Biodiversity and Conservation 19: 3893–3915. http://dx.doi.org/10.1007/s10531-008-9380-x.
Brockerhoff E.G., Jactel H., Parrotta J.A., Quine C.P., Sayer J. (2008). Plantation forests and biodiversity: oxymoron or opportunity? Biodiversity and Conservation 17: 925–951. http://dx.doi.org/10.1007/s10531-008-9380-x.
Burnham K.P., Anderson D.R. (2002). Model selection and multimodel inference: a practical information-theoretic approach. 2 ed. Springer-Verlag, New York, Berlin, Heidelberg. 488 p.
Clark D.F., Antos J.A., Bradfield G.E. (2003). Succession in sub-boreal forests of West-Central British Columbia. Journal of Vegetation Science 14: 721–732. http://dx.doi.org/10.1111/j.1654-1103.2003.tb02204.x.
Coxson D.S., Marsh J. (2001). Lichen chronosequences (postfire and postharvest) in lodgepole pine (Pinus contorta) forests of northern interior British Columbia. Canadian Journal of Botany 79: 1449–1464. http://dx.doi.org/10.1139/b01-127#.VB5efk0U-M8.
Cribari-Neto F., Zeileis A. (2010). Beta regression in R. Journal of Statistical Software 34: 1–24.
Elfving B., Ericsson T., Rosvall O. (2001). The introduction of lodgepole pine for wood production in Sweden – a review. Forest Ecology and Management 141: 15–29. http://dx.doi.org/10.1016/S0378-1127(00)00485-0.
Hart S.A., Chen H.Y.H. (2006). Understory vegetation dynamics of north american boreal forests. Critical Reviews in Plant Sciences 25: 381–397. http://dx.doi.org/10.1080/07352680600819286.
Humphrey J.W., Hawes C., Peace A.J., Ferris-Kaan R., Jukes M.R. (1999). Relationships between insect diversity and habitat characteristics in plantation forests. Forest Ecology and Management 113: 11–21. http://dx.doi.org/10.1016/S0378-1127(98)00413-7.
Lawton J.H. (1994). What do species do in ecosystems? Oikos 71: 367–374. http://dx.doi.org/10.2307/3545824.
Lindgren P., Ransome D., Sullivan D., Sullivan T. (2006). Plant community attributes 12 to 14 years following precommercial thinning in a young lodgepole pine forest. Canadian Journal of Forest Research 36: 48–61. http://dx.doi.org/10.1139/X05-228.
Meers T.L., Kasel S., Bell T.L., Enright N.J. (2010). Conversion of native forest to exotic Pinus radiata plantation: Response of understorey plant composition using a plant functional trait approach. Forest Ecology and Management 259: 399–409. http://dx.doi.org/10.1016/j.foreco.2009.10.035.
Nilsson M.C., Wardle D.A. (2005). Understory vegetation as a forest ecosystem driver: evidence from the northern Swedish boreal forest. Frontiers in Ecology and the Environment 3: 421–428.
Nilsson C., Engelmark O., Cory J., Forsslund A., Carlborg E. (2008). Differences in litter cover and understorey flora between stands of introduced lodgepole pine and native Scots pine in Sweden. Forest Ecology and Management 255: 1900–1905. http://dx.doi.org/10.1016/j.foreco.2007.12.012.
Pålsson L. (1998). Vegetationstyper i Norden. TemaNord 1998:510. Nordisk ministerråd, København. [In Swedish].
R Development Core Team. (2013). R: a language and environment for statistical computing. R Foundation for Statistical Computing, Vienna, Austria. ISBN 3-900051-07-0. http://www.R-project.org/.
Richardson D.M. (1998). Forestry trees as invasive aliens. Conservation Biology 12: 18–26. http://dx.doi.org/10.1111/j.1523-1739.1998.96392.x.
Roberge J.M., Stenbacka F. (2014). Assemblages of epigaeic beetles and understory vegetation differ between stands of an introduced pine and its native congener in boreal forest. Forest Ecology and Management 318: 239–249. http://dx.doi.org/10.1016/j.foreco.2014.01.026.
Skogsstyrelsen (2014). Skogsstatistisk årsbok (The Forestry Board’s statistical yearbook of forestry). Skogsstyrelsen, Jönköping. 368 p. [In Swedish, table legends and summary in English].
Suchar V.A., Crookston N.L. (2010). Understory cover and biomass indices predictions for forest ecosystems of the Northwestern United States. Ecological Indicators 10: 602–609. http://dx.doi.org/10.1016/j.ecolind.2009.10.004.
Sykes M. (2001). Modelling the potential distribution and community dynamics of lodgepole pine (Pinus contorta Dougl. ex. Loud.) in Scandinavia. Forest Ecology and Management 141: 69–84. http://dx.doi.org/10.1016/S0378-1127(00)00490-4.
Uotila A., Kouki J. (2005). Understorey vegetation in spruce-dominated forests in eastern Finland and Russian Karelia: successional patterns after anthropogenic and natural disturbances. Forest Ecology and Management 215: 113–137. http://dx.doi.org/10.1016/j.foreco.2005.05.008.
Uotila A., Hotanen J.-P., Kouki J. (2005). Succession of understory vegetation in managed and seminatural Scots pine forests in eastern Finland and Russian Karelia. Canadian Journal of Forest Research 35: 1422–1441. http://dx.doi.org/10.1139/X05-063.
Widenfalk O., Weslien J. (2009). Plant species richness in managed boreal forests – effects of stand succession and thinning. Forest Ecology and Management 257: 1386–1394. http://dx.doi.org/10.1016/j.foreco.2008.12.010.
Total of 25 references
Send to email
