Ilpo Ervasti 
Wood fiber contents of different materials in the paper industry material chain expressed in roundwood equivalents (RWEs)
Ervasti I. (2016). Wood fiber contents of different materials in the paper industry material chain expressed in roundwood equivalents (RWEs). Silva Fennica vol. 50 no. 4 article id 1611. https://doi.org/10.14214/sf.1611
Highlights
- The paper industry material recycling chain consists of different material streams
- Consumed paper products form a huge fiber source for industry. However, a reliable measuring system should be developed to quantify these fiber volumes
- Converting factors are introduced to quantify the wood fiber contents of different paper industry-related materials of the chain, namely, wood pulp, paper and recovered paper
- By using these conversion factors it is possible to convert for example global recovered paper utilization volumes into wood fiber volumes expressed in roundwood equivalents (RWEs).
Abstract
At present, there are no means for reliably comparing the wood fiber contents of different material streams within the paper industry material chain with each other. The aim of this article is to introduce conversion factors that make it possible to quantify the volume of wood expressed in roundwood equivalent (RWE) values for different paper industry-related materials in the material chain. These conversion factors apply to wood pulp, paper, and recovered paper. European data are used in quantifying the paper industry material streams and calculating the RWE conversion factors. The introduced conversion factors can be used to estimate RWE volumes at a global scale. With assumption that paper recycling did not occur and that paper production volume remained unchanged, an additional volume of 666 million m3 RWEs would be required globally per annum to produce 167 million tons of virgin wood pulp to replace 222 million tons of recovered paper utilized by the paper industry in 2010. This volume is approximately the same as 1.6 times the total removal of wood in Europe (EU27), or the total annual removal of wood in the USA, Canada, and Brazil combined.
Keywords
pulpwood;
paper production;
raw materials;
roundwood equivalent (RWE);
wood pulp;
recycled fiber;
recovered paper;
material recycling
-
Ervasti,
Aalto University, Industrial Engineering and Management, Maarintie 8, 02150 Espoo, Finland
E-mail
ilervasti@gmail.com
Received 1 April 2016 Accepted 22 August 2016 Published 26 August 2016
Views 131811
Available at https://doi.org/10.14214/sf.1611 | Download PDF

1 Introduction
The wood fiber used by the paper industry originates primarily in forests. Paper production-related fiber raw material can be divided into two main pulp categories, namely virgin wood pulps, which are produced by using primary wood fibers as raw material, and recycled fiber pulps, which return back to circulation in material recycling. In addition, non-fiber materials like minerals and additives are used as raw material in paper production. Also some amount of pulps are produced by using non-wood fibers, such as annual plants, as raw material.
Several different wood pulp grades and recovered paper grades are used as raw material in paper production. The shares of these different fiber materials in the papermaking furnish vary considerably depending on the paper grade being produced and on the mill producing it. Additionally, great regional differences exist.
The paper industry material streams are complex. Different wood pulp grades consumed in European paper production originates from domestic European sources or else it is imported from outside the region. Additionally, the pulpwood used in the production of different wood pulp grades in the region can either be obtained from domestic sources or imported from outside the region. Different wood pulp grades are produced by using different wood species as raw material.
In recycled fiber pulp production, recovered paper is used as a raw material. Recycled fiber pulps thereby replace wood pulps in paper production. Different recovered paper grades are used as raw material in the production of different recycled pulps.
However, there are no reliable means to quantify the extent to which material recycling replaces virgin wood pulpwood in paper production. Such a calculation is challenging due to the fact that at different stages of the paper industry material chain, the measurement units, water contents of different products, and shares of fiber and non-fiber materials used to produce different paper grades vary considerably.
In general, it is important to find a common denominator when comparing different materials and different forms of energy with each other. According to Martin (2009), when using process costing to calculate a cost per unit it is necessary to state all material units in terms of a common denominator. For example, in energy calculations a ton of oil equivalent (toe) is used to convert the energy value of different forms of energy into the amount of energy released by burning one ton of crude oil (OECD 2015; Eurostat 2015). In this respect, it is important to find a common dominator to quantify different paper industry material flows, too. The roundwood equivalent (RWE) was selected in this study to be used as measurement unit for this purpose. One RWE corresponds to 1 m3 of wood measured under bark.
To reliably calculate the RWE volume at different stages of the paper industry material chain, it is important to define the RWE content reliably not only with respect to wood pulp but also paper and recovered paper.
There is a great deal of existing literature on the demand for wood per ton of different wood pulp grades. These figures are based on production statistics and technical data about how much wood (in m3 under bark) is required to produce one ton of specific wood pulp grade. However, an aggregate and generally accepted conversion factor for total wood pulp, one that includes all wood pulp grades, is still lacking.
There is no uniform and generally accepted terminological system related to paper industry material recycling (Ervasti 2015). For example, recovered paper should not to be understood as pulp but as a raw material in recycled pulp production. Additionally, there has been no reliable method in use that unequivocally describes paper industry material flows and make it possible to compare geographical regions with each other. In this study a paper industry material framework “the Wheel of Fiber” (Ervasti et al. 2016) is used to support the use of uniform definitions for terms related to paper industry materials and material streams.
The objective of this article is to find a means to quantify the volume of fiber in different paper industry-related materials at different stages of the material chain. These materials include wood pulp, paper, and recovered paper.
The FAO/UNECE (2010) and Global Timber Organization have published their own conversion factors for converting paper into RWEs. The accuracy of these conversion factors is tested in this study. Additionally, there are no generally accepted figures for converting recovered paper volumes into RWEs.
2 Study structure, material, definitions, and methods
2.1 Study structure
The term step is used when talking about different phases of the study. For example, our description of the material framework constitutes a step. The use of the term stage relates to material and its movement within the material chain. For example, paper production and recovered paper collection represent stages.
The study objective was approached by using a structure consisting of six steps. The first step involved describing the entire paper industry material chain by dividing it into relevant stages, corresponding materials, and the relations between these stages. For example, wood pulp production is related to pulpwood consumption, whereas paper production is related to the consumption of wood pulps and recycled fiber pulps. A material framework is used in this article to describe the material chain and material streams between the stages. The first step also includes quantifying different materials at different stages. (Ervasti et al. 2016)
The second step includes grade-specific quantification of the different raw materials used in paper production. The different wood pulp grades and non-fiber material volumes needed to produce different paper grades were quantified. This was done by using existing raw material furnish tables for paper production (Indufor 2013; CEPI 2011).
In the third step, the amount of pulpwood consumption for a ton of wood pulp was quantified. This calculation was done separately for different wood pulp grades by using unit consumption figures (RWE consumed / ton of wood pulp produced).
In the fourth step, different materials at different stages of the framework were divided into three material components, namely dry fiber (0% water), water and non-fiber components. (Keränen and Ervasti 2014)
In the fifth step, two different fiber material chains are described and compared with each other. The two chains are the virgin fiber chain and the recycled fiber chain. Due to terminological and quantification inconsistencies with respect to the recycled fiber chain, it is important to define and analyze these fiber material chains separately. (Ervasti 2015)
In the sixth step, the (dry) fiber component of different materials was converted into RWEs using calculated conversion factors. By taking into account material component differences, including moisture differences between different materials, it was possible to calculate the RWE content for total paper, total wood pulp, and total recovered paper in the year 2010. The conversion factors used to convert different material totals into RWEs were produced by dividing the material-related RWE volumes by the corresponding material volumes. The structure of this study, including all six steps, is shown in Fig. 1.
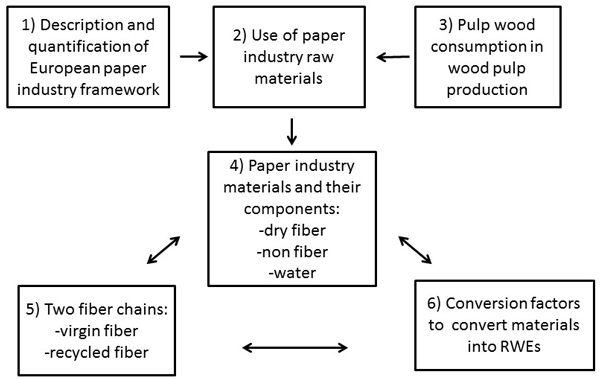
Fig. 1. Study structure – different steps of the study.
2.2 Study material
Several sources of data were used to define the production and consumption of different materials as well as to convert the different materials into RWEs. These sources include CEPI (2011), COST E-48 (2010), FAO (2010), FAO/UNECE (2010), the Forest Legality Alliance (2014), the Global Timber Organization (2015), Indufor (2013), Keränen and Ervasti (2014), Koskinen (2000), Pöyry (2006), SPIF (1969) and Tapion taskukirja (1976).
2.3 Definitions and methods
2.3.1 General definitions
The term paper is used for paper and paperboard. Virgin pulps consist of wood pulps, and they include mechanical pulps, semi-chemical pulps, and chemical pulps, such as bleached and unbleached sulphate (kraft) and sulphite pulps.
A paper industry material framework for describing material streams in the paper industry material chain was used in this study to quantify the paper industry material streams. In quantifying the material streams, Europe was used as a regional case study. The framework covers several different materials, such as pulpwood, wood pulp, recovered paper, recycled fiber, non-fiber materials, and paper itself. So far, it has been difficult to compare the wood fiber contents of these different materials with each other. The calculations in this study were done using the roundwood equivalent (RWE) for different materials, and the corresponding values for the conversion factors used to quantify the RWE are given. In this study, the RWE is used to determine the amount of wood.
This article utilizes the paper industry material framework, the Wheel of Fiber, proposed by Keränen and Ervasti (2014) to define paper industry material streams. A set of conversion factors are introduced. These conversion factors can be used to quantify different material components of the paper industry material at different stages of the chain. One of the material components is (dry) fiber. The dry fiber content can be used to define and quantify a uniform pulpwood measurement unit, RWE. The other two components are non-fiber components and water.
Recovered paper consists of used paper and board that is collected separately and, in general, pre-processed according to, for example, the European List of Standard Grades of Recovered Paper and Board - EN 643 (2002, 2013). Recycled fibers (pulps) are produced using recovered paper as the raw material. According to Grossmann (2009) it is important to collect reliable and complete statistics on recovered paper streams by grades to be able to forecast future availability.
Several geographical regions and countries as well as several different organizations have their own recovered paper or waste paper classification systems. For example, Australia (AuRPS 2002), FAO (2010), Japan (PRPC 2015), Russia (GOST 2003), South Africa (PRASA 2012), and the USA (AF&PA 2008; ISRI 2009) have recovered paper classification systems of their own.
Non-fiber materials consist of the minerals and additives used in paper production. With recovered paper, the non-fiber materials may consist of non-paper materials, such as inks, wrappings, wires, and contaminants like plastics.
The basic year for statistical material is 2010. The reason for selecting this particular year is that detailed statistics from several sources, including raw material uses for different paper grades, are available for 2010. Also, the material framework proposed by Kauranen and Ervasti (2014) uses 2010 data. Additionally, global recovered paper collection and utilization statistics as well as wood material statistics were available for the year 2010.
The pulpwood volume discussed in this study is presented as m3 solid wood, under bark. Pulpwood volumes can be used at a manufacturing plant level, at a sector level or at a country or regional level (FAO/UNECE 2010). In this study, the term RWE volume is used to define of wood in the form of pulpwood logs and industry residues (chips, sawdust, flakes, and shavings). The RWE volume is a measure of the volume of logs (roundwood) used to manufacture wood-based products, including wood pulp, paper, wooden furniture, joinery, and plywood (Global Timber Organization 2015; Forest Legality Alliance 2014).
The term wood is used to express the volume of wood in different products. The term is used to distinguish between other paper industry raw materials, such as non-wood fibers and non-fiber materials. Chemically treated wood fiber consists mainly of cellulosic fibers. Chemical pulping has to do with a process where most of the lignin and hemicelluloses are removed. However, in mechanical pulping processes other materials, such as lignin and hemicellulose, which are the other main chemical substances of wood fibers, end up as wood pulp. Mechanical pulping results in mechanical changes to fibers as well as fiber shortening and the creation of fines. In this study, all of the different wood composites that end up as different wood pulp grades, different paper grades, and different recovered paper grades are included in the wood fiber material volume.
2.3.2 The paper industry material framework
The raw material framework for the paper industry can be expressed as different material stages and different material streams between the stages (Ervasti and Kauranen 2011). These stages are as follows:
- paper production and the production and consumption of related wood pulp, recycled pulp, and non-fiber material. Pulpwood is used as a raw material in virgin wood pulp manufacturing
- paper consumption
- recovered paper collection
- recovered paper utilization stage, where recovered paper is used for recycled fiber pulp production and later for paper production
- Other options include all material streams except those being collected and used for paper manufacturing domestically or as exported recovered paper.
The structure of the material framework for the paper industry and related material streams is shown in Fig. 2.
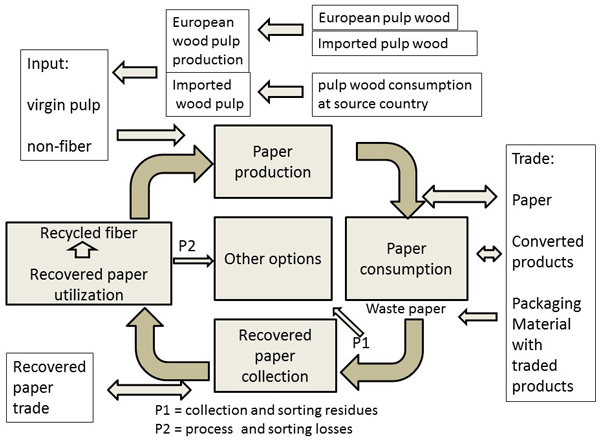
Fig. 2. Material framework for the paper industry, including the most important stages and material streams. The structure of the framework is based on a previous study by Ervasti and Kauranen (2011).
The material framework is not a closed loop. Material enters and exits the system during several different stages. Wood fibers enters the material chain as wood pulp and recycled fiber during paper production. After paper production, a share of paper is exported from the region. Europe, for example, is a net exporter of paper and recovered paper (CEPI 2011). This means that some of the fibers used in paper production exit the region together with the exported paper. On the other hand, China is a net exporter of packaging material traded with goods and a net importer of recovered paper (Zhao 2012).
A stage called other options can be identified. It consists of materials that are not collected to be used in paper manufacturing, material losses during recovered paper collection (P1), and losses related to recycled pulp production (P2). Additionally, considerable volumes of fiber are lost from the recycling chain through incineration and landfills together with other wastes. Approximately 20% of consumed paper is non-collectable or non-recyclable, such as toilet paper, cigarette paper, laminate papers, and filter papers (BIR 2013; Miranda et al. 2010; Putz 2010).
Materials exit the system through the other options stage. The other option stage is not directly related to quantification of wood, but its existence as an abyss of materials has to be taken into account when balancing raw material streams in the paper industry. In paper production, an injection of virgin fibers and non-paper materials is needed to replace material which exits the circulation chain.
When quantifying fiber materials inside the material chain, it is essential that the impact of moisture (water content) changes during the different stages and that certain materials are eliminated. By taking into account the moisture levels of different materials, it is possible to use conversion factors to convert the fiber content of different materials into RWEs and compare the volumes of different materials with each other.
2.3.3 Raw materials
Different wood pulp grades use different wood species as raw materials. For example, in the production of bleached softwood sulphate, long-fiber pulpwood includes wood species like pine and spruce. In bleached hardwood sulphate production, non-coniferous, short-fiber wood species, such as birch and eucalyptus, are used. Also, other chemical pulps, semi-chemical pulps, and mechanical pulps have their own quality requirements regarding wood raw material. In this study, the term pulpwood represents wood material that includes all wood species.
According to CEPI (2011), less than one percent of virgin pulp produced in Europe was based on non-wood fibers in 2010. Non-wood pulps include pulps from annual plants, such as straw, bamboo, bagasse, reed, and cotton. While the existence of non-wood fibers in the paper industry’s material chain was identified, a detailed quantitative analysis was not included in this study due to the fact it occurs in such small amounts during the paper manufacturing process. Additionally, dissolving pulps have been excluded from analysis in this study. They represent less than 2% of the pulp production in the CEPI region (CEPI 2011), and they are used primarily as raw material outside paper manufacturing for further chemical processing purposes, such as to produce viscose products, acetates, cellulose ethers, and cellulose nitrates (Pöyry 2006).
Different materials can be divided into different categories according to their position in the material chain. The general term “material” is used when talking about all different types of raw material and products, such as pulpwood, wood pulp, paper, recovered paper, recycled fiber (pulp), and non-fiber components, at different stages of the material chain. Raw materials include two main categories, namely basic raw materials and paper manufacturing raw materials.
The term basic raw materials includes pulpwood, recovered paper, non-wood fibers, and non-fiber materials like minerals and additives. Basic materials are used to produce paper manufacturing raw materials, which include wood pulp, recycled fiber pulp, non-wood fiber pulp, and non-fiber materials. Paper include different paper and paperboard grades. The structure of the different material categories and their interrelationships are shown in Fig. 3.
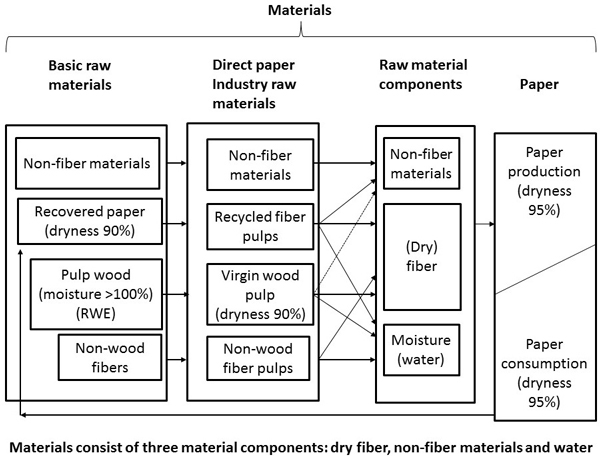
Fig. 3. Structure of the different material categories related to the paper industry material chain.
Keränen and Ervasti (2014) introduced a method to quantify different materials in the material chain commensurately and divide them into separate material components. When quantifying material streams in the paper industry, Keränen and Ervasti (2014) quantified three different material components, namely:
- (dry) fiber component, including both virgin and recycled fibers. The dryness of fibers is 100%. This means that the material does not contain any water.
- non-fiber component, which includes the minerals and additives used in paper manufacturing
- water component, which includes the amount of water in the different materials, such as in virgin wood pulps and in recycled fiber pulps.
The loop balance was simulated after eight iteration and stabilization loops. The fiber component at different stages of the material chain was converted into (dry) fiber equivalents with a dryness of 100%. After this step, it was possible to convert the (dry) fiber content of different materials into RWEs using various conversion factors.
2.3.4 Moisture content of different materials
Fresh (green) wood contains large amounts of water. However, two different methods are used to calculate the water content of fresh wood. The water content of wood is a measure of the water content relative to either the total wet mass of the material, the mass of fresh (green) wood (MCG) or the mass of the dry wood material (MCD). The pulp and paper industry almost invariably reports the water content of wood in terms of the fresh wood (Biermann 1996). The other forest products industries almost invariably report water content in relation to dry wood. Here, a water content greater than 100% is possible and commonly used.
According to Biermann (1996), the relationships between these two different water content (MC) calculation methods can be expressed using the following formulas:
(1) mass of water in wood = wet mass of wood – dry mass of wood
(2) MCG (%) = ((mass of water in wood) / (wet mass of wood)) x 100
(3) MCD (%) = ((mass of water in wood) / (dry mass of wood)) x 100
The water content formulas use the following abbreviations:
MCG = mass of fresh (green) wood
MCD = mass of (oven) dry wood
Corresponding values for both of these water contents as well as the dry material content are shown in Table 1.
| Table 1. Corresponding values for two different moisture percentage calculation methods and the dryness percentage. | ||
| Moisture, % of dry wood (MCD) | Moisture, % of fresh (green) wood (MCG) | Dryness, % of fresh wood (DCG) |
| (9%) | (10%) | (90%) |
| (25%) | (20%) | (80%) |
| (43%) | (30%) | (70%) |
| (66%) | (40%) | (60%) |
| 100% | 50% | 50% |
| 150% | 60% | 40% |
| The two different water contents are interchangeable: MCG (%) = (MCD / (100 + MCD)) x 100 MCD (%) = (MCG / (100 – MCG)) x 100 Additionally, the dry material content (DCG) of fresh wood can be calculated as follows: DCG (%) = (100 – ((mass of water in wood) / (wet mass of wood))) x 100 Dryness values, which are more or less theoretical for fresh wood, in parenthesis | ||
For example, Table 1 shows that the water contents calculated from dry wood (MCD) at 100% correspond to the water contents calculated from fresh wood (MCG) at 50% and the dryness of fresh wood (DCG) at 50%.
Water contents (MCG) lower than 50% correspond to a dryness (DCG) level of greater than 50%, whereas Water contents (MCD) lower than 100% for fresh wood are theoretical and occur, for example, in the case of dried fuel wood.
According to FAO/UNECE (2010), the average water content of coniferous pulpwood (MCD) in Europe is 115%, whereas it is 93% for non-coniferous pulpwood. The average water content of both coniferous and non-coniferous pulpwood is approximately 110%. This corresponds to a dryness level of 52% (DCG).
The dryness (DCG) level of fresh wood is seldom used to indicate the share of dry material in fresh wood. However, the use of dryness for fresh wood in this study makes it possible to better understand and compare the dry matter content of wood with that of other materials, such as wood pulp and recovered paper, where dryness is normally used to indicate the percentage of water in the material. The water content of different material varies at different stages of the material chain. The dryness of wood pulp and recovered paper is 90% (FOEX 2013; EN 643 2013). The dryness of paper varies between 92 and 97% (UPM 2011; Li et al. 2003). In this study, an average dryness level of 95% was used for paper.
Water evaporates from the system during both the wood pulp production process and the paper production process. This means that the water contents of various materials at these particular stages decrease. After paper has been consumed by end users, additional water is absorbed into the system during the recovered paper collection stage. Thus, recovered paper has a higher water content than paper.
Notable changes of water contents in different materials occur during pulp production, paper production, and in paper collection.
The pulpwood volume is measured in cubic meters (m3). Wood pulp, recovered paper, and paper are measured in tons. In paper production, non-fiber components are also used as raw material and measured in tons. The most important measurement point for estimating RWEs is the pulpwood consumption volume in virgin pulp production. At this point, the measurement unit also changes from cubic meters to tons.
2.4 Study region
This study uses European-level data to quantify the material streams. Figures are sums from the 27 individual EU countries. Additionally, data for another region are also shown. This region consists of 19 countries that are members of the Federation of the European Paper Industries (CEPI). Even though the country structure of these two regions is not equal, their economic performances with respect to the paper industry are relatively close to one another in terms of value and volume. Member countries of the European Union (EU-27) and the CEPI region are shown in Table 2.
| Table 2. List of countries belonging to the European Union (EU-27) and CEPI region in 2010. | |
| Europe (EU-27) | Austria, Belgium, Bulgaria, Cyprus, Czech Republic, Denmark, Estonia, Finland, France, Germany, Greece, Hungary, Ireland, Italy, Latvia, Lithuania, Luxembourg, Malta, The Netherlands, Poland, Portugal, Romania, Slovak Republic, Slovenia, Spain, Sweden, United Kingdom |
| CEPI region (19) | Austria, Belgium, Czech Republic, Finland, France, Germany, Hungary, Italy, The Netherlands, Norway, Poland, Portugal, Romania, Slovak Republic, Slovenia, Spain, Sweden, Switzerland, United Kingdom |
The reason for using both of these regions as source of data in this study is that for some data, only European Union figures or CEPI figures were available. The data used for these two geographical regions is clearly indicated in the text.
2.5 Raw materials used in paper production
The grade distribution of the different raw materials related to paper manufacturing as well as corresponding paper grades are shown in Table 3. CEPI (2011), Indufor (2013) and Keränen and Ervasti (2014) have all used this particular grade structure for raw materials.
The Table 3 shows the different wood pulp grades, different recovered paper grades, and non-fiber materials that have been used to manufacture different paper grades in 2010. The fiber furnish table has been calculated by summing up the individual country fiber furnish tables (Indufor 2013; CEPI 2011).
| Table 3. Detailed material table for the paper industry grade distribution of different raw materials used in the production of different paper grades. | |||
| Production of different paper grades | Different wood pulp grades used in paper production | Different recovered paper grades collected and utilized in paper production | Non-fiber materials used in paper production |
| - newsprint - printing and writing (other graphic) - tissue - packaging papers - other paper ∑ total paper | - total sulphate • bleached softwood • bleached hardwood • unbleached sulphate - mechanical and semichemical pulp - sulphite ∑ total wood pulp | - mixed grades - old corrugated containers - old news and magazines - high grades ∑ total recovered paper | ∑ total non-fiber materials |
| The symbol ∑ indicates that the value of the described material is the sum of the materials shown above. | |||
3 Results of quantitative calculations
3.1 European paper industry raw material consumption
Paper production in Europe (EU-27) was 94.2 million tons in 2010. During the same year, wood pulp consumption was 43.6 million tons, recovered paper consumption 48.3 million tons, and non-fiber material consumption 14.0 million tons (Indufor 2013). Thus, the total raw material consumption with respect to the paper industry was 106 million tons. The total consumption of raw materials, namely wood pulp, recovered paper, and non-fiber materials, was approximately 13 percentage points higher than for paper production. This higher volume of raw material’s consumed compared to that of paper production can be explained via the water content differences between paper and raw materials as well as production losses. The high volume of raw material consumption can be regarded as a normal situation. For example, according to Putz (2010) the total consumption of virgin pulp, recovered paper, and non-fibrous material was approximately 14% higher than paper production in the CEPI region in the year 2008. Paper production by paper grade and consumption of different raw materials in 2010 is shown in Table 4. The table quantifies the consumption of different materials by paper grade and by the main raw material categories, namely wood pulp, recovered paper, and non-fiber materials. Wood pulp and recovered paper figures include a 10% water content (dryness 90%).
| Table 4. European (EU-27) paper production by grade and the consumption of different raw materials in the year 2010. | ||||||
| Paper grade (Million tons) | production of paper | consumption | ||||
| wood pulp 1) | recovered paper 2) | non-fiber material 3) | total raw material | % 4) | ||
| Newsprint | 9.0 | 2.3 | 8.3 | 0.1 | 10.7 | 119 |
| Printing and writing | 32.8 | 21.8 | 3.9 | 11.3 | 37.0 | 113 |
| Tissue | 6.8 | 4.3 | 3.3 | 0.2 | 7.8 | 115 |
| Corrugated board | 24.8 | 3.9 | 23.3 | 0.6 | 27.8 | 112 |
| Carton board | 9.7 | 5.5 | 4.4 | 1.1 | 11.0 | 113 |
| Other paper and board | 11.2 | 5.8 | 5.1 | 0.8 | 11.7 | 104 |
| Total paper and board | 94.2 | 43.6 | 48.3 | 14.0 | 106.0 | 113 |
| Source: Indufor 2013. 1) = total consumption of mechanical, semi-chemical and chemical wood pulps. 2) = total consumption of all recovered paper grades. 3) = including minerals and additives. 4) = % shows the ratio between total raw material consumption and paper production. | ||||||
Both wood pulps produced in the region and imported wood pulps are used as raw material in paper production. According to CEPI (2011), approximately 17% of all wood pulp consumed in the CEPI region was imported from outside the region in 2010. Depending on the paper grade produced, the shares of different wood pulp grades vary in the raw material furnish. The shares of different raw materials in the furnish mix depend on the paper grade produced and the paper mill in question.
For example, bleached chemical wood pulps are the most important pulps used in the production of wood free printing and writing paper. In the production of packaging paper grades, such as in liner and fluting, recycled fiber (based on recovered packaging paper) and unbleached chemical pulps are the most important fiber raw materials.
The quantification system for the way in which different raw materials are being used is based on detailed fiber furnish tables for individual countries, which show the use of different raw materials by paper grade in 2010. The raw material consumption figures were calculated for each paper grade and country separately.
Wood pulp and recovered paper consumption by grade used in paper production in Europe in 2010 is shown in Table 5. Wood pulp and recovered paper consumption volumes have been divided into different subgrades, as indicated in Table 3. The consumption of recovered paper is shown in Table 5 because there are no available statistics for recycled fiber pulp consumption by paper grade. The author of this article wants to highlight the fact that recovered paper is used as raw material in recycled pulp production and that some material losses occur when recycled pulp is manufactured.
| Table 5. Paper production and use of different wood pulps and recovered paper grades in EU-area in 2010. View in new window/tab. |
3.2 Pulp and paper industry materials
3.2.1 Pulpwood
Pulpwood is used as a raw material in the production of different wood pulp grades. Pulpwood consumption per ton of wood pulp produced varies greatly depending on the wood pulp grade and on the wood species being used.
Pulpwood consumption figures are estimated for different pulp grades. For example, more pulpwood is required to produce one ton of chemical wood pulp than in the production of mechanical pulp and semi-chemical pulp. Additionally, more wood is required in chemical wood pulp production to produce a ton of softwood pulp than to produce a ton of hardwood pulp. Consumption of wood to produce a ton of wood pulp is shown in Table 6. In this table different sources are compared with each other.
| Table 6. Consumption of wood in wood pulp production (comparison of different sources). | ||||||
| Pulp grade | One m3 (RWE) of wood, under bark, per one ton of pulp (90% dryness) produced | |||||
| FAO | SPIF | Pöyry | Koskinen | TT | Indufor | |
| Sulphate bleached | 4.55 | - | - | - | - | - |
| Sulphate, bleached softwood | - | - | 5.30 | - | 5.30 | 5.12 |
| Sulphate, bleached hardwood | - | - | 3.90 | - | 3.70 | 3.90 |
| Sulphate, unbleached | 4.45 | - | 4.90 | - | - | 4.72 |
| Sulphate unbleached softwood | - | - | 5.00 | - | ||
| Sulphate unbleached hardwood | - | - | 3.50 | - | ||
| Sulphite | - | 5.30 | - | - | 5.04 | |
| Sulphite, bleached | 4.95 | - | - | - | 4.80 | - |
| Sulphite, bleached softwood | - | 5.4–5.5 | - | 5.5–5.6 | - | - |
| Sulphite, bleached hardwood | - | 4.00 | - | 4.00 | - | - |
| Sulphite, unbleached | 4.64 | - | - | 4.50 | - | |
| Sulphite, unbleached softwood | 5.00 | 5.00 | - | - | ||
| Mechanical + semi-chemical | - | 2.50 | - | - | 2.48 | |
| Mechanical pulp | 2.50 | 2.6–2.8 | - | 2.50 | 2.40 | - |
| Semi-chemical pulp | 2.67 | 2.5–3.5 | - | 2.60 | 2.30 | - |
| Sources: FAO = FAO/UNECE 2010. SPIF = Sveriges Pappersindustriförebund 1969. Pöyry 2006. Koskinen 2000. TT = Tapion taskukirja 1976. Indufor 2013. | ||||||
When calculating the volumes of pulpwood consumption involved in pulp production the Indufor (2013) conversion factors were used in this study. These factors give an average m3 RWE consumed for one ton of wood pulp produced at 90% dryness. The values of the used conversion factors are in line with the conversion factors used by FAO/UNECE (2010), Pöyry (2006), and Tapion Taskukirja (1975). The same conversion factors for different pulp grades are used for produced, consumed and imported wood pulp. The relations between the production and consumption of different pulp grades and corresponding RWEs are shown in Table 7.
| Table 7. Calculation of wood consumption for different wood pulp grades in Europe in 2010 (conversion factors for roundwood equivalents (RWE) per ton of wood pulp). | |||||
| Wood pulp grade | Wood pulp 1) consumption (mill. tons) /a | Wood pulp 1) production (mill. tons) /a | Conversion factor for 1 ton of pulp into 1 m3 (RWEs) 2) | Wood consumption for wood pulp consumption (million m3 RWEs) / a | Wood consumption for wood pulp production (million m3 RWEs) / a |
| Mechanical and semi-chemical pulp | 11.5 | 11.3 | 2.48 | 28.6 | 28.0 |
| Bleached softwood sulphate pulp | 10.7 | 9.7 | 5.12 | 54.8 | 49.5 |
| Bleached sulphate hardwood pulp | 14.7 | 9.1 | 3.90 | 57.4 | 35.6 |
| Unbleached sulphate pulp | 4.7 | 4.6 | 4.72 | 22.1 | 21.5 |
| Sulphite pulp | 2.0 | 2.0 | 5.04 | 10.0 | 10.0 |
| Total above | 43.6 | 36.6 | 3.97 5) | 173.0 4) | 143.0 3) |
| 1) Dryness 90%. 2) Source: Indufor 2013. 3) For reasons of consistency, the Indufor (2013) figure of 143 million RWEs is used. By using a conversion factor of 3.97, the figure would be 145.3 million RWEs. According to CEPI (2011), the amount of pulpwood consumed in the CEPI region is 147 million RWEs. However, the pulpwood consumption statistics for CEPI are based on a different country structure and a different definition of imported pulpwood. The value of the conversion factor changes annually depending on the volume shares of different imported wood pulps. 4) Europe is a net importer of wood pulp. A difference of 30 million RWEs (difference between wood pulp consumption and production) is consumed in wood pulp source countries. 5) Weighted average, which takes into account the consumption volumes of different wood pulps. Instead of 3.97 a rounded figure 4.0 is used in calculations. | |||||
The figures presented in Table 7 show the situation in 2010. For example, the consumption of bleached softwood pulp was 10.7 million tons. By using conversion factor of 5.12, wood consumption of 54.8 (10.7 x 5.12) million RWEs could be calculated. The average RWE conversion factor for total wood pulp produced and consumed (dryness 90%) is 3.97. This factor is a weighted average of the sum of all individual wood pulp grades. The conversion factor has been rounded up to 4.0.
3.2.2 Paper industry material components
To quantify the volume of wood fiber at different stages of the material chain, it was necessary to divide materials into three main material components: (dry) fiber, non-fiber, and water components. Table 8 shows the shares of the different material components based on principal material categories in 2010. The total volumes presented in Table 8 are based on Indufor’s (2013) working documents, whereas the volumes of the different material components are based on an analysis done by Keränen and Ervasti (2014). While water is treated as a separate component, it is possible to define the share of the dry fiber component (0% water) in the different material categories in the same manner and avoid possible sources of error, which are based on water content differences between wood pulps, recovered paper, and paper.
| Table 8. Volumes of different paper industry materials and shares of the raw material components in Europe in 2010. | ||||
| Paper industry materials (million tons) | Total volume 1) | Dry wood fiber 2) component | Non-fiber component 3) | Water component |
| Paper production | 94.2 | 67.1 | 21.9 | 5.4 |
| Paper consumption | 81.4 | 58.3 | 18.3 | 4.7 |
| Paper net exports | 12.9 | 8.7 | 3.6 | 0.6 |
| Recovered paper collection | 56.2 | 38.3 | 12.3 | 5.6 |
| Recovered paper net exports | 7.9 | 5.5 | 1.6 | 0.8 |
| Recovered paper utilization | 48.3 | 32.8 | 10.7 | 4.8 |
| Wood pulp consumption | 43.6 | 39.3 | - | 4.3 |
| Source: Keränen and Ervasti 2014 1) dryness of paper is 95%, dryness of wood pulp and recovered paper is 90%. 2) (dry) wood fiber dryness is 100%. 3) the non-fiber component volume in paper production consists of added material and volumes which come together with recycled pulp. For example, the European recovered paper collection was 56.2 million tons in 2010. This volume consists of 38.3 million tons of (dry) fiber, 12.3 million tons of non-fiber components, and 5.6 million tons of water. | ||||
When the impact of water in pulp and recovered paper (10%) is eliminated, the results of this study demonstrate that an average ton of dry wood fiber in material (water contents of 0%) consumed in paper production corresponds to 4.4 RWEs. This conversion factor can be calculated using the following formula: (4.0 RWEs x 1.1 = 4.4 RWEs). It is assumed that the shares of different types of fibers (hardwood / softwood and mechanical and chemical) will remain the same at the different stages of the material chain. This assumption relates to materials at different stages: paper production, paper exports, paper consumption, recovered paper collection, recovered paper exports, and recovered paper utilization. For all of the above-mentioned stages, it is assumed that one ton of dry fiber component corresponds to 4.4 RWEs of wood. The shares and volumes of different fibers may vary at different stages, but the assumed conversion factor gives an average picture of the ratio of dry fiber component in material to wood content as expressed in RWEs.
When combining the conversion factor of 4.4 to convert dry fiber (0%) into RWEs with the dry fiber contents of paper and recovered paper, it is possible to also calculate RWE conversion factors for one ton of paper and recovered paper.
Paper: ((67.11 Mt x 4.45) / (94.32 Mt)) = 3.1
Recovered paper: ((32.83 Mt x 4.45) / (48.34 Mt)) = 3.0
The figures used in the above formulas are sourced from Table 8.
1) = dry fiber contents in paper produced
2) = paper production
3) = dry fiber contents in recovered paper utilized
4) = recovered paper utilization
5) = a conversion factor of 4.4 is used to convert the dry fiber component of the material into RWEs.
4 Paper industry material streams and stages expressed in RWEs
The total wood content in paper produced in Europe corresponded to 295 million RWEs in 2010. The RWE content of different paper industry materials in the material chain is shown in Table 9.
| Table 9. Key figures of the European paper industry material framework in the year 2010. Amounts of dry fiber and wood, expressed in RWEs are shown. | |||
| Material and material stage (Million tons and million RWEs per annum) | Total volume (million tons) | Dry wood fiber component in material 1) (million tons) | Wood in material (million RWEs) |
| Paper production, (CF) | 94.2 1), 1b) | 67.1 | 295 |
| - Wood pulp consumed in Europe | 43.6 | 39.3 | 173 |
| -- Wood pulp produced in Europe | 36.6 2a) | 143 | |
| --- Of which, amount wood imported from outside Europe 3), 4) | 30 | ||
| --- Of which, amount local wood sourced from Europe 5) | 113 | ||
| -- Net imports of wood pulp from outside Europe | 7 2a) | 30 | |
| - Recycled pulp produced in Europe (CF) | 36.5 1), 1b) | 27.8 | 122 |
| Paper net exports to places outside Europe (CF) | –12.9 1b), 2) | –8.7 | –38 |
| Paper consumption (CF) | 81.4 1b), 2) | 58.3 | 257 |
| European net trade of converted products and packages traded with goods | n.a. assumed: 0 3) | n.a. assumed: 0 | n.a. assumed: 0 |
| Paper not collected, and other options outside paper industry recycling (P1) (CF) | 28.8 1), 1b) | 20.1 | –89 |
| Recovered paper collection (CF) | 56.2 1b), 2a) | 38.3 | 168 |
| Recovered paper net exports (CF) | –7.9 1b), 2a) | –5.5 | –24 |
| Recovered paper utilized in recycled pulp production (CF) | 48.3 1b), 2a) | 32.8 | 144 |
| Of which, amount of process losses (P2) (CF) | 11.9 1), 1b) | 5.0 | –22 |
| 1) Keränen and Ervasti 2014. 1b) Material, including fiber, non-fiber, fillers and water components (mass balance). 2a) Indufor 2013; pulp grade structure of domestic and imported wood pulps vary. This affects the corresponding RWE volumes. 2b) Indufor 2013. 3) CEPI 2011. 4) Pulpwood imports refers to the CEPI pulpwood imports in 2010 (CEPI 2011) from outside the CEPI region. 5) According to CEPI (2011), the consumption of domestic pulpwood is 118 million m3 for the CEPI region. (CF) = a conversion factor of 4.4 is used to convert the dry fiber component of the material into RWEs. (P1 and P2) refer to material streams with respect to other options. n.a. = no available information. | |||
Table 9 shows the wood material inputs and exits (expressed in millions of RWEs) of the European paper industry material chain in a balanced situation for the year 2010. The total RWE net value of both the input and exit streams is 173 million RWEs annually. The wood input consists of different virgin wood pulps. Additionally, it must be noted that 122 million RWEs of recycled fiber remains in the circulation in recycling.
The total wood inputs are 173 million RWEs:
- pulpwood imports used for pulp production (30 million RWEs)
- local pulpwood used for pulp production (113 million RWEs)
- imports of wood pulp (30 million RWEs)
The total wood exits are –173 million RWEs:
- net exports of paper (–38 million RWEs)
- paper that is uncollected and recovered paper used outside the paper industry (–89 million RWEs)
- net exports of recovered paper (–24 million RWEs)
- process losses in recycled fiber pulp production (–22 million RWEs)
A region has to be in balance when summing up the RWE values for material inputs and exits in order for the material chain to properly function. Europe is a net importer of wood fiber in the form of pulpwood and wood pulp. On the other hand, the region is a net exporter of fiber in the form of paper and recovered paper. Though the European paper recycling rate is high, approximately 69% in 2010 (CEPI 2011), the region annually loses 111 million RWEs of fiber from circulation for intra-regional reasons. The volume of fiber that exits the material chain is termed other options in this study, and it consists of two streams, namely P1 (89 million RWEs) and P2 (22 million RWEs). Stream P1 consists of uncollected paper, sorting losses, contamination, and recovered paper used outside the paper industry. Stream P2 consists of losses in the recycled fiber manufacturing processes. Part of the volume listed as other options (P1 + P2) is incinerated and used for energy production or landfilled, and thus, it is permanently lost from the circulation.
A volume of 122 million RWEs returns to circulation during the paper production stage. This is the volume of recycled fiber used as a substitute for virgin fibers (see Fig. 4).
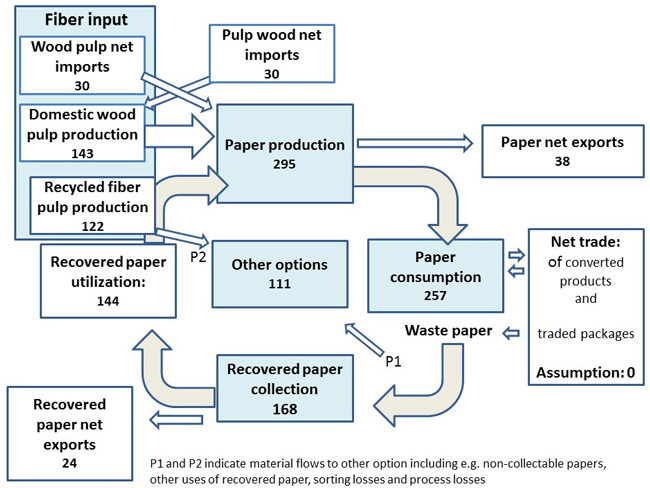
Fig. 4. The material framework for the European paper industry in 2010 and the wood material content of different materials expressed in millions of RWEs annually.
The total European input of wood fiber from outside the region was 60 million RWEs. This figure consists of net imports of wood fiber in wood pulp (30 million RWEs) and 30 million RWEs of imported pulpwood.
All wood fibers originate from forests. However, the volume of wood fiber related to wood pulp production does not come directly from forests. For example, in Finland approximately 20% of the wood used in virgin pulp production consists of wood residues, such as sawdust and wood chips, from mechanical wood processing industries (Luke 2015).
The results of this study concerning the RWE conversion factor related to paper are close to the universal RWE conversion factor used by the Global Timber Organization (2015), which states that a conversion factor of 3.5 RWEs per ton of paper can be used irrespective of the source or type of paper. Additionally, FAO/UNECE (2010) uses a RWE conversion factor of 3.6 per ton of paper, which includes all grades of paper. This figure is based on the FAO/UNECE (2010) Forest Products Conversion Factor Questionnaire. However, only Slovakia responded to that particular question.
The difference between these conversion factors 3.1 (introduced in this study), 3.5 Global Timber Organization) and 3.6 (FAO/UNECE) can be explained by the fact that the Global Timber Organization’s (2015) conversion factor was calculated several years ago when the share of different paper grades and the shares of different fiber raw materials used to produce the paper grades were different. Additionally, the RWE conversion factor used for wood pulp is similar to the corresponding conversion factors of several other organizations.
As one example, according to FAO/UNECE (2010) 4.55 RWEs of wood is required to produce one ton of bleached sulphate wood pulp. The corresponding figure for mechanical pulp is 2.5 RWEs. The Global Timber Organization (2014) uses a conversion factor of 4.5 to convert one ton of wood pulp into RWEs. The Global Timber Organization does not define the pulp grade in question, but the conversion factor is close to those used by FAO /UNECE (2010), Pöyry (2006), and Indufor (2013) for total bleached sulphate pulp and unbleached sulphate pulp as well as the average for bleached sulphate softwood pulp and bleached sulphate hardwood pulp. The total share of these three sulphate pulp grades was 94% of the chemical wood pulp consumed in the CEPI region in 2010 (CEPI 2011). This means that the aggregate sulphate pulp conversion factor is close to the total chemical pulp conversion factor.
Thus, it can be argued that the RWE conversion factors presented in this study can be used to estimate the relationship between different paper industry-related materials and wood expressed in RWEs. However, it must be noted that with respect to paper, these conversion factors should only be used for total paper and for a large geographical region. This is due to the fact that in the case of, for example, individual companies and countries, the shares of different paper grades out of total paper production as well as the raw material furnishes in different paper grades may differ considerably from each other.
5 Discussion
The recycling rate indicates the level of material recycling activity in a particular region or in a particular country. The European Commission legislation as well as the European paper industry recycling declarations (ERPA 2003; ERPC 2006 2011) have set recycling rate targets for different materials. The results of this study indicate that the role of virgin wood pulp injection in the paper industry is more important than the high recycling rate figures indicate.
To keep the paper industry’s fiber raw material supply and demand in balance in the long term, detailed sub-regional analyses are needed to guide investments within the pulp and paper industry, while considerable volumes of virgin fiber injection will also be required in the future. The future demand for different virgin pulp grades depends greatly on the grade structure of the paper grades being produced as well as on the share of recycled fibers utilized in the production of these particular paper grades.
In fact, there are two fiber chains in paper industry, namely the virgin fiber chain and the recycling chain. In the recycling chain waste paper can be compared to forests in the virgin fiber chain. After collection and sorting, waste paper turns into recovered paper which can be used as raw material in recycled pulp production. This means that in RWE calculations both recovered paper and pulpwood are raw materials in pulp production including both wood pulp and recycled pulp.
Consumed paper products form a huge fiber potential which can be utilized to replace and substitute virgin fibers in several end uses. COST E48 (2010) introduces a question: “could it be that the paper industry will need to supervise the ‘urban’ forest in a similar manner to that required to oversee forestry operations in the virgin fiber arena?” In this context the term ‘urban forest’ refers to post-consumed paper and board products. A reliable measuring system has to be developed to evaluate the real importance of material recycling as a means to supply fiber to industry. Paper and pulp industry is no more only a part of forest industry but a part of recycling industry.
The results of this study make it possible to compare recovered paper utilization volumes and wood volumes with each other. The introduced converting factors can be used for example to quantify the effects of material recycling to climate change.
6 Conclusions
The material framework for the paper industry describes the streams and stages of different materials. In this study, relevant material streams have been identified and quantified. European figures were used to quantify the material stream volumes in a selected region.
The findings of this study provide a new means for quantifying the wood material volumes of different materials within the paper industry at different stages of the material chain. The study has introduced the general conversion factors used to convert wood pulp, paper, and recovered paper into roundwood equivalents (RWEs) in the year 2010. The values of the conversion factors used for different materials are as follows:
- a ton of wood pulp is equivalent to 4.0 RWEs
- a ton of paper is equivalent to 3.1 RWEs
- a ton of recovered paper is equivalent to 3.0 RWEs
Paper recycling has an enormous effect on reducing the need for pulpwood in pulp and paper manufacturing. The total European recovered paper utilization volume in 2010 was 48.3 million tons, which corresponds to 144 million RWEs.
When estimating how much additional pulpwood would be required if the recycling rate were 0% and paper production remained unchanged, it is necessary to estimate the volume of fiber that returns as recycled fiber during the paper production stage. In this case, the missing volume of recycled fiber should be replaced with virgin fiber pulps. In Europe, this volume corresponds to 122 million RWEs. By using the calculated conversion factors, an additional volume of 31 million tons of virgin wood pulps would be required to produce the same amount of paper.
The global collection of recovered paper that can be utilized in paper manufacturing was 222 million tons in 2010 (Magnaghi 2013). By using the introduced conversion factors, and given the assumption that paper recycling did not occur and that the paper production volume remained unchanged, an additional volume of 666 million RWEs worth of wood would be required globally per annum. This RWE volume is approximately the same as 1.6 times the total removal of wood in Europe (EU-27), or the total annual removal of wood in the USA, Canada, and Brazil, combined, which was 701 million m3 in 2010 (FAO 2015).
The author of this study states that the calculation concerning the needed additional volume of wood is only theoretical. If no recycled fiber were used, many paper grades like newsprint and packaging grades which utilize great volumes of recovered paper, would not be produced at all by using more costly wood pulps. Due to economic reasons, the grade structure of paper production would be different if only wood pulps were used as raw material.
The results of this study can be used as a guideline for other recyclable materials, too. By utilizing the identified streams and stages of the material framework, and by defining a general denominator for different materials, it is possible to reliably quantify different material streams and calculate recycling rates for other materials, such as plastics, metal, and glass, too.
References
AF&PA (American Forest & Paper Association, Recovered Paper Group) (2008). 2008 annual statistical summary recovered paper utilization. 22nd edition. AF&PA, Washington DC, USA.
AuRPS (Australian Recovered Paper Specifications) (2002). The Australian council of recyclers. http://www.acor.org.au. [Cited 14 Feb 2003].
Biermann C.J. (1996). Pulping and papermaking. 2nd edition. Department of forest products and center for advanced materials research. Academic Press, San Diego, California, USA.
BIR (Bureau of International Recycling) (2013). Ten questions on paper recovery and recycling. http://www.bir.org/industry/paper/. [Cited 29 Jan 2016].
CEPI (Confederation of European Paper Industries) (2011). Annual statistics 2010. CEPI, Brussels, Belgium.
COST E48 (2010). The future of paper recycling. The final report of COST Action E48 “The limits of paper recycling”. European Science Foundation and COST Office, Brussels, Belgium. http://www.cost.eu/module/download/53628. [Cited 20 Apr 2015].
EN 643 (2002). European list of standard grades of recovered paper and board. European Committee for Standardization (CEN), Bracknell, UK.
EN 643 (2013). Paper and board - European list of standard grades of recovered paper and board. European Committee for Standardization (CEN), Bracknell, UK. http://www.cepi.org/system/files/public/documents/publications/recycling/2013/CEPI_EN%20643_brochure_FINAL.pdf. [Cited 23 Jan 2016].
ERPA (European Recovered Paper Association) (2003). The European declaration on paper. Recovery, annual report (2002). ERPA, Brussels, Belgium. http://www.paperrecovery.org/uploads/Modules/Publications/ERPC%20AR%202002%203%20-164552A.pdf. [Cited 27 Jan 2016].
ERPC (European Recovered Paper Council) (2006). CEPI. European declaration on paper recycling 2006–2010. ERPC, Brussels, Belgium. http://www.paperrecovery.org/uploads/Modules/Publications/EuroDec_06_10_2Web-115335A.pdf. [Cited 28 Jan 2016].
ERPC (European Recovered Paper Council) (2011). CEPI. European declaration on paper recycling 2011–2015. ERPC, Brussels, Belgium. http://www.paperrecovery.org/uploads/Modules/Publications/DeclarationonPaperRecycling_WebVersion.pdf. [Cited 25 Jan 2016].
Ervasti I. (2015). Chaos in terminology related to material recycling in paper industry. Licenciate thesis. Aalto University, School of Science, Espoo, Finland. https://aaltodoc.aalto.fi/bitstream/handle/123456789/15762/lic_ervasti_ilpo_2015.pdf?sequence=1.
Ervasti I., Kauranen I. (2011). Unbundling the chaos: revealing inconsistencies in paper recycling related terminology. Seminar paper. Doktoranden Treffen, TU-Dresden, Germany.
Ervasti I., Miranda R., Kauranen I. (2016). Paper recycling framework, the “Wheel of Fiber”. Journal of Environmental Management 174: 35–44. http://dx.doi.org/10.1016/j.jenvman.2016.03.004.
Eurostat (2015). Glossary: Tonnes of oil equivalent (toe). http://ec.europa.eu/eurostat/statistics-explained/index.php/Glossary:Tonnes_of_oil_equivalent_(toe). [Cited 14 Dec 2015].
FAO (Food and Agriculture Organization of the United Nations) (2010). Recovered paper data, annual statistics. FAO, Rome, Italy.
FAO (2015). Global forest resources assessment 2015. Desk reference. FAO, Rome, Italy.
FAO/UNECE (United Nations Economic Commission for Europe) (2010). Forest product conversion factors for the UNECE region. Geneva timber and forest discussion paper 49. Geneva, Switzerland.
FOEX Indexes Ltd. (2013). http://www.foex.fi. [Cited 4 May 2013].
Forest Legality Alliance (2014). A World Resources Institute website. http://www.forestlegality.org/glossary-term/round-wood-equivalent. [Cited 3 Feb 2015].
Global Timber Organization (2015). Roundwood equivalent volume “RWE volume”. http://www.globaltimber.org.uk/rwevolume.htm. [Cited 16 Dec 2014].
GOST 7933 (2003). Russian recovered paper classification, TU 5422-004-47975996-2003. Russian standards and technical regulation.
Grossmann H. (2009). Scenarios for the development of manufacturing industries in Europe with special emphasis on paper and board recycling. COST Action E48 “The Limits of Paper Recycling”. Final Conference. Munich, Germany, May 6–7, 2009.
Indufor Oy (2013). European Commission. Wood raw material supply and demand for the EU Wood-processing industries. Study for DG Enterprise and industry. Commission staff working document SWD, 343. http://ec.europa.eu/enterprise/sectors/wood-paper-printing/documents/index_en.htm. [Cited 23 Apr 2014].
ISRI (Institute of Scrap Recycling Industries, Inc.) (2009). Guidelines for paper stock: PS-2009-Domestic transactions. ISRI, Washington D.C.
Keränen J., Ervasti I. (2014). Amounts of non-fibrous components in recovered paper. Resources, Conservation and Recycling 92: 151–157. http://dx.doi.org/10.1016/j.resconrec.2014.09.010.
Koskinen K. (2000). Chemical pulping, chapter 4. In: Gullichsen J., Fogelholm C.-J. (eds.). Papermaking science and technology. Paper Engineers’ Association, Jyväskylä, Finland.
Li P., Ramaswamy S., Bjegovic P. (2003). Pre-emptive control of moisture content in paper manufacturing using surrogate measurements. Transactions of the Institute of Measurement and Control 25(1): 36–56. http://dx.doi.org/10.1191/0142331203tm070oa.
Luke (Natural Resources Institute Finland) (2015). Wood consumption in Finland 2014. http://stat.luke.fi/en/wood-consumption-2014_en.
Magnaghi G. (2013). Recovered paper market in 2010. Recovered paper statistics. BIR (Bureau International Recycling). Global facts & figures, recovered paper. p. 10. http://www.bir.org/assets/Documents/publications/brochures/7566PaperReport2013.pdf.
Martin J.R. (2009). Management accounting: concepts, techniques and controversial issues. Obtido em 3, chapter 5. http://maaw.info/Chapter5.htm.
Miranda R., Bobu E., Grossmann H., Stawicki B., Blanco A. (2010). Factors influencing a higher use of recovered paper in the European paper industry. Cellulose Chemistry and Technology 44(10): 419–430.
OECD (2015). Energy statistics of OECD countries 2014. http://www.oecd-ilibrary.org/docserver/download/6114211e.pdf?expires=1469626584&id=id&accname=ocid177143&checksum=65ACA6A23081640599D2F1921976CB56. [Cited 3 Dec 2016].
Pöyry (2006). World fibre outlook up to 2020. Volume I, executive report, 2006 edition. Pöyry, Helsinki, Finland.
PRASA (Paper Recycling Association of South Africa) (2012). South African standard grade definitions for recovered paper. PRASA, Guatang, South Africa. http://www.prasa.co.za. [Cited 22 May 2013].
PRPC (Japanese Paper Recycling Promotion Center) (2015). Statistics of recovered paper in Japan 2005; 2009; 2010; 2012; 2015. PRPC, Tokyo, Japan. http://www.prpc.or.jp/linkfile/english-paperrecycling.pdf. [Cited 20 Jun 2016].
Putz H.-J. (2010). Collection systems, sources, sorting, quality and storage of recovered paper. In: Höke U., Schabel S. (eds.). Recycled fiber and de-inking, papermaking science and technology. 2nd edition. Paper Engineers’ Association, Porvoo, Finland. p. 41–86.
Sveriges pappersindustriförbundet (1969). Papper och pappermassa. [Paper and wood pulp]. Leaflet. Educational material for paper industry companies. Sveriges pappersindustriförbundet, Stockholm, Sweden.
Tapion taskukirja (1975). Metsä- ja puutalousmiesten sekä metsänomistajien käsikirja. [Hand book for forestry experts and forest owners]. 17th edition. Keskusmetsälautakunta Tapio, Jyväskylä, Finland. p. 423–459.
UPM (2011). Making paper. http://www.upmpaper.com/en/Papers/downloads/brochures/Documents/UPM_Making_paper_brochure_Web_19186_0.pdf. [Cited 13 Nov 2015].
Zhao H. (2012). Outlook for global recovered paper markets. 4th National Congress on Recovered Paper, November 22th, Madrid, Spain.
Total of 41 references.
