Aarne Hovi  ,
Pekka Raitio,
Miina Rautiainen
,
Pekka Raitio,
Miina Rautiainen
A spectral analysis of 25 boreal tree species
Hovi A., Raitio P., Rautiainen M. (2017). A spectral analysis of 25 boreal tree species. Silva Fennica vol. 51 no. 4 article id 7753. https://doi.org/10.14214/sf.7753
Highlights
- An extensive spectral library containing leaf and needle reflectance and transmittance spectra was collected
- The spectra openly available in SPECCHIO Spectral Information System
- Effects of tree species, leaf/needle side, canopy position, and needle age on spectra were quantified
- Seasonal variations were measured for four species
- Spectra analysis highlights the importance of shortwave-infrared region in separating tree species.
Abstract
Spectral libraries have a fundamental role in the development of interpretation methods for airborne and satellite-borne remote sensing data. This paper presents to-date the largest spectral measurement campaign of boreal tree species. Reflectance and transmittance spectra of over 600 leaf and needle samples from 25 species were measured in the Helsinki area (Finland) using integrating sphere systems attached to an ASD FieldSpec 4 spectroradiometer. Factors influencing the spectra and red edge inflection point (REIP) were quantified using one-way analysis of variance. Tree species differed most in the shortwave-infrared (1500–2500 nm) and least in the visible (400–700 nm) wavelength region. Species belonging to same genera showed similar spectral characteristics. Upper (adaxial) and lower (abaxial) leaf sides differed most in the visible region. Canopy position (sunlit/shaded) had a minor role in explaining spectral variation. For evergreen conifers, current and previous year needles differed in their spectra, current-year needles resembling those of broadleaved and deciduous conifers. Two broadleaved species were monitored throughout the growing season (May–October), and two conifers were measured twice during summer (June, September). Rapid changes were observed in the spectra in early spring and late autumn, whereas seasonal variations during summer months were relatively small for both broadleaved and coniferous species. Based on our results, shortwave-infrared seems promising in separating tree species, although it is to-date least studied. The spectral library reported here (Version 1.0) is publicly available through the SPECCHIO Spectral Information System.
Keywords
albedo;
leaf;
needle;
reflectance;
transmittance;
integrating sphere;
spectrometer
-
Hovi,
Aalto University, Department of Built Environment, P.O. Box 14100, FI-00076 Aalto, Finland
E-mail
aarne.hovi@aalto.fi
- Raitio, Aalto University, Department of Built Environment, P.O. Box 14100, FI-00076 Aalto, Finland E-mail pekka.raitio@aalto.fi
- Rautiainen, Aalto University, Department of Built Environment, P.O. Box 14100, FI-00076 Aalto, Finland; Aalto University, Department of Electronics and Nanoengineering, P.O. Box 15500, FI-00076 Aalto, Finland E-mail miina.a.rautiainen@aalto.fi
Received 20 June 2017 Accepted 7 September 2017 Published 12 September 2017
Views 87547
Available at https://doi.org/10.14214/sf.7753 | Download PDF

Supplementary Files
1 Introduction
Spectral remote sensing data collected by sensors located on airborne or satellite-borne platforms is the only feasible technique for cost-effectively monitoring the environment for spatially extensive areas, from local to global scales. Satellite data can be used in, for example, monitoring pollution and human living environments, predicting near-real time crop harvests for large areas, and mapping forest growth and health. The amount of available remote sensing data is rapidly increasing. To make the most of this technological revolution, we must also invest in know-how in interpreting the massive data sets. Spectral libraries are increasingly important as both satellite and airborne remote sensing techniques are moving towards utilizing spectral information. We can anticipate a clear demand for spectral libraries as several global hyperspectral satellite missions (e.g. EnMAP, FLEX, PRISMA) are launched into space during the coming decade and also as the use of hyperspectral sensors in local airborne remote sensing activities increases.
A spectral library of tree species contains reflectance and transmittance spectra of, for example, leaves of tree species. Leaf spectra have a key role in the development and application of physically-based reflectance models, and are needed for upscaling from leaf level to canopy level spectra (Stenberg et al. 2016). Many global maps of vegetation, such as the MODIS leaf area index product which has been produced weekly since 2000 (Knyazikhin et al. 1998), rely on leaf spectra in their interpretation algorithms. In spite of the obvious need for leaf-level spectral data, different methodologies and lacking metadata have made it difficult to compare data from existing spectral libraries, thus complicating their use. Recently, there have been efforts to collect vegetation spectra, including optical properties of leaves and needles, into comprehensive open databases that gather data from different measurement campaigns and make them openly and easily available for algorithm developers and remote sensing scientists (Hueni et al. 2009; EcoSIS 2017).
Although laboratory measurements of leaf optical properties have been conducted for a long time (Gates 1965), spectra of boreal tree species have not been extensively measured and analyzed. The previous major effort was as part of the BOREAS project over two decades ago (Middleton et al. 1997; Middleton and Sullivan 2000). The database collected during BOREAS comprised only North American tree species and was limited to the wavelength range of 400–1100 nm, thus lacking the shortwave infrared wavelengths which are critical in new satellite missions. Later, peak season spectra for three Finnish species have been reported by Lukeš et al. (2013) and 12 tree species (some of them boreal) in Japan by Noda et al. (2014). Seasonal time series of spectra for two Estonian broadleaved species was reported by Mõttus et al. (2014). However, a larger comparative analysis of both Eurasian and North American species in the boreal region has not been reported.
This paper presents to-date the largest spectral measurement campaign of leaves and needles of boreal tree species. We collected reflectance and transmittance spectra of 25 boreal tree species during peak growing season. In addition, seasonal dynamics of spectra in major Finnish tree species were measured. With the help of these data, we quantified the influence of tree species, leaf or needle side, light environment, needle age, and time of season on leaf- and needle-level spectra. The spectral library documented here (Version 1.0) is openly available online through the SPECCHIO Spectral Information System to allow widespread use of the collected spectra, for example in development of remote sensing methods for boreal forests.
2 Materials and methods
2.1 Samples
We measured the reflectance and transmittance spectra of 25 tree species in summer 2016 (Table 1, Table 2). Two sets of data were collected: 1) a spectral data set of all study species around peak growing season (4 July–14 September), and 2) a time series of spectra for the dominating tree species in Finland (Betula pendula Roth, Picea abies (L.) Karst., Pinus sylvestris L., Populus tremula L.) from May to October. The leaf or needle samples were collected from four sites in the Helsinki area (Finland): Otaniemi campus (60°11´N, 24°49´E), Viikki arboretum (60°13´N, 25°00´E), Kumpula botanical garden (60°12´N, 24°57´E), and Ruotsinkylä research forest (60°22´N, 24°59´E).
| Table 1. Samples of broadleaved species. Time series measurements are in bold. Time series measurements were used only when analyzing the seasonal variations in the spectra. | ||||||||
| Species | Location | Date(s) | N trees | Tree height, m | Canopy positions* | N samples per each canopy position in a tree | Leaf sides** | N measured spectra |
| Acer platanoides | Otaniemi | 8.7.2016 | 2 | 6.2, 13.2 | E/S | 3 | A/B | 24 |
| Alnus glutinosa | Otaniemi | 8.7.2016 | 2 | 13.6, 22.1 | E/S | 3 | A/B | 24 |
| Alnus incana | Otaniemi | 6.7.2016 | 2 | 6.2, 18.0 | E/S | 3 | A/B | 24 |
| Betula papyrifera | Kumpula | 12.7.2016 | 2 | 13.7, 17.1 | E/S | 3 | A/B | 24 |
| Betula pendula | Otaniemi | 16.–17.5.2016 | 3 | 5.6, 6.1, 7.2 | E/S | 3 | A/B | 36 |
| 20.5.2016 | 1 | 7.2 | E/S | 3 | A/B | 12 | ||
| 2.-3.6.2016 | 3 | 5.6, 6.1, 7.2 | E/S | 3 | A/B | 36 | ||
| 29.6.2016 | 3 | 5.6, 6.1, 7.2 | E/S | 3 | A/B | 36 | ||
| 28.7.2016 | 3 | 5.6, 6.1, 7.2 | E/S | 3 | A/B | 36 | ||
| 25.8.2016 | 3 | 5.6, 6.1, 7.2 | E/S | 3 | A/B | 36 | ||
| 7.10.2016 | 3 | 5.6, 6.1, 7.2 | E/S | 3 | A/B | 36 | ||
| Populus balsamifera | Kumpula | 12.7.2016 | 1 | 4.8 | E | 12 | A/B | 24 |
| Populus tremula | Otaniemi | 17.5.2016 | 3 | 8.2, 8.9, 10.3 | E/S | 3 | A/B | 36 |
| 20.5.2016 | 1 | 8.2 | E/S | 3 | A/B | 12 | ||
| 2.-3.6.2016 | 3 | 8.2, 8.9, 10.3 | E/S | 3 | A/B | 36 | ||
| 29.–30.6.2016 | 3 | 8.2, 8.9, 10.3 | E/S | 3 | A/B | 36 | ||
| 28.–29.7.2016 | 3 | 8.2, 8.9, 10.3 | E/S | 3 | A/B | 36 | ||
| 25.8.2016 | 3 | 8.2, 8.9, 10.3 | E/S | 3 | A/B | 36 | ||
| 10.7.2016 | 3 | 8.2, 8.9, 10.3 | E/S | 3 | A/B | 36 | ||
| Populus tremuloides | Ruotsinkylä | 21.7.2016 | 1 | 17.8 | E/S | 6 | A/B | 24 |
| Prunus padus | Otaniemi | 8.7.2016 | 2 | 8.5, 9.1 | E/S | 3 | A/B | 24 |
| Quercus robur | Otaniemi | 6.7.2016 | 2 | 3.1, 21.6 | E/S | 3 | A/B | 24 |
| Salix caprea | Otaniemi | 4.7.2016 | 2 | 11.9, 16.7 | E/S | 3 | A/B | 24 |
| Sorbus aucuparia | Otaniemi | 6.7.2016 | 2 | 11.5, 13.0 | E/S | 3 | A/B | 24 |
| Tilia cordata | Viikki | 24.8.2016 | 2 | 5.8, 16.7 | E/S | 3 | A/B | 24 |
| * E = Sun-exposed, S = shaded ** A = adaxial, B = abaxial | ||||||||
| Table 2. Samples of coniferous species. Time series measurements are in bold. These were only used when analyzing the seasonal variations in the spectra. | |||||||||
| Species | Location | Date(s) | N trees | Tree height, m | Canopy positions* | Age cohorts** | N samples per each canopy position and age cohort in a tree | Needle sides*** | N measured spectra |
| Abies balsamea | Viikki | 20.7., 17.8.2016 | 2 | 11.1¸12.7 | E/S | c0/c1 | 3 | A/B | 48 |
| Abies sibirica | Viikki | 23.8.2016 | 1 | 23.7 | E/S | c0/c1 | 3 | A/B | 24 |
| Larix gmelinii | Viikki | 4.8.2016 | 1 | 14.1 | E/S | c0 | 6 | A/B | 24 |
| Larix laricina | Viikki | 22.8.2016 | 1 | 16.7 | E/S | c0 | 6 | A/B | 24 |
| Larix sibirica | Viikki | 3.8.2016 | 1 | 26.7 | S | c0 | 12 | A/B | 24 |
| Picea abies | Otaniemi | 14.–23.6.2016 | 2 | 16.4, 22.6 | E/S | c0/c1 | 3 | - | 24 |
| 26.7.–1.8.2016 | 2 | 16.4, 22.6 | E/S | c0/c1 | 3 | - | 24 | ||
| 12.–13.9.2016 | 2 | 16.4, 22.6 | E/S | c0/c1 | 3 | - | 24 | ||
| Picea glauca | Viikki | 30.8.2016 | 2 | 11.4, 14.9 | E/S | c0/c1 | 3 | - | 24 |
| Picea mariana | Viikki | 18.–19.8.2016 | 2 | 8.4, 9.0 | E/S | c0/c1 | 3 | - | 24 |
| Pinus banksiana | Viikki | 19.8., 24.8.2016 | 1 | 13.7 | E/S | c0/c1 | 6 | A/B | 48 |
| Pinus contorta | Viikki | 18.7., 17.8.2016 | 2 | 17.1, 19.7 | E/S | c0/c1 | 3 | A/B | 48 |
| Pinus sylvestris | Otaniemi | 17.–22.6.2016 | 2 | 13.3, 14.2 | E/S | c0/c1 | 3 | A/B | 48 |
| 22.–25.7.2016 | 2 | 13.3, 14.2 | E/S | c0/c1 | 3 | A/B | 48 | ||
| 12.–14.9.2016 | 2 | 13.3, 14.2 | E/S | c0/c1 | 3 | A/B | 48 | ||
| Pseudotsuga menziesii | Viikki | 11.7., 16.8.2016 | 2 | 20.7, 26.2 | E/S | c0/c1 | 3 | A/B | 48 |
| * E = Sun-exposed, S = shaded ** c0 = current year needles, c1 = previous year needles *** A = adaxial, B = abaxial | |||||||||
For each tree species, we detached branches from two trees from sun-exposed and shaded locations in each tree crown according to the methodology used by Lukeš et al. (2013). The sampled trees were randomly selected from those available in the study areas. Trees with obvious pathogen infections, insect attacks or other damages were avoided. Because of the limited availability of trees and the difficulty to visually determine the site type in semi-natural environments (arboretum, botanical garden), site fertility was not considered in this study. The detached branches were placed in water containers, and stored in cool and dark conditions. Only healthy leaves or needles were used in the measurements which were made 0–12 hours after the branch had been detached from the tree. Immediately before spectral measurements in the laboratory, leaves or needles were detached from the branches. We use term “sample” to refer to a single leaf or a sample of needles. Six samples (i.e. three shaded + three sun-exposed) per tree were measured, yielding a total of 12 samples per species. For evergreen conifers we measured current (c0) and previous year (c1) needles separately, thus doubling the number of samples. For each sample, both adaxial and abaxial sides were measured. Total number of measured spectra was therefore 24 for broadleaved species and deciduous conifers, and 48 for evergreen conifers. Some exceptions to the sampling had to be allowed. These are explained below and listed in Tables 1 and 2.
For two species (Populus balsamifera L., Larix sibirica Ledeb.) it was not possible to separate sun-exposed and shaded canopy positions due to the size of the trees. For seven species (Abies sibirica Ledeb., Larix gmelinii (Rupr.) Rupr., Larix laricina (Du Roi) K. Koch, L. sibirica, Pinus banksiana Lamb., Populus balsamifera L., Populus tremuloides Michx.) only one tree was sampled, due to limited time resources or availability of trees in the study sites. Number of samples per tree was doubled in these cases, in order to obtain required number of samples. Only exception was A. sibirica, in which only half of usual number of samples was collected. This was because we had limited time for measurements, and because A. sibirica showed little variation in its spectra. In all spruces and one larch species (L. laricina, P. abies, Picea glauca (Moench) Voss, Picea mariana (Mill.) Britton, Sterns & Poggenb.), it was not possible to identify distinct adaxial and abaxial sides, which reduced the number of measured spectra to half. Finally, when collecting time series of broadleaved trees, three individuals of each species were sampled instead of two, which resulted in 36 spectra per species and measurement occasion.
2.2 Spectral measurements
We measured directional-hemispherical reflectance and transmittance factors (further referred to as reflectance and transmittance) for the leaf and needle samples in a laboratory using a FieldSpec 4 spectroradiometer manufactured by Analytical Spectral Devices Inc. (ASD) in the spectral range from 350 to 2500 nm. The spectral resolution of the spectroradiometer is 3 nm at 700 nm, and 10 nm at 1400 and 2100 nm. The sampling interval is either 1.4 nm (≤1000 nm) or 2 nm (>1000 nm). The spectroradiometer applies a weighted cubic spline interpolation and outputs the spectrum at 1 nm resolution. Reflectance and transmittance spectra were measured for each sample according to Tables 1 and 2.
For broadleaved species, the spectrometer was attached to a SpectroClip-TR double integrating sphere manufactured by Ocean Optics which had a 20 W tungsten halogen lamp (HL-2000-HP-FHSA, Ocean Optics) as its light source. The SpectroClip-TR instrument has two integrating spheres with 20 mm diameter. During spectral measurements, a flat sample (i.e. a leaf) is placed between the spheres and the clip is closed. The method is described in detail by Mõttus et al. (2017).
For measurements of coniferous needles, the spectrometer was attached to an RTS-3ZC integrating sphere manufactured by ASD which had a 10 W halogen light source (CL-10, ASD Inc.). Coniferous needles were fixed to special needle carriers developed by Malenovský et al. (2006). The reflectance and transmittance of the samples were measured using the classic comparison mode (Goebel 1967) recommended by the manufacturer. All coniferous samples were corrected for gap fraction using the method proposed by Mesarch et al. (1999). Technical details of coniferous needle measurements are documented in the Supplementary file S1 of this article.
2.3 Processing and analysis of spectra
Before the analyses of broadleaved species, data from wavelengths below 400 nm and above 2300 nm were discarded, because the signal levels in the measurement setup were not sufficient, and the spectra were extremely noisy in these regions. For conifers, the entire wavelength range from 350 to 2500 nm was analyzed.
All spectra were smoothed with a Savitzky-Golay filter (Savitzky and Golay 1964). For each data point, it fits a polynomial to all points that lie within a given distance (half of window size) from the data point. We used a second order polynomial, and a window size of 15 nm for wavelengths up to 1000 nm and 39 nm for wavelengths above 1000 nm. These values were determined by testing different values and visually comparing filtered against unfiltered spectra. The chosen values performed maximal amount of smoothing without altering the characteristics features (e.g. absorption peaks) in the spectra. For very noisy regions (>2100 nm in broadleaved, >2300 nm in conifers) the Savitzky-Golay filter was not optimal, and we applied an envelope-function in Matlab. It fits upper and lower envelopes to the signal, determined using spline interpolation over local maxima separated by at least n samples. A smoothed signal is then obtained as the mean of upper and lower envelopes. We repeated the procedure with n = [20, 25, 30, 35, 40], and used the mean of all iterations as the final filtered spectrum.
After spectra filtering, the red edge inflection point (REIP) was calculated for each reflectance and transmittance spectra as the maximum of first derivative spectrum. One-way analysis of variance (ANOVA) was used for quantifying the influences of tree species, adaxial vs. abaxial leaf side, shaded vs. sun-exposed canopy position, and needle age cohort in conifers on the reflectance, transmittance, and albedo (reflectance + transmittance) spectra as well as REIP values calculated from those spectra. The purpose of ANOVA was to determine which factors had a statistically significant influence on the spectra, and also to compare the explanatory power of the variables i.e. how large proportion of the variation in the spectra were explained by each of the independent variables. Because spectra of broadleaved and coniferous species were acquired with different methods, ANOVA was performed separately for these groups. For convenience of reporting, we refer to visible (VIS, 400–700 nm), near-infrared (NIR, 700–1300 m) and shortwave-infrared (SWIR, 1300–2500 nm) spectral regions throughout the results and discussion. Correlation analyses revealed that within these regions the values of spectra were highly correlated.
3 Results
3.1 Between and within-species variation in the spectra
3.1.1 Differences between species
Broadleaved species had higher SWIR reflectance than conifers (Fig. 1). They also had higher NIR, and notably higher SWIR transmittance. Deciduous conifers (Larix spp.) resembled broadleaved species in their spectra. Species explained up to 69%, 70%, and 62% of reflectance, transmittance, and albedo variability in the broadleaved species group (Fig. 2). In coniferous group the corresponding values were 71%, 70%, and 78% (Fig. 3). Between-species differences were the smallest in the visible wavelength region and increased towards longer wavelengths. Interestingly, genus explained almost as large a proportion of variability in the spectra as did species (Fig. 2, Fig. 3). In the broadleaved group this was expected since most of the genera included only one species. However, genus was a strong explanatory factor also in conifers, where several species per genus were measured. Species explained 45–67% of variability in REIP in the coniferous group, but only 12–24% in the broadleaved group (Table 3).
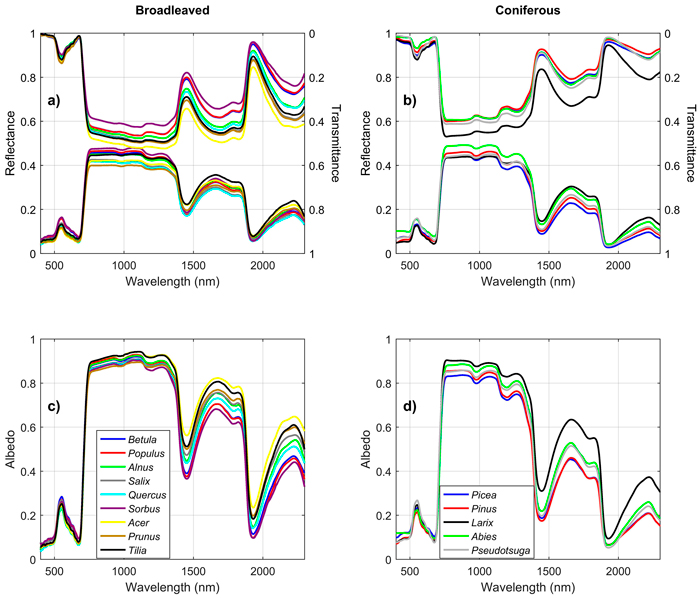
Fig. 1. Mean reflectance, transmittance, and albedo spectra by genus in broadleaved (a,c) and coniferous (b,d) trees. View larger in new window/tab.
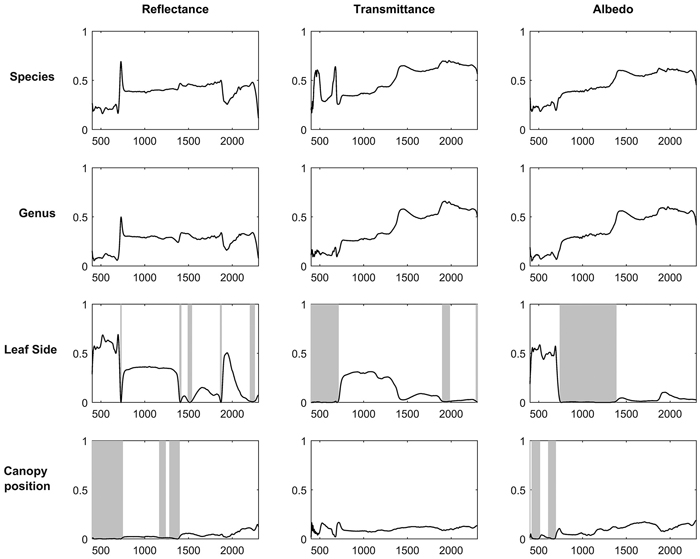
Fig. 2. Coefficients of determination (R2) when variability of reflectance, transmittance, and albedo spectra of broadleaved tree leaves were explained by species, genus, leaf side (adaxial/abaxial), and canopy position (sun-exposed/shaded) in one-way ANOVA. Statistically non-significant regions (p > 0.05) are highlighted in gray. The x-axis denotes wavelength (nm) and y-axis coefficient of determination (0–1).
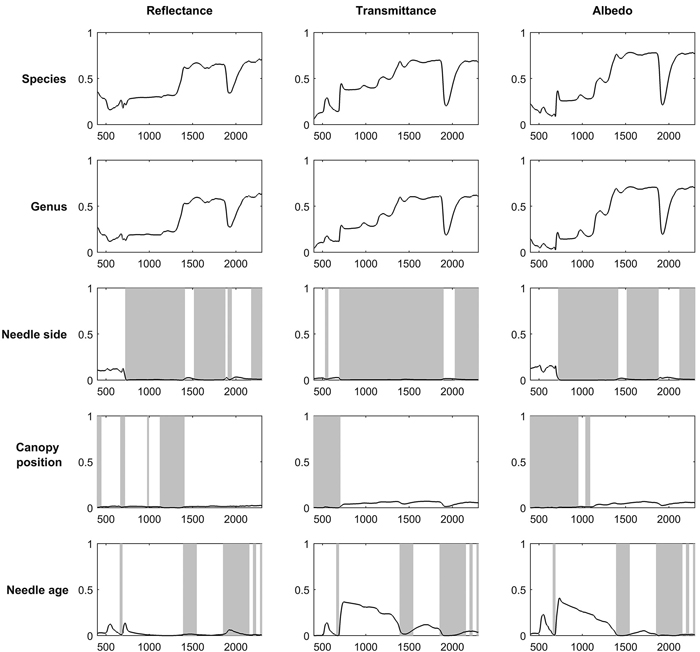
Fig. 3. Coefficients of determination (R2) when variability in reflectance, transmittance, and albedo spectra of coniferous needles were explained by species, genus, needle side (adaxial/abaxial), and canopy position (sun-exposed/shaded) in one-way ANOVA. Statistically non-significant regions (p > 0.05) are highlighted in gray. The x-axis denotes wavelength (nm) and y-axis coefficient of determination (0–1).
| Table 3. Coefficients of determination (R2) when variability of red edge inflection point (REIP) were explained by species, genus, leaf or needle side (adaxial/abaxial), canopy position (sun-exposed/shaded), and needle age in one-way ANOVA. Corresponding p-value is given in brackets. | |||
| REIP (reflectance) | REIP (transmittance) | REIP (albedo) | |
| Broadleaved | |||
| Species | 0.12 (0.00) | 0.24 (0.00) | 0.23 (0.00) |
| Genus | 0.07 (0.00) | 0.12 (0.00) | 0.09 (0.00) |
| Leaf side | 0.45 (0.00) | 0.03 (0.00) | 0.16 (0.00) |
| Canopy position | 0.02 (0.03) | 0.07 (0.00) | 0.07 (0.00) |
| Coniferous | |||
| Species | 0.45 (0.00) | 0.67 (0.00) | 0.61 (0.00) |
| Genus | 0.29 (0.00) | 0.46 (0.00) | 0.41 (0.00) |
| Leaf side | 0.14 (0.00) | 0.00 (0.70) | 0.02 (0.01) |
| Canopy position | 0.00 (0.84) | 0.00 (0.38) | 0.00 (0.39) |
| Needle age | 0.07 (0.00) | 0.11 (0.00) | 0.09 (0.00) |
3.1.2 Differences between adaxial and abaxial sides
For broadleaved species, leaf side explained up to 69%, 31%, and 59% of reflectance, transmittance, and albedo variability (Fig. 2). For coniferous species the effects were smaller: up to 13%, 3%, and 16% of reflectance, transmittance, and albedo variability were explained (Fig. 3). The largest differences between leaf sides were seen in reflectance in the VIS region, where abaxial side showed notably higher reflectance compared to adaxial side, particularly in broadleaved species (Fig. 4a,b). In the coniferous group, VIS reflectance of abaxial side was high for species in which stomata are concentrated on the abaxial side (Abies spp., Pseudotsuga menziesii (Mirb.) Franco). In these cases, it is already visually seen that the abaxial side is whitish in color. Pinus spp., on the other hand, showed opposing behavior: the abaxial side was darker than adaxial, and in Larix spp. there was almost no difference. Transmittance was not affected by leaf side in the VIS region. In NIR and SWIR, abaxial side had always lower reflectance and higher transmittance compared to adaxial side. These effects were notably larger for broadleaved than for coniferous group. Leaf side explained 3–45% of variability in REIP in the broadleaved group, and 0–14% in the coniferous group (Table 3). Because the abaxial side had generally higher reflectance in the visible region, obviously also the REIP calculated from reflectance spectra was lower for the abaxial than adaxial side (difference of 11.3 nm in broadleaved, 4.6 nm in conifers).
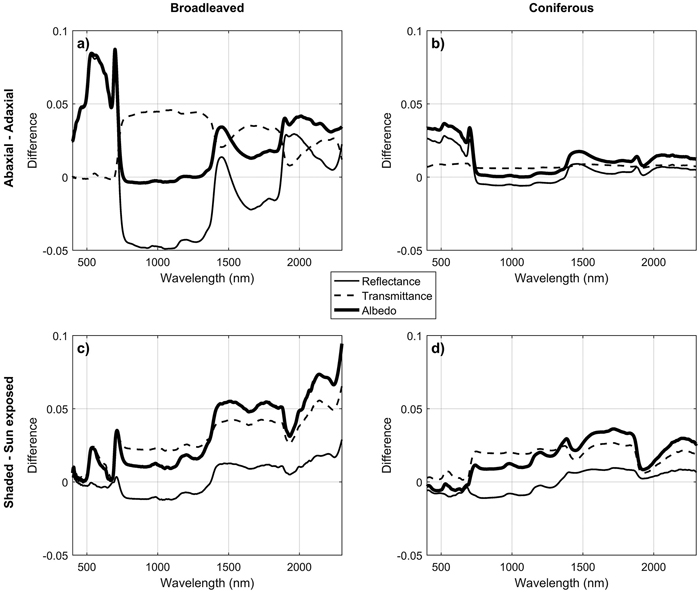
Fig. 4. Mean spectral differences between abaxial vs. adaxial sides of leaves and needles (a,b) and between shaded vs. sun-exposed canopy positions (c,d).
3.1.3 Differences between sun-exposed and shaded canopy positions
Canopy position explained a relatively small proportion of variability in the measured spectra. Coefficients of determination were up to 15% (broadleaved) and 3% (conifers) for reflectance, up to 17% and 7% for transmittance, and up to 19% and 7% for albedo (Fig. 2, Fig. 3). The effects of canopy position were similar for both broadleaved and coniferous species. Shaded foliage had high transmittance throughout the spectrum, and particularly in the SWIR region (Fig. 4c,d). On the other hand, reflectance was slightly lower in the shaded than sun-exposed foliage in all except SWIR regions, where slightly increased reflectance was observed for shaded foliage. REIP was consistently lower for shaded than sun-exposed canopy positions, but the differences were small in magnitude (0.1–3.8 nm). Canopy position explained 0% of REIP variability in conifers, and 2–7% in broadleaved species (Table 3).
3.1.4 Differences between needle age cohorts in conifers
Needle age had a notable influence on transmittance in the NIR region, where it explained up to 37% of transmittance variability (Fig. 3). Current year needles had max. 0.06 units higher NIR transmittance compared to previous year needles (Fig. 5). Similar, but smaller effects were seen in the SWIR region. In addition, in green wavelengths both reflectance and transmittance were clearly higher (and thus absorption lower) for current year than older needles. We also observed a clear shift of red edge inflection point towards longer wavelengths (3.4–4 nm) as the needles aged, although statistically the effect was small (Table 3).
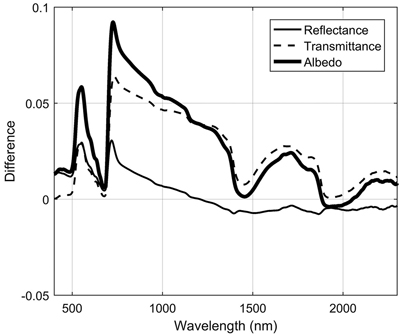
Fig. 5. Spectral differences between two age cohorts of coniferous needles (new i.e. current year – previous year).
3.2 Seasonal dynamics of leaf and needle spectra
Seasonal trends were similar in both studied broadleaved species (Betula pendula, Populus tremula). In the green and red wavelengths, a clear increase in absorption was observed in early spring (May), and a clear decrease in autumn (October) (Fig. 6). In NIR and SWIR, reflectance increased rapidly in the spring, and slowly but steadily during the summer and autumn. An opposite trend was seen in transmittance, and therefore the albedos in NIR and SWIR were almost constant throughout the growing season (Fig. 6). Only slightly lower absorption (higher albedo) was seen in the SWIR region in May compared to June–October. Trends in REIP followed the trends in absorption in the red wavelength region, i.e. rapid shift towards longer wavelengths in early spring, and opposite behavior in late autumn.
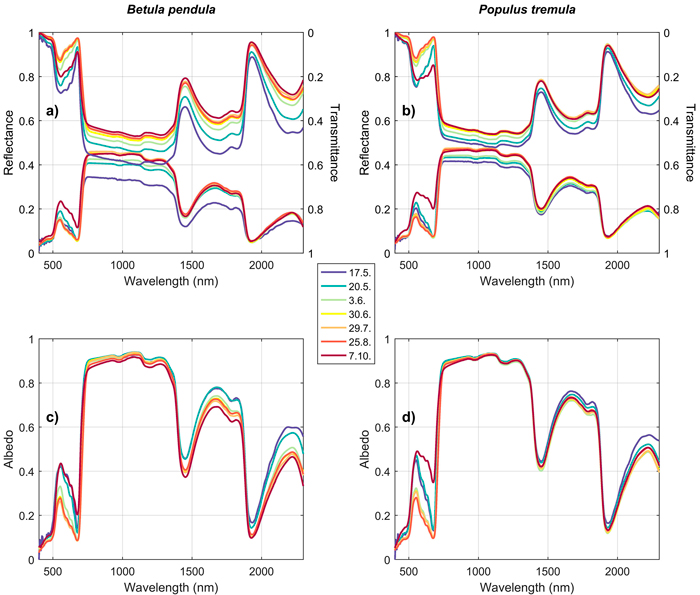
Fig. 6. Seasonal trends in silver birch (Betula pendula) (a,c) and European aspen (Populus tremula) (b,d) reflectance, transmittance, and albedo spectra. The color denotes time of measurement (last day if the measurements were obtained within two days). View larger in new window/tab.
For conifers, only two sets of time series measurements were successful (in June and in September) and are reported in this paper. A third set of measurements was collected in July (Table 2), but due to a slightly different type of needle carrier used, the measured spectra are not fully comparable to the other two sets of measurements and were thus omitted from the analysis. Based on the two successful sets of measurements, NIR reflectance of current year needles increased, and NIR reflectance of previous year needles decreased from June to September (Fig. 7). These trends were statistically significant (p < 0.05 in ANOVA) for all except current year needles of Picea abies. NIR transmittances were correlated with NIR reflectances, and showed the opposite trends, which were however statistically significant only for current year needles of Pinus sylvestris. Seasonal trends in the SWIR region were similar as in the NIR region, but smaller in magnitude. In the visible region, clear seasonal trend was seen only in the current year needles of P. sylvestris, which showed increasing absorption in the green wavelengths (i.e. lower reflectance and transmittance) towards autumn. No obvious trends in the visible regions were seen in current year needles of P. abies, or in previous year needles of either of the species.
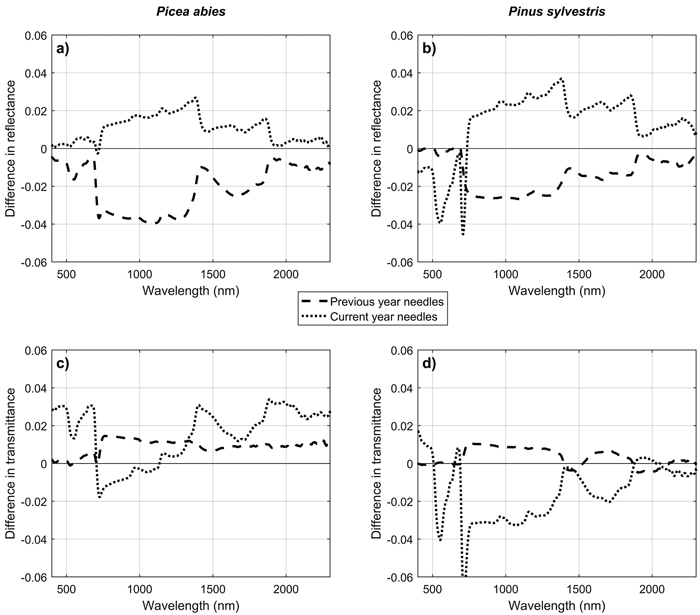
Fig. 7. Differences in mean reflectance (a,b) and transmittance (c,d) of Scots pine (Pinus sylvestris) and Norway spruce (Picea abies) needles between June and September. Difference was calculated as (mean in September – mean in June), separately for current year and previous year needles.
4 Discussion
As a summary of results, tree species and leaf side (adaxial vs. abaxial) were important factors in explaining spectral variation, whereas canopy position had a minor role. The findings were consistent in both broadleaved and coniferous groups, which suggests that the results can be generalized to large variety of species, and also confirms that the measurements were carefully conducted. In conifers, current year needles deviated from previous year needles notably. Rapid changes in broadleaved species spectra were observed in spring and autumn, and small but steady changes during summer months. Seasonal variations in current year coniferous needles were similar to broadleaved species, but older needles showed a different spectral behavior. In the following we will provide a more detailed discussion of our findings in relation to previous leaf optical properties measurements, ending up with concluding statements.
Two different methodologies were used in our measurements of coniferous and broadleaved species, and thus, comparisons between these groups were performed only qualitatively. The general differences in spectra between broadleaved and coniferous species are similar as observed when analyzing spectra from existing databases measured in boreal and temperate regions (Hosgood et al. 1995; Middleton and Sullivan 2000; Lukeš et al. 2013; Noda et al. 2014). All these studies show high NIR and particularly high SWIR transmission in the broadleaved species group. Spectra of Larix spp. has rarely been measured, but the few existing measurements support our finding that its spectra resemble broadleaved trees (Noda et al. 2014).
Detailed statistical analyses on influences of species- and other factors on spectra were performed separately for coniferous and broadleaved groups. Species explained an important proportion of spectral variability in all wavelengths. In both coniferous and broadleaved trees, between-species differences increased towards SWIR wavelengths. This is particularly interesting, since very little information on species separation in SWIR has been reported earlier. Between-species spectral differences in SWIR were larger for conifers than for broadleaved species. This was in spite of the fact that measurements of coniferous needles involved determination of gap fractions in the needles samples which possibly increased random variability in the measured spectra. This may indicate that the structural variation between species is larger in the coniferous than in the broadleaved group. In VIS and NIR wavelengths the differences between broadleaved and coniferous groups were not as obvious.
Results regarding differences between leaf sides are in line with Lukeš et al. (2013) who observed clear differences due to leaf side in visible reflectance of birch, and smaller, but opposite effects in the visible reflectance of pine. Also Mõttus et al. (2014) observed differences between leaf sides in visible reflectance of birch and alder. However, based on our data we can conclude that the effect of needle side in conifers is highly dependent on species, which has not previously been possible to report due to a limited number of sampled species. Our results support earlier findings that measuring both sides of leaves or needles is important in order to obtain a representative estimate of mean optical properties of the foliage in the canopy (e.g. Lukeš et al. 2013).
Canopy position, and thus light environment, had a relatively small influence on leaf optical properties. This is in line with earlier studies that have emphasized importance of species and needle age over light environment (Knapp and Carter 1998; O’Neill et al. 2002; Atherton et al. 2017). On the other hand, Lukeš et al. (2013) observed differences in coniferous needle reflectance between canopy positions, which were much larger than those observed in our study. It should be noted that even though the effect of canopy position was generally minor in our data, we observed larger effects for some individual species. The maximum height of the sampling equipment (8 m) limited our ability to reach the top of canopy for some of the species. However, the “sun-exposed” samples were always collected from crown positions that were exposed to direct sunlight. The fact that the effect of canopy position differed between species may also reflect differences in the light environments between our study sites and sampling locations of individual species, since the structure of forest affects the magnitude of differences in leaf optical properties between sun-exposed and shaded canopy positions (Atherton et al. 2017). Some of our sampled species grew on open sites with lots of light available even at the bottom of canopy, whereas some of the samples were collected from more closed-canopy forests. On the other hand, the structure of a forest varies also naturally, depending on the dominant species. Assessing the impact of light environment on leaf optical properties would require sampling species in their natural growth environment and collecting samples from the top of the canopy, which both are technically demanding tasks. Finally, it should be noted that even though the magnitude of the effect of canopy position was small in our study, the trends when moving from sun-exposed to shaded canopy positions were similar as observed earlier i.e. decreasing reflectance in VIS/NIR, stable or slightly increasing reflectance in SWIR, and increasing transmittance throughout the spectrum (Lukeš et al. 2013).
Compared to previous year needles, current year coniferous needles exhibited larger NIR and SWIR transmittance, lower absorption of green wavelengths, and shift of red edge inflection point towards lower wavelengths. It has been shown that the current year needles have low chlorophyll concentration compared to older needles (O’Neill et al. 2002), which explains the observed differences in the red edge inflection point. It is also likely that the current year needles are not as thick as older needles, which could explain their high transmittance in the NIR region. Overall, the results showed that current year needles are spectrally different from the other age cohorts. Since current year needles can account for a significant proportion of total needle area in a forest, it is important to include information about them in spectral databases. Because needle age clearly influenced the spectra, we repeated the analyses considering tree species, needle side, and canopy position separately for current and previous year needles. The results did not change considerably. Only the influence of species on REIP was stronger when analyzing current year needles alone, which may partly be caused by the fact that the measurements spanned over approximately two months’ time period.
The seasonal trends in broadleaved species were similar as observed earlier, and reflect changes in biochemical composition and thickness of the leaves (Möttus et al. 2014). Although these findings are not novel, the fact that we could reproduce the results confirms further that the measurements with the new SpectroClip system were carefully conducted, and that the new measurement technique is reliable. The findings regarding seasonal patterns of coniferous needles are interesting because, to our knowledge, no seasonal measurements of coniferous needle spectra have been reported before. Seasonal trends in current year needles (increasing reflectance and decreasing transmittance in NIR, increasing absorption in the visible region) are similar to what we observed for broadleaved species, and therefore the most likely explanations are changes in pigment composition as well as in needle thickness over growing season. The contrasting behavior of previous year needles is more difficult to explain. However, this finding indicates that also the spectra of older needles are dynamic. Overall, it should be noted that the differences in September vs. June spectra were small in magnitude: the maximum difference, observed for previous year needles of Pinus sylvestris, was 0.04 in absolute reflectance units. This is in line with our results on broadleaved species, in which no major changes were observed during June–August.
As a conclusion, the spectral library collected in this study considerably extends the existing spectral databases that contain only limited number of boreal tree species and/or limited wavelength regions. The large amount of spectral data enabled to conduct a comprehensive statistical analysis that revealed driving factors behind leaf and needle spectra. From the perspective of remote sensing, the most important finding was that there exist large between-species differences in the SWIR region. In addition, the red edge inflection point turned out to be relatively good in separating coniferous species, which is important considering the new hyper- and multispectral satellite missions (e.g. Sentinel-2) which have bands located at the red edge. Both SWIR and REIP correlated weakly with other wavelength regions, which further highlights their importance. The spectral library presented here is publicly available from SPECCHIO database, where it will serve the hyperspectral remote sensing community in attempts to interpret spectral signatures of vegetation, as well as a large range of modeling studies aiming at understanding ecosystem-atmosphere interactions.
Acknowledgments
This study was funded by Academy of Finland project BOREALITY (grant number 13286390). We thank University of Helsinki and Natural Resources Institute Finland for allowing us to collect samples from Viikki arboretum, Kumpula botanical garden, and Ruotsinkylä research forest. Special thanks to Pentti Kananen, Paula Havas-Matilainen, Daniel Richterich, Tapani Uronen, and Henry Väre who helped in finding and identifying some of the exotic species.
References
Atherton J., Olascoaga B., Alonso L., Porcar-Castell A. (2017). Spatial variation of leaf optical properties in a boreal forest is influenced by species and light environment. Frontiers in Plant Science 8: 309. https://doi.org/10.3389/fpls.2017.00309.
Gates D.M., Keegan H.J., Schleter J.C., Weidner V.R. (1965). Spectral properties of plants. Applied Optics 4(1): 11–20. https://doi.org/10.1364/AO.4.000011.
Goebel D. (1967). Generalized integrating-sphere theory. Applied Optics 6(1): 125–128. https://doi.org/10.1364/AO.6.000125.
Hosgood B., Jacquemoud S., Andreoli G., Verdebout J., Pedrini A., Schmuck G. (1995). Leaf optical properties experiment 93 (LOPEX93). Revised report EUR16095EN (JRC).
Hueni A., Nieke J., Schopfer J., Kneubühler M., Itten K. (2009). The spectral database SPECCHIO for improved long term usability and data sharing. Computers & Geosciences 35(3): 557–565. https://doi.org/10.1016/j.cageo.2008.03.015.
EcoSIS (2017). EcoSIS Spectral Library. https://ecosis.org/. [Cited 1 June 2017].
Knyazikhin Y., Martonchik J.V., Myneni R.B., Diner D.J., Running S.W. (1998). Synergistic algorithm for estimating vegetation canopy leaf area index and fraction of absorbed photosynthetically active radiation from MODIS and MISR data. Journal of Geophysical Research 103(D24): 32257–32275. https://doi.org/10.1029/98JD02462.
Lukeš P., Stenberg P., Rautiainen M., Mõttus M., Vanhatalo K. (2013). Optical properties of leaves and needles for boreal tree species in Europe. Remote Sensing Letters 4(7): 667–676. https://doi.org/10.1080/2150704X.2013.782112.
Knapp A.K., Carter G.A. (1998). Variability in leaf optical properties among 26 species from a broad range of habitats. American Journal of Botany 85(7): 940–946. https://doi.org/10.2307/2446360.
Malenovský Z., Albrechtova J., Lhotáková Z., Zurita-Milla R., Clevers J., Schaepman M., Cudlín P. (2006). Applicability of the PROSPECT model for Norway spruce needles. International Journal of Remote Sensing 27(24): 5315–5340. https://doi.org/10.1080/01431160600762990.
Mesarch M.A., Walter-Shea E.A., Asner G.P., Middleton E.M., Chan S.S. (1999). A revised measurement methodology for conifer needles spectral optical properties: evaluating the influence of gaps between elements. Remote Sensing of Environment 68(2): 177–192. https://doi.org/10.1016/S0034-4257(98)00124-2.
Middleton E., Sullivan J. (2000). BOREAS TE-10 leaf optical properties for SSA species. Data set. Oak Ridge National Laboratory Distributed Active Archive Center, Oak Ridge, Tennessee, U.S.A. https://daac.ornl.gov/.
Middleton E.M., Sullivan J.H., Bovard B.D., Deluca A.J., Chan S.S., Albert P. (1997). Seasonal variability in foliar characteristics and physiology for boreal forest species at the five Saskatchewan tower sites during the 1994 Boreal Ecosystem-Atmosphere Study. Journal of Geophysical Research 102(D24): 28831–28844. https://doi.org/10.1029/97JD02560.
Mõttus M., Sulev M., Hallik L. (2014). Seasonal course of the spectral properties of alder and birch leaves. IEEE Journal of Selected Topics in Applied Earth Observations and Remote Sensing 7(6): 2496–2505. https://doi.org/10.1109/JSTARS.2013.2294242.
Mõttus M., Hovi A., Rautiainen M. (2017). Theoretical algorithm and application of a double integrating sphere system for measuring leaf transmittance and reflectance spectra. Applied Optics 56(3): 563–571. https://doi.org/10.1364/AO.56.000563.
Noda H.M., Motohka T., Murakami K., Muraoka H., Nasahara K.N. (2014). Reflectance and transmittance spectra of leaves and shoots of 22 vascular plant species and reflectance spectra of trunks and branches of 12 tree species in Japan. Ecological Research 29(2): 111. https://doi.org/10.1007/s11284-013-1096-z.
O’Neill A.L., Kupiec J.A., Curran P.J. (2002). Biochemical and reflectance variation throughout a Sitka spruce canopy. Remote Sensing of Environment 80(1): 134–142. https://doi.org/10.1016/S0034-4257(01)00294-2.
Savitzky A., Golay M.J.E. (1964). Smoothing and differentiation of data by simplified least squares procedures. Analytical Chemistry 36(8): 1627–1639. https://doi.org/10.1021/ac60214a047.
Stenberg P., Mõttus M., Rautiainen M. (2016). Photon recollision probability in modelling the radiation regime of canopies – a review. Remote Sensing of Environment 183: 98–108. https://doi.org/10.1016/j.rse.2016.05.013.
Total of 19 references.
